ELSA Project: Toward a complex network approach to ATM delays analysis
←
→
Page content transcription
If your browser does not render page correctly, please read the page content below
ELSA Project: Toward a complex network approach
             to ATM delays analysis
                       F. Lillo                             S. Miccichè and R. N. Mantegna                V. Beato and S. Pozzi
       Scuola Normale Superiore di Pisa                Dipartimento di Fisica, Università di Palermo          Deep Blue s.r.l.
             Piazza dei Cavalieri 7                                Viale delle Scienze                     Piazza Buenos Aires 20
               I-56126 Pisa, Italy,                              I-90128 Palermo, Italy.                     00100 Roma, Italy.
                Santa Fe Institute
              1399 Hyde Park Rd.
          Santa Fe NM 87501, USA,
  Dipartimento di Fisica, Università di Palermo
               Viale delle Scienze
            I-90128 Palermo, Italy.

   Foreword - This paper describes a project that is part of          in three parts. During the first period an extensive statistical
SESAR Workpackage E, which is addressing long-term and                analysis of real data will be performed in order to single out
innovative research. The project was started early 2011 so            a bundle of significant regularities and to identify a set of
this description is limited to an outline of the project objectives   methods to characterize geographical areas in terms of level
augmented by some early findings.                                     of complexity, safety and resilience.
   Abstract—The paper presents the preliminary results delivered         Some of these patterns will be clearly linked to operational
by the WPE project ELSA. After some introductory notes about          aspects (in the sense that the operational experts will be able
the project aims and structure, the paper shows how tools
borrowed by the Complex Network Theory can be used to study           to explain their causes and show how they are engendered),
the issue of delays in the air traffic system.                        while others will require further analyses to understand their
                                                                      dynamics and emergence. On the basis of the results obtained
                       I. I NTRODUCTION                               during this first phase an Agent Based Model will be proposed
   In the future of Air Traffic Management there is an increase       and developed hierarchically, i.e. introducing step-by-step in-
of traffic demand and new business challenges that will bring         creasing complexity and degree of realism in terms of number
the current ATM system to its capacity limits within the 2013-        of sectors, decision rules of controllers and sectors, layers of
2015. As a consequence an overall productivity improvement            planning, etc. These models will be calibrated and validated
is urgently needed and SESAR indicated business trajectories          with respect to both the empirical data analysis and the expert
as one of the key issues in this respect. Thus the structure          opinion of ATM stakeholders and operators. Once calibrated
of ATM as it is known today will drastically change and               to the current scenario, the Agent Based Model will be used to
these changes will be hardly understood by relying on the             simulate a SESAR scenario (trajectory-based). The third part
analysis of single elements, i.e. by applying the current state-      of the project will be devoted to the design and implementation
of-the-art validation approaches. More likely the future ATM          of a decision support prototyped tool. The consortium will use
key features will be the results of a complex interaction of          the results of the project so far to draw the line for a prototype
the introduced changes and therefore should then be analysed          for the monitoring, prediction and intervention on the airspace.
with the methods and tools of the science of complex systems.         It should serve as proof for concept of an innovative control
The shift from a structured route network to a trajectory-based       system for complexity managers, the sub-regional and regional
scenario, where users will be able to fly their selected business-    network managers.
efficient and economically profitable 4D trajectory, will lead
also to the introduction of new quasi real-time monitoring                   II. N ETWORK T HEORY IN THE ATM DOMAIN
methods to identify emerging properties, like high density               The use of Network Theory in the context of Air Trans-
areas, or areas where disturbances get propagated or amplified.       portation System dates back at least to the works of Ref. [1],
Specific attention should be paid to boundary areas that will         [2], [3], [4], [5], [6]. These are nowadays classical references
be drawn by the interaction between aircraft trajectories and         in the complex systems research community.
the organizational changes brought by the introduction of the            More recently, the use of Network Theory to model the
Functional Airspace Blocks. The objectives of the project are         Air Transportation System starts to be of interest to several
to analyze the present ATM system and to use the results              scientists of different disciplines and covers topics such as
of this analysis to introduce an Agent Based Model of the             such as efficiency, safety, flexibility, etc. of the air traffic
new business-trajetory SESAR scenario. The project is divided         system, see for example [7], [8], [9], [10], [11], [12] and

                                                               First SESAR Innovation Days, 29th November - 1st December 2011
2
references therein. In Ref. [7] the authors used a weighted In the preliminary investigation presented in this paper we
degree distribution for light jet operations to understand the use only part of the provided information. Specifically, we
capability of airports to attract the use of Very Light Jets decide to not use the information about segments and to
(VLJs). In Ref. [8] network theory tools were used to explore investigate the issue of delays between the last filled flight
how they can assist in the understanding, monitoring and plan and the effective flight at the level of a single flight [14].
management of the performance of ATM systems with respect For each flight we consider as a proxy of the flight delay
to safety issues (STCA signals). In Ref. [9], [10] the regional the difference between the arrival time reported in the m3
network of Lufthansa flights has been considered in order to file and the arrival time reported in the m1 file. It is worth
investigate whether the strategies of that airline and its partners mentioning that the exp2 file contains a column called “ATFM
can be revealed by a network theory analysis. The objective DELAY” standing for Numeric Air Traffic Flow Management
of the work reported in Ref. [11] is to determine if network Delay. This is the difference between the take off time (CTOT)
theory parameters can be utilized to identify unconnected city calculated by Civil Aviation Safety Authority (CASA) and
pairs that are most likely to connect in the future. In Ref. [12] the estimated take off time (ETOT). In a future extension of
the connectivity of the airport networks in China, Europe and this work, we plan to compare the result obtained by using
US is investigated in the aim of understanding which network the above defined proxy of delay, with the one obtained by
is most beneficial to final passengers in terms of travel time considering the “ATFM DELAY”.
and which of the network features lead to such a result.
The papers mentioned above give just examples of how IV. A IR TRAFFIC NETWORKS : DEFINITION
disparate are the topics where Network Theory tools can be We apply methods of complex network theory to ATM. It is
successfully applied. In the present paper we start to investi- possible to define many different types of networks of the air
gate the issue of air transportation system with an emphasis traffic, depending on the research question one is interested
on flights delay. Specifically we will present a preliminary in. Since one of our objectives is to study the dynamics of
analysis aiming at understanding how the airport network delay in the European airspace, we will consider the airport
topology is related to the statistical properties of flights delay network. As we will see below, it is possible to define at least
and how network topology affects the propagation of flight two types of airport networks.
delays from an airport to another. The first type of networks considers the airports as nodes.
Two airports are connected by a link when at least one flight
III. DATABASE DESCRIPTION is present between the two airports. The number of flights in
The data used in the present investigation are provided by a given time interval between two airports gives the weight of
Eurocontrol Central Flow Management Unit (CFMU) under the link (see also section V) between the corresponding nodes.
special confidentiality bounds. The provided data are the More precisely, if in the considered time period there are nAB
SegOut6 (so6) and the EXPand/Traffic demand file (exp2) files flights which go from airport A to airport B and nBA flights
[13]. The period of investigation is the week June 1-7, 2011. which go from airport B to airport A, we consider that nodes
The so6 files give a 4D description of trajectories. This A and B in the network are connected by two links, one from
is the basic file format used for queries, airspace load and A to B with weight nAB and one from B to A with weight
other key SAAM (System for traffic Assignment & Analysis at nBA . This airport network, termed flight network, is therefore
Macroscopic level) functions. It stores SAAM 4D trajectories weighted and directed.
and limited flight information. These data contain points The empirical analysis of the real airport network shows
information about latitude, longitude, flight level, date and that one can, in first approximation, consider a simpler version
time of all segments of each flight recorded by the ATM units of the network. In fact, when one considers a time interval
of the EUROCONTROL (ECTL) countries. of a day (or longer), one observes that for most links it is
We processed two types of so6 files: files containing data nAB ≃ nBA , i.e. two airports are typically connected by the
relative to the last filled flight plan (m1) and files containing same number of flights in both directions. In order to test this
data relative to updating of the the last filled flight plan with approximation, we consider a specific day, namely June 1,
radar data (m3). The estimates derived from received flight 2011 (but similar results hold also for other days). For each
plans are thus updated during the flight execution with radar pair of airports A and B, which are connected by at least one
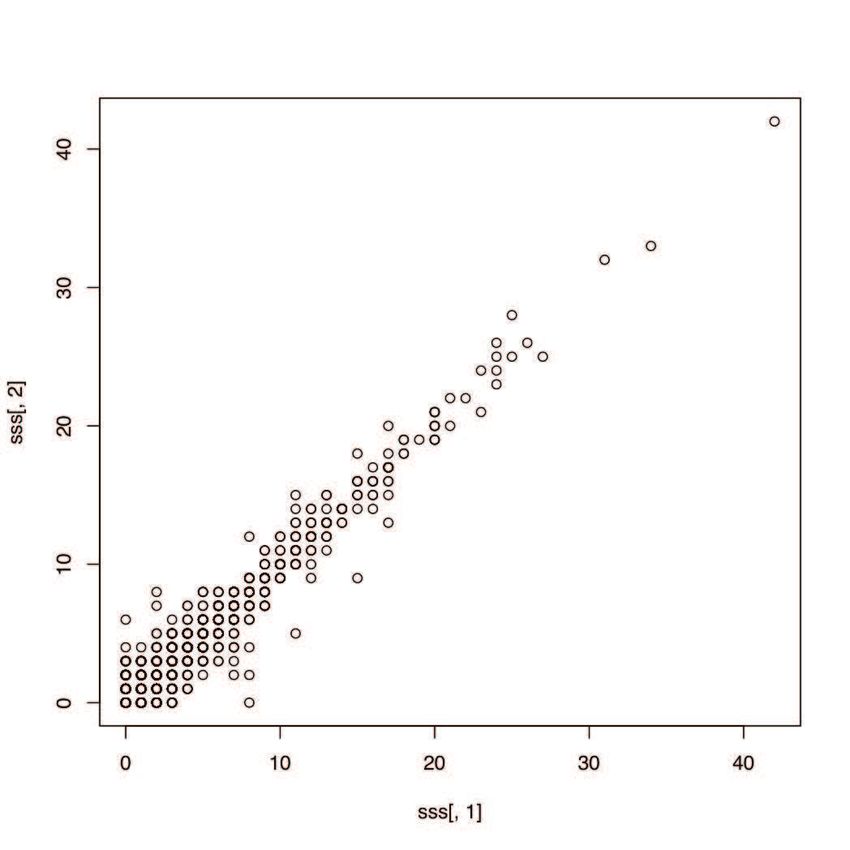
tracks forwarded to the CFMU by the different ATC centres. flight, we count nAB and nBA . In the left panel of Fig. 1
Many factors can contribute to deviations between planned we show nAB versus nBA . Apart from some scattering due
and executed trajectories. to small values of the number of flights observed close to
The exp2 files store flights information, but no trajectories. the origin of the figure panel, we generically observe that the
They are used for SAAM as a traffic demand for the assign- points lie quite close to the line nAB = nBA , as assumed
ment. Examples of flight information stored are the callsign above. Note that the same type of symmetry is observed if
and the type of flight, e.g. whether it was a General Aviation one plots the total number of flights departing from one airport
flight (G), a Military flight (M), a Non scheduled flight (N) or versus the total number of flights landing in the same airport
a Scheduled flight (S). From the callsign it is possible to get (see right panel of Fig. 1). Due to this approximate symmetry,
information about the airline that operated the flight. in the following of this paper we will consider an undirected
First SESAR Innovation Days, 29th November - 1st December 20113
network where nodes are airports and links are weighted with
the total number wAB ≡ nAB + nBA of flights connecting the
two airports. We call this undirected and weighted network
route network.
Given this distinction between the two networks, it is also
important to consider a partition of the nodes and of the links
of both networks due to the specific structure of our database.
The database is provided by ECTL and includes flights that
take off or land in an ECTL country or flights between two
non-ECTL countries but that use the airspace of one or more
ECTL countries. Therefore we consider two types of nodes,
namely those associated to an airport in an ECTL country and
those outside. In the investigated week the fraction of airports
in an ECTL country ranges between 67% and 72%.
Similarly, we classify three types of flights. The majority
of flights (between 74% to 80%) are between ECTL airports.
A small fraction of flights, ranging between 2.2% and 2.7%
is between two non ECTL airports. The remaining fraction
of flights is between an ECTL airport and a non ECTL one,
approximately equally split between incoming and outgoing
flights.
800
These numbers are a bit different if we consider the route
network. In this case the fraction of routes between two ECTL
airports ranges between 69% and 73%, while the fraction of
routes in the database between two non ECTL airports ranges
600
between 2.4% and 2.8%.
degree(gg, mode = "out")
V. N ETWORK METRICS : A REVIEW
400
As mentioned above we will consider airport networks, i.e.
graphs where the nodes (vertices) are the airports and there
exists a link between two airports if there is at least a flight
200
that connects them. The links may (flight network) or may not
(route network) be directed. They will always be weighted,
according to the number of flights between the two airports.
Several metrics can be considered in order to characterize
0
a network. We will hereafter introduce some of them: 0 200 400 600 800
• Degree - The degree of each node in a network is given by degree(gg, mode = "in")
the number k of links of the node. In the case of directed
networks one can estimate the degree kin (estimating the
number of links incoming to the node) and the degree Fig. 1. Upper Panel. Number of flights from A to B vs. number of flights
from B to A for each pair (A, B) of connected airports. Lower Panel. Number
kout (estimating the number of links out-coming from of outgoing vs number of incoming flights for each airport.
the node). For the route network, the degree of an airport
is the number of other airports that can be reached
from it in a day, i.e. the number of destinations. The
vertex degree distribution P (k) is one of the key tools • Weight - As mentioned above, each link can be assigned
we may use to characterize the network configuration a number quantifying the level of connection between the
[10], since this function determines the way nodes are two connected nodes. This is the weight of the link. In
connected. Specifically, a crucial role is played by the our case, as mentioned above the weight is given by the
way the distribution decays for large degree values. For number of flights existing between the two airports in the
example, when the distribution decays like a power-law given period of time. Similarly to the previous case, the
P (k) ∝ k −α , it means that the probability of finding link weight distribution W (k) is one of the key tools we
airports with a very large number of flight connections is may use to point out the network topology.
much higher than what expected in the case of a binomial • Strength - The node strength is simply the sum of
distribution of degrees, usually associated to a random the weights associated to the links that originate from
graph [15]. Such networks are sometimes termed scale (terminate in) it. In our case, the strenght of a node gives
free networks. the total number of flights departing from (arriving to) an
First SESAR Innovation Days, 29th November - 1st December 20114
airport. In the case of the route network, the strenght is Table I shows some summary statistics of the networks
given by nAB + nBA . when one includes all the nodes (airports). We consider one
• Average Path Length - Let us call ℓij the shortest distance network per day in order to estimate the statistical fluctuations
between vertex i and vertex j. This is defined as the in time. The table shows for each day the number of nodes
minimum number of links that connects any two nodes (airports), the number of flights, and the number of links in
i and j in the considered network. The Average Path the route network. This last number is clearly the number
Length hℓi is then defined as: of routes, where route from A to B and route from B to
1 X A are counted only once. The next metric is the average
hℓi = ℓij (1) strength, < s >, in the route network. This corresponds to
N (N − 1) i,j
the average number of flights (incoming and outgoing) for
where N is the number of nodes in the network. In an airport in the network. The table shows that on average
our case hℓij i measures how many flights are needed in there are 45 flights taking off or landing in an airport per day.
average to reach airport j starting from airport i. The The system is however very heterogeneous. In fact Table I
Average Path Length hℓi is therefore a measure of how shows that the maximal value of the strenght, max(s), is more
well connected the airports are. than one thousand. In order to have a full characterization of
• Diameter - The Diameter of a network is defined as the the distribution of strength (flights) per airport, we show the
maximal value of ℓij : cumulative probability of the strength s for one day in the left
panel of figure 2. The distribution is quite fat tailed and not
D = maxi,j ℓij (2) compatible with an exponential tail.
In our case the diameter of the network gives the maximal A different way of characterizing the topological properties
number of flights needed to reach any two aiports in the of the network is by considering the degree kA of a node
network. (airport) A, i.e. the number of airports connected with a direct
• Betweenness - The node betweeness Bk gives a measure flight with A (in the considered day). Table I shows the average
of the relative importance of a node in a network. It is degree < k >. Table shows that on average an airport of
defined as: the database is connected with approximately 12 destinations.
X lij (k) Again the system is very heterogeneous. In fact the maximum
Bk = (3) degree, max(k), is more than 200. In the right panel of figure
ℓij
ij6=k 2 we show the cumulative probability of the degree k for one
where the sum is extended over nodes i and j that are day. Also in this case we observe a large heterogeneity, but in
both different from node k. Here lij (k) is the minimum this case the tail of the distribution is well fit by an exponential
number of links that connects any two nodes i and j function.
and passing through vertex k. In our case lij (k) is the We consider the relation between the degree (number of
minimum number of flights through airport k needed to destinations) and the strength (number of flights) of an airport.
reach airport j starting from airport i. This a measure of In figure 3 we show the relation between the two variables in
how central is airport k in the network. High values of Bk a log-log scale. In the region of degree k > 20 we fit a power
indicate that such airport is reached by many travellers law relation s = C k β . The best fit gives the value β = 1.39
moving from one airport to another and thus probably it indicating a superlinear relation between number of flights and
behaves like an hub. number of destinations. This means that if an airport doubles
• Clusters - Clusters in a network are sets of nodes that are the number of destinations, it typically increases the number
only connected within themselves and are not connected of flights by a factor 21.39 ≃ 2.45.
with any other node outside the cluster. In our case, The considered networks are not completely connected. In
if airports A, B, and C belong to the same cluster, it fact, direct inspection reveals that the system is partitioned
means that there exists no flight that connects one of in several clusters of airports. However, as Table I shows,
them starting from any other airport D in the network. the largest cluster covers more than 97% of the airports. The
The existence of clusters of airports would indicate that remaining clusters are made of very few airports. Therefore
there are regions that can not be reached from outside. A the network has a giant component essentially covering the
network where all vertices belong to the same cluster is entire system.
referred to as a connected network. Finally, we consider the average path length connecting two
airports. The path length ℓAB is the minimum number of
VI. S TATISTICAL CHARACTERIZATION OF AIR TRAFFIC flights needed to reach airport B from airport A. The average
NETWORKS path length < ℓ > is the mean value of ℓ across all airport
In this section we present some statistical characterization pairs. By taking into account the directionality of flights (i.e.
of the flight network and of the route network. As we have by considering the flight network) we find that the average path
discussed above we can consider different networks depending length < ℓ >s is a little bit larger than 3 (see Table I). This
on whether we want to include only ECTL airports or all the is intuitive since typically one reaches an hub from a local
airports in the database. airport, then uses a flight connecting two hubs, and finally
First SESAR Innovation Days, 29th November - 1st December 20115
0
10
strength (number of flights)
3
all airports 10
cumulative probability
ECTL airports
-1
10
2
10
-2
10
1
-3 10
10
-4 0
10 1 2 3 10 0 1 2
10 10 10 10 10 10
strength (number of flights) degree (number of destinations)
0 Fig. 3. All airports. The dashed line is a best fit with a power law in
10 the region of degree larger than 20. The estimated exponent is 1.39. Similar
all airports
results are observed for ECTL airports only.
cumulative probability
ECTL airports
-1
10
0
-2 10
10
all links
cumulative probability
-1
10
-3
10
-2
10
-4
10 0 50 100 150 200 250 -3
degree (number of destinations) 10
-4
10
Fig. 2. Upper Panel: Cumulative density function of strength s (left,
in log-log scale) for the whole set and for only ECTL airports. Lower 10 0
-5
20 40 60 80 100
Panel:Cumulative density function of degree k (right, in semi log scale) for
the whole set and for only ECTL airports.
link weight (number of flights)
Fig. 4. Cumulative density function of link weight w, i.e. number of flights
per route. The plot is in semi log scale.
reaches the final destination. By neglecting the directionality
of links, i.e. by using the route network, one obtains the VII. P RELIMINARY ANALYSIS OF DELAYS
average path length < ℓ >k shown in Table I. This is by
definition smaller than < ℓ >s . However the table shows that We define delays as the difference of landing time in m3
these numbers are not dramatically different. The reason is file and landing time in m1 file. We recall that m1 files have
that, as discussed above, the vast majority of airport pairs are information about the last filled flight plan whereas m3 files
connected in both directions in a typical day, therefore the have information about updates of the last filled flight plan
directionality of links does not change significantly the path obtained from radar data.
length. The fraction of flights with more than 15 minutes of delay
ranges between 15% and 28%. These numbers are consistent
We also consider the properties of links. We have seen that with the fraction reported in the PRR report 2010 (25%). The
in the route network a link is characterized by its weight, i.e. fraction of flights with more than one hour of delay ranges
the number of flights in the route (in one day). The mean between 0.34% and 2.6%.
value of the weight is < w >= 3.70, i.e. a route has typically Figure 5 shows the probability density function of delays
3.7 flights per day. Note however that the standard deviation in semi log scale for each day of the first week of June 2011.
is 5.1. and the maximum is max(w) = 95, indicating again The central part is roughly described by a Laplace distribution
a large heterogeneity. In figure 4 we plot in semi log scale (asymmetric). Note also that there is a relatively large fraction
the cumulative distribution of link weight. The tail of the of flights with a negative delay.
distribution is well approximated by an exponential function. Finally, we consider whether some simple topological prop-
First SESAR Innovation Days, 29th November - 1st December 20116
day nodes flights links max(s) max(k) largest cluster < ℓ >s < ℓ >k
W June 1 1375 31224 8498 45.4 12.4 1452 221 1356 3.34 3.29
Th June 2 1296 27660 7757 42.6 12.0 1426 226 1264 3.33 3.27
F June 3 1291 28280 8039 43.8 12.5 1384 219 1256 3.31 3.23
Sa June 4 1153 25289 7642 43.8 13.3 1343 245 1126 3.17 3.15
Su June 5 1188 28175 8104 47.4 13.6 1451 232 1167 3.14 3.12
M June 6 1342 30435 8243 45.3 12.3 1494 221 1327 3.35 3.29
T June 7 1348 30397 8131 45.1 12.1 1494 220 1313 3.34 3.28
TABLE I
F ULL NETWORK . ℓ IS THE PATH LENGTH . F OR A DETAILED EXPLANATION , SEE TEXT.
-3
10 0.4
June 1
fraction of delayed flights
June 2
June 3 0.35
-4 June 4
prob. dens. func.
10 June 5
June 6
June 7
0.3
-5
10
0.25
-6 0.2
10
0.15
-7
10 -4 -3 -2 -1 0 1 2 3 4 0 500 1000 1500
delay (hours) node strength (number of flights)
Fig. 5. Probability density function of delays in the first week of June 2011. Fig. 6. Fraction of delayed flights (more than 15 minutes) as a function of
The y-axis is in log scale. the node strength (number of flights in a day) for the whole week June 1-7,
2011. Data are binned on the x axis. Error bars are standard errors.
erties of the airport network is related to flight delay. As a
preliminary result, in Figure 6 we show the relation between will study how the delays in these subsets differ from the
the fraction of delayed flights (with a threshold of 15 minutes) original network. A particular attention will be paid to the
and the strength of the node, i.e. the number of flights arriving network properties of hub airports and the relative fraction of
or departing in an airport in a given day. To have an higher delayed flights. We plan to analyse whether secondary airports
statistic we pool together all days in the week June 1-7, 2011. directly linked with an hub are able to absorb the delays
We observe that airports corresponding to nodes with large generated by an hub during the rush hours or if the delays are
strength tend to have an higher fraction of delayed flights. propagated to the secondary airports. This point is especially
A linear regression between the two variables restricting to relevant for the transition to the target SESAR scenario, as
airports with more than 300 flights in a day gives a noisy capacity gains are expected to come from a greater use of
but statistically significant relation (R2 ≃ 0.1). This result uncongested secondary airports [16].
indicates that airports with a higher traffic tend to have a larger Finally, we are planning to study traffic delays at the level of
fraction of delayed flights. flight segments in order to characterize delays in terms of the
segment typology. For example, we might investigate what are
VIII. P ERSPECTIVE WORK the stylized facts of delays in segments close to airport areas
The results presented in this paper are relative to a pre- or in segments that are far away from airports and nevertheless
liminary analysis of the flight and route networks. Further experience high traffic volumes
analyses performed in the future activity of the ELSA project
will include a complete study of the flight delays as a function ACKNOWLEDGMENT
of the above mentioned network metrics. For example it is
expected to be of particular interest the way the fraction of This work is co-financed by EUROCONTROL on behalf of
delayed flights depends on the network average path lengths. the SESAR Joint Undertaking in the context of SESAR Work
Furthermore, we plan to study how characteristics of flight and Package E.
route networks subsets affect the whole system. More precisely The authors would like to thank Massimiliano Zanin, Marc
we will consider regional and airline sub-networks, as well as Bourgois and Thierry Champougny for stimulating discussions
temporal layers of the networks (e.g. peak and off-peak) and and helpful suggestions.
First SESAR Innovation Days, 29th November - 1st December 20117
R EFERENCES
[1] G. Bagler, Analysis of the Airport Network of India as a complex
weighted network. Physica A 387, 2972-2980, (2004)
[2] W. Li, X. Cai, Statistical analysis of the airport network of China.
Physical Review E 369, 16. 046106, (2004)
[3] R. Guimerà and L.A.N. Amaral Modeling the world-wide airport
network Eur. Phys. J. B 38, 381-385 (2004)
[4] R. Guimerà, S. Mossa, A. Turtschi and L.A.N. Amaral The worldwide
air transportation network: Anomalous centrality, community structure,
and cities global roles PNAS 102, 7794 7799 (2005)
[5] V. Colizza, A. Barrat, M. Bartheĺemy, and A. Vespignani The role of
the airline transportation network in the prediction and predictability of
global epidemics PNAS 103, 20152020 (2006)
[6] V. Colizza, A. Barrat, M. Bartheĺemy, and A. Vespignani Optimal paths
in complex networks with correlated weights: The worldwide airport
network PRE 74, 056104 (2006)
[7] F. Bonnefoy, R.J. Hansman, Potential Impacts of Very Light Jets on the
National Airspace System JOURNAL OF AIRCRAFT, 44, 1318-1326,
(2007)
[8] F. Lillo , S. Pozzi, A. Tedeschi, G. Ferrara, G. Matrella, F. Lieutaud,
et al. Coupling and Complexity of Interaction of STCA Networks. Paper
presented at the EUROCONTROL 8th Innovative Research Workshop
& Exhibition, (2009).
[9] A. Reggiani, S. Signoretti, P. Nijkamp, A. Cento, Network Measures in
Civil Air Transport: A Case Study of Lufthansa in. Networks, Topology
and Dynamics, Lecture Notes in Economics and Mathematical Systems.
Springer Berlin Heidelberg, (2009).
[10] A. Reggiani, P. Nijkamp, A. Cento, Connectivity and Concentration
in Airline Networks: A Complexity Analysis of Lufthansa’s Network
European Journal of Information Systems (2010) 19, 449-461.
[11] T. Kotegawa, D.A. DeLaurentis, A. Sengstacken, Development of net-
work restructuring models for improved air trafc forecasts Transporta-
tion Research Part C 18 (2010) 937-949
[12] S. Paleari, R. Redondi, P. Malighetti, A comparative study of airport
connectivity in China, Europe and US: Which network provides the best
service to passengers? Transportation Research Part E 46 (2010) 198-
210
[13] EUROCONTROL DDR Reference Manual 1.5.8 DDR Version: 1.5.8,
04/05/2010, (Restricted audience)
[14] EUROCONTROL Central Office for Delay Analysis (CODA) A Matter
of Time: Air Trafc Delay in Europe EUROCONTROL Trends in Air
Trafc, vol. 2, ISSN 1993-1425
[15] R. Albert, A.-L. Barabasi, Statistical mechanics of complex networks
Reviews of Modern Physics 74, 4797, (2002)
[16] SESAR, Definition of the future ATM Target Concept - D3, (2007).
First SESAR Innovation Days, 29th November - 1st December 2011You can also read