MULTI-MODAL TRAFFIC DYNAMICS OF CHRISTCHURCH CBD - UC ...
←
→
Page content transcription
If your browser does not render page correctly, please read the page content below
Multi-modal Traffic Dynamics of Christchurch CBD Lee, H.S., Oh, K., Keyvan-Ekbatani, M., Ngoduy, D., Johari, M. Page 0

 MULTI-MODAL TRAFFIC DYNAMICS OF CHRISTCHURCH CBD

Hee Seung Lee
Main Author
3rd pro Civil Engineering in completion of BE(Hons), BAS, PgDARCH
Department of Civil and Natural Resources Engineering, University of Canterbury, Christchurch
Email: hsl58@uclive.ac.nz
Kyungrok Oh, Presenter
Main Author
3rd pro Civil Engineering in completion of BE(Hons)
Department of Civil and Natural Resources Engineering, University of Canterbury, Christchurch
Email: kro65@uclive.ac.nz
Dr. Mehdi Keyvan-Ekbatani, Lecturer in Transport Engineering
Main Supervisor
PhD, MSc, BSc
Department of Civil and Natural Resources Engineering, University of Canterbury, Christchurch
Email: Mehdi.ekbatani@canterbury.ac.nz
Dr. Dong Ngoduy, Associate Professor in Transport Engineering
Co-supervisor
PhD
Department of Civil and Natural Resources Engineering, University of Canterbury, Christchurch
Email: Dong.ngoduy@canterbury.ac.nz
Mansour Johari
Associate Supervisor
PhD Student
Department of Civil and Natural Resources Engineering, University of Canterbury, Christchurch
Email: Mansour.johariforoushani@pg.canterbury.ac.nz

ABSTRACT
The urban traffic networks of cities are complex with many transport modes that share and compete
for limited road space in the urban landscape. As part of An Accessible City (ACC) framework of
Christchurch that was established in 2013, the Manchester Street upgrade project has been recently
completed to improve accessibility in and around Christchurch CBD across a range of transport
modes. New road layout and space allocation have been introduced in the network including a Bus
Priority System (BPS) along the route. In collaboration with Christchurch City Council (CCC),
Christchurch Transport Operations Centre (CTOC), and Environment Canterbury (ECAN), this
research paper studies the performance of the network and multi-modal traffic dynamics of
Christchurch Central Business District (CBD) using Aimsun, a microscopic traffic simulation program.
The urban network of Christchurch CBD was modelled in Aimsun using the latest GIS map from
Environment Canterbury. The traffic demand of the CBD during the peak morning period (7-9 AM)
was generated using the latest Origin-Destination (O-D) matrix from the 2018 Christchurch
Assignment and Simulation Traffic (CAST) model in SATURN program. 119 signalised intersections
in the CBD were implemented in the Aimsun model using fixed signal phases that are based on the
Sydney Coordinated Adaptive Traffic System (SCATS) of Christchurch. All existing bus routes and
bus stops within the CBD have been implemented into the Aimsun simulation with the latest bus
information from Metro bus company. Two simulation scenarios were explored in Aimsun to
investigate the effects of BPS in the CBD network. The results show that the effects of BPS in the
performance of the multi-modal traffic dynamics of Christchurch CBD are minimal. However, it is
noted that the results are of the entire CBD network and the effects of BPS should be further
investigated at the local scale to validate the results.

Transportation 2020 Conference, 10 – 13 March, Christchurch Town Hall
Multi-modal Traffic Dynamics of Christchurch CBD Lee, H.S., Oh, K., Keyvan-Ekbatani, M., Ngoduy, D., Johari, M. Page 1

INTRODUCTION
Throughout urban history, transportation has played a crucial role in the development of the city as
well as human civilization. However, it is only in the last century that the rapid proliferation of the
automobile has given rise to a global phenomenon of traffic congestion. Traffic congestion is
undoubtedly caused by traffic volume exceeding the network capacity (Parpageorgiou et al., 2003).
As more vehicles are put on the streets, traffic congestion would continue to grow. According to
Parpageorgiou et al. (2003), traffic congestion can result in excess delays, reduced safety and an
increase in environmental pollution. Traffic congestion can be alleviated either by increasing the
network capacity or by reducing the traffic demand in the system. This can be achieved through
traffic control plans and traffic management strategies. Traffic congestion is particularly apparent in
recent decades as many transport modes share and compete for limited road space in the urban
landscape. With a global impetus in creating sustainable and liveable cities, through pedestrian-
friendly and transit-oriented policies, the notion of a multi-modal transport network and the issue of
equity in transportation would only continue to grow. Several studies have been carried out to
investigate the connection between the performance of transport systems and general land
allocation. However, space allocation for interacting modes of transport as well as its impact on the
equity in transportation is an open research question.

CHRISTCHURCH CBD

Not surprisingly, traffic congestion is a growing concern in Christchurch, the second-largest city in
New Zealand with an estimated population of 388,500 in 2018. As the car capital of New Zealand,
84 percent of the Greater Christchurch population drove to work on census day in 2013 compared
to only 3.7 percent using the bus to get to work (Statistics New Zealand, 2015). According to an
analysis conducted by the Christchurch Transport Operations Centre (CTOC) in 2018, the cost of
traffic congestion in Christchurch amounts to about $440 million per year (Harris, 2018). This number
is expected to increase with the growing population in Christchurch. Therefore, careful traffic control
plans and management strategies need to be considered to mitigate the adverse effects of
congestion in Christchurch.

As part of a city-wide strategy to re-establish Christchurch CBD as the primary activity centre for the
greater Christchurch region and in the process to improve traffic congestion in the city, An Accessible
City (AAC) framework has been prepared under the Christchurch Central Recovery Plan in 2013.
The aim of ACC is to create a people-friendly city centre in Christchurch with an emphasis on
accessibility for all people through a variety of different travel modes including walking, cycling, using
public transportation, and driving (Canterbury Earthquake Recovery Authority, 2013). The recently
completed Manchester Street upgrade project in 2018 is one of the flagship projects of AAC. It
features a new road layout and space allocations from Kilmore Street to Lichfield Street. Most
importantly, Manchester Street is designated as a public transport corridor with a Bus Priority System
(BPS) along its route. There are currently five locations, including Manchester Street, where BPS
has been implemented in the CBD of Christchurch. Figure 1 shows the locations of the BPS that are
installed in the CBD area. The BPS in Christchurch consists of bus priority signals and bus priority
lanes. In this report, BPS will be used inclusively to describe both systems. Within BPS, bus priority
signals can be further divided into two types of detection-actuation processes. Most commonly, the
bus priority signals are executed using the internal loop detectors that are installed on the roads to
detect oncoming buses passing through the installation. Less frequently, Radio Frequency
Identification (RFID) is used to identify oncoming buses and to call the bus priority phase at the
associated intersection. No RFID system is currently operational in the CBD area and therefore, it
has been excluded in the study.

PROJECT OBJECTIVES

There are two primary objectives of this research paper. First, this paper investigates the use of
Aimsun, a microscopic traffic simulation program, to model and simulate real-life traffic conditions of
Christchurch CBD bounded by the four avenues. This is completed using real traffic data obtained

Transportation 2020 Conference, 10 – 13 March, Christchurch Town Hall
Multi-modal Traffic Dynamics of Christchurch CBD Lee, H.S., Oh, K., Keyvan-Ekbatani, M., Ngoduy, D., Johari, M. Page 2

 Figure 1. Location of BPS in Christchurch CBD.

from various organisations in the public sector of Christchurch. Secondly, this paper investigates the
effects of BPS, consisting of bus priority signals and bus dedicated lanes, in the multi-modal traffic
dynamics of Christchurch CBD. The definition of ‘multi-modal traffic dynamics’ in this paper focuses
exclusively on the relationship between cars and buses. Other transport modes have been excluded
in the study due to various modelling limitations that are discussed further in the paper. Two
simulation scenarios in Aimsun will be used to compare and explore the dynamic properties of BPS
at the network scale.

LITERATURE REVIEW
According to Papageorgiou et al. (2003), traffic control strategies can be divided into two main
approaches: isolated or coordinated strategies. These strategies are categorized based on the
applicable scale of the network. Isolated strategies consider only one intersection under
undersaturated conditions, while coordinated strategies consider an urban zone with multiple
intersections. Under coordinated strategies, there are fixed time coordinated control, coordinated
traffic responsive strategies, model-based optimization methods, store and forward based
approaches, and integrated urban freeway traffic control. Notable time coordinated control strategies
are MAXBAND and TRANSYST systems. MAXBAND is a traffic control strategy that tries to
maximize the green wave duration to have more vehicles passing in the green time. TRANSYST is
another fixed time strategy which iteratively finds the optimum signal timing based on historical data.
However, these techniques have a significant drawback in real traffic conditions as they are heavily
dependent on historical data. As a result, the fixed time coordinated controls perform poorly in abrupt
changes to the traffic conditions and daily changing demands.

On the other hand, traffic responsive strategies, that are based on real traffic data, are more flexible
and resilient. Sydney Coordinated Adaptive Traffic System (SCATS) is a traffic responsive control

Transportation 2020 Conference, 10 – 13 March, Christchurch Town Hall
Multi-modal Traffic Dynamics of Christchurch CBD Lee, H.S., Oh, K., Keyvan-Ekbatani, M., Ngoduy, D., Johari, M. Page 3

strategy that is being used in over 27 countries worldwide including New Zealand and Christchurch.
SCATS is an urban traffic control system which optimizes the traffic signals to minimize user travel
time. SCATS follow a feedback algorithm which continuously modifies the signal phases and offsets
the data collected from detectors to achieve optimal traffic condition. Many studies have concluded
that SCATS is an effective tool in optimizing the traffic flow of the urban network and minimising user
travel time. (Chong-White and Shaw (2012); Martin and Stevanovic (2008); Slavin et al. (2013)).
However, it should be noted that SCATS, as a fully actuated system, depend heavily on the detectors
on the roads. In other words, the accuracy of the detector has a direct influence on the performance
of the system. Moreover, it is widely regarded that SCATS perform poorly in oversaturated flow
conditions (Keyvan-Ekbatani et al., 2019). According to Keyvan-Ekbatani et al. (2019), the
inefficiency of SCATS can be alleviated with a gating control mechanism.

The Fundamental Diagram (FD) gives the relationship between the traffic speed (km/hr), traffic flux
(veh/hr), and the traffic density (veh/km) of a road link. At free traffic flow, the FD, notably the
flux-density diagram, is characterised by a linear growth relationship between the flux and the
density, where the slope represents the free flow speed. Once critical density is reached, the link
also reaches its maximum capacity. Beyond the maximum capacity, a congest flow would occur in
the link and the relationship between the flux and density would decrease linearly until jam density
is achieved. The Macroscopic Fundamental Diagram (MFD) is the application of the FD on a network
scale. While the FD is a portrayal of the traffic performance of only one link, the MFD describes the
traffic conditions of an entire road system in the network. As a result, the MFD is characterised with
a range of associated critical densities in contrast to the FD with only one. MFD is also called the
Network Fundamental Diagram (NFD), and in this paper, NFD will be used. The NFD is useful in
analysing the traffic condition of the network. From the NFD, the average speed and the delay in the
network can be easily identified. However, there are many weaknesses in the NFD, especially in
freeway traffic conditions. Keyvan-Ekbatani et al. (2012) describe the limitations of NFD under
various traffic conditions. According to Keyvan-Ekbatani et al. (2012), NFD is stable when the traffic
condition is homogenous, however, it is difficult for the freeway to have such conditions due to
hysteresis phenomena that exist in the freeway system. This means that the NFD is not suitable in
the analysis of freeways. Another weakness of the NFD can be found in a multi-modal network
system in which it is unable to portray the relationship between different vehicle typology that exist
in the system such as buses and cars. Thus, upon further research by Geroliminis et al. (2014), a
new system was introduced by adding an extra dimension to the representation of 2D NFD to create
a 3D NFD, which shows the bimodal properties of the urban network. With the application of 3D
NFD, the dynamic relationship between cars and buses could be identified.

Aimsun simulates dynamics traffic simulation software which provides various modes of network
simulation including microscopic, mesoscopic and hybrid models. A distinct feature in Aimsun is its
ability to reproduce dynamic traffic conditions in the microscopic simulation environment. It also
provides extensive API tools to simulate diverse traffic conditions including BPS and SCATS. Aimsun
also uses traffic assignment to distributes the traffic demand set from an O-D matrix by mimicking
the user behaviours on path decisions. In Aimsun, stochastic route choices and dynamic user
equilibrium are used to evaluate a traffic network. In this paper, Aimsun is used as the primary traffic
simulation tool to model and evaluate the traffic dynamics of Christchurch CBD.

METHODOLOGY
DATA COLLECTION

Obtaining real traffic data is a critical step in simulating the real traffic conditions of an urban network.
As illustrated in Figure 2, real traffic data was obtained from various organisations in the public sector
of Christchurch. The 2018 Christchurch Assignment and Simulation Traffic (CAST) model was
obtained from Christchurch City Council (CCC) to generate the traffic demand in the CBD. Latest
GIS data and bus information was collected from Environment Canterbury (ECAN) and Metro bus.
All SCATS signal plans and information on the signalised intersection in the CBD area was obtained
from CTOC, a partnership of CCC, ECAN, and New Zealand Transport Agency (NZTA).

Transportation 2020 Conference, 10 – 13 March, Christchurch Town Hall
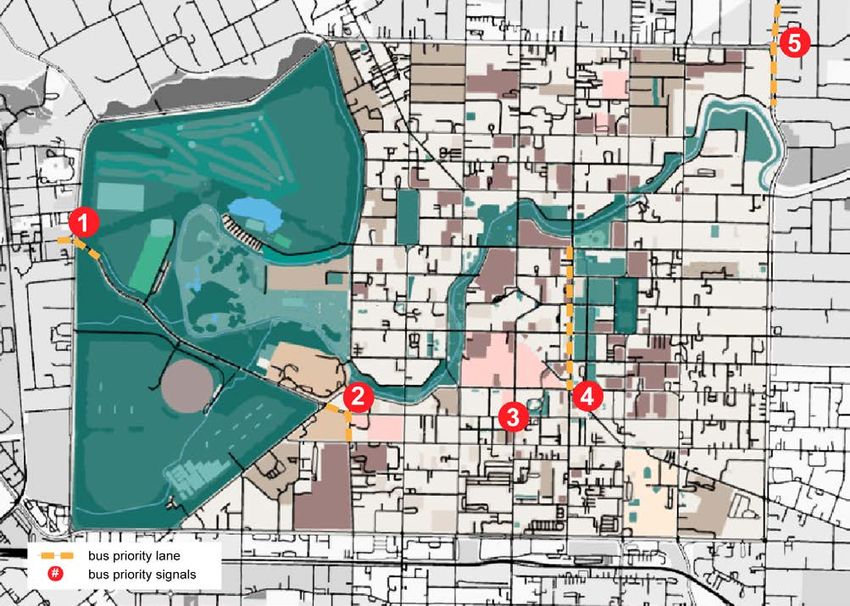
Multi-modal Traffic Dynamics of Christchurch CBD Lee, H.S., Oh, K., Keyvan-Ekbatani, M., Ngoduy, D., Johari, M. Page 4

 Figure 2. Diagram of research methodology.

NETWORK MODELLING

To achieve an accurate replication of the CBD urban network in Aimsun, the most up-to-date aerial
map (5 November 2018) of the CBD was used simultaneously with the latest imagery from Google
Street View. Otherwise, a site visit was conducted to validate the final road layout. Road speed limits
were also implemented in the Aimsun network using the speed limit map from CCC (2019). The
completed CBD network in Aimsun is depicted in Figure 4. The Origin-Destination (O-D) matrix of
the CBD has been imported in the Aimsun model from the 2018 CAST model. The CAST model is
a SATURN program based on the macroscopic simulation model of Christchurch which has been
developed and maintained by CCC since 2012. Figure 3 (a) shows the cordoned CAST model of the
CBD with the associated O-D zones. To this end, as shown in Figure 4, a total of 203 centroids have
been implemented in the Aimsun network to generate the traffic demand from the CAST model.

There is a total of 119 signalised intersections that were implemented in the Aimsun model using the
Controller Information Sheet (CIS) and SCATS History Viewer from CTOC. CIS consists of all
signalised control information of the intersection, including phase movements and the geometric
design of the road intersection. SCATS History Viewer can be used to find historical signal data of
all minimum, maximum, and average green time of the signal phases in all signalised intersection in
Christchurch. The signal plans that have been implemented in the Aimsun model are not coordinated
and are programmed in fixed signal phases using the average green time generated from SCATS
History Viewer. To represent a typical weekday setting of the traffic dynamics, as well as being
consistent with the aerial imagery, a simulation date of 5 November 2018 was selected to base all
the signal plans in the Aimsun network. It should be noted, that the effects of pedestrian and cyclist
movements, in the multi-modal traffic landscape of the CBD, have been largely excluded in this
paper. This is due to the limitations in the simulation process and the lack of reliable pedestrian and
cyclist traffic data in Christchurch.

Transportation 2020 Conference, 10 – 13 March, Christchurch Town Hall
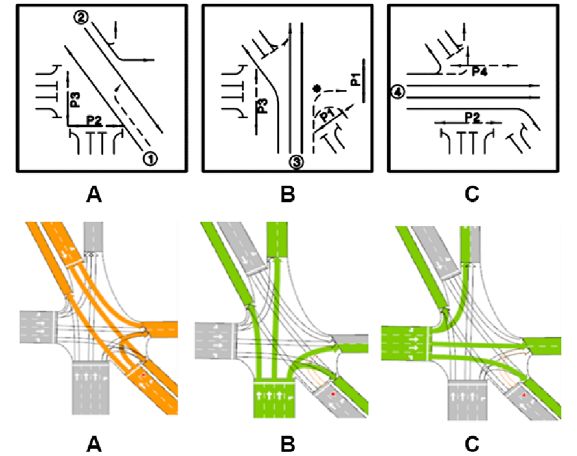
Multi-modal Traffic Dynamics of Christchurch CBD Lee, H.S., Oh, K., Keyvan-Ekbatani, M., Ngoduy, D., Johari, M. Page 5

 Figure 3. (a) Cordoned 2018 CAST model of CBD, (b) The bus network of CBD modelled in
 Aimsun; bus routes (thick grey lines) and bus stop (circles).

 Figure 4. The urban network of CBD in Aimsun.

An example of the modelling approach used to simulate a signalised intersection (Montreal /
Salisbury / Victoria Street) in Aimsun is illustrated in Figure 5. Figure 5 shows that the right turning
approach in phase A intersects with the forward approach. Therefore, the right turning movement is
assigned a give way rule as defined in the New Zealand road code. A stop line was created in the
middle of the intersection to allow turning vehicles to approach the intersection before they make the
turn as observed in real-life Christchurch traffic. Figure 6 shows the signal cycle time implemented
at Montreal / Salisbury / Victoria Street intersection with four seconds of yellow time as identified in
CIS.

The latest Metro bus map and timetable have been used to simulate bus stops and bus routes in
Aimsun. A total of 95 bus stops and 14 bus routes (north and south directions) were implemented in
the CBD model. Figure 3 (b) shows the completed bus network in Aimsun. Thick grey lines indicate
simulated bus routes and the circles show the location of all bus stops in Aimsun. Dwelling time of

Transportation 2020 Conference, 10 – 13 March, Christchurch Town Hall
Multi-modal Traffic Dynamics of Christchurch CBD Lee, H.S., Oh, K., Keyvan-Ekbatani, M., Ngoduy, D., Johari, M. Page 6

30 10 seconds have been used for all bus stops to simulate real bus dynamics during unloading
and loading of passengers. The BPS in Christchurch, as identified in Figure 1, was also implemented
in the Aimsun model. In the simulation, unlike other fixed signals, the priority signals were classified
as actuated signals. As a result, the associated signal phases are only requested upon the detection
of the buses that are equipped with the priority assignment.

 Figure 5. Comparison between signal phases in CIS (top) and modelled Aimsun signal phases
 (bottom).

 Figure 6. Fixed signal cycle time at Montreal / Salisbury / Victoria Street intersection.

SIMULATION SETTINGS

The traffic demand profile of the morning peak period (7:00 AM – 9:00 AM) was introduced in the
Aimsun model from the O-D matrix that was generated in the 2018 CAST model. Figure 7 shows the
traffic demand profile of the two-hour duration with a gradual increase towards the peak demand of
12,870 veh/hr from 8:00 AM onwards. A total traffic demand of 46,382 vehicles were simulated.
Detectors have been installed mid-way along each road section in the Aimsun model and measured
every 90 seconds to collect the simulated data. Dynamic traffic assignment was enabled in the
simulation with C-logit based route choice model updated every 90 seconds. Aimsun generates
stochastic simulation results, therefore, 15 replications (different random seeds) were carried out to
create the NFD of the CBD urban network. The replication seed numbers were used consistently for
both scenarios for homogeneous comparison.

 Figure 7. Demand profile (7:00 AM – 9:00 AM).

Transportation 2020 Conference, 10 – 13 March, Christchurch Town Hall
Multi-modal Traffic Dynamics of Christchurch CBD Lee, H.S., Oh, K., Keyvan-Ekbatani, M., Ngoduy, D., Johari, M. Page 7

The NFD was created using the weighted averages of the results. Thus, Aimsun API was used. The
main function of the API was to derive the average weighted density from the density generated from
the detectors in the Aimsun network. In the API, Equations 1 and 2, developed by Geroliminis et al.
(2008), were used to derive the average weighted values, where is the flow from each detector,
is the length of each road section with detectors, and is the density generated from each detector.
Equation 1 was used to derive the average weighted flow and Equation 2 was used for the average
weighted density.

SIMULATION SCENARIOS

Two simulations scenarios were considered in Aimsun to investigate the effects of BPS and multi-
modal traffic dynamics of the entire Christchurch CBD urban network. They are as follows:

 • Base (with BPS): The current urban network model of Christchurch CBD based on the latest
 GIS data and simulation settings described in the previous sections. It also includes the
 current BPS that are implemented in the CBD.
 • Without BPS: The current model based on the base model without BPS implementation in
 the entire CBD.

RESULTS
This section provides a summary of the findings of the simulations and provides an examination of
the results to discuss further in the paper.

 Figure 8. (a) 3D NFD – Base model, (b) 3D NFD – Without the BPS model.

BASE (WITH BPS)

Figure 8 (a) shows the 3D NFD of the base CBD model. The different colours represent the 15
replications that were undertaken for the simulation of each scenario. The 3D NFD shows that the
relationship between car density and vehicular flow follow an inverted curve shape that is a
characteristic of the FD. The critical car density occurred in the range between 40 veh/km and
50 veh/km while the network capacity is approximately 410 veh/hr.

Transportation 2020 Conference, 10 – 13 March, Christchurch Town Hall
Multi-modal Traffic Dynamics of Christchurch CBD Lee, H.S., Oh, K., Keyvan-Ekbatani, M., Ngoduy, D., Johari, M. Page 8

WITHOUT BPS

Figure 8 (b) shows the 3D NFD of the CBD network without BPS. Similar to Figure 8 (a), the
relationship between the car density and vehicular flow follows an inverted curve shape. The critical
car density occurred in the range between 40 veh/km and 50 veh/km while the network capacity is
approximately 430 veh/hr. The network capacity is slightly higher in the network without BPS
compared to the base model. However, the critical density is almost identical in the two scenarios.

COMPARISON OF RESULTS

Figure 9 shows the NFD contour plot of the average bus to car density with a colour map depicting
the vehicular flow for both scenarios. The contour plot represents the flow conditions influenced by
the movements of buses and cars. From the contour plot of the two networks, it can be deduced that
the network without BPS can sustain more vehicular flow with a higher bus density. When the car
density is at 10 veh/km, the base network can hold a bus density of 0.6 veh/km while the network
without BPS can hold up to a bus density of 0.9 veh/km. Moreover, this difference is outlined in the
red dashed line in Figure 9 (b). This indicates that the network without BPS is more sustainable in
its interaction between cars and buses and are able to serve more buses without the compromise of
high capacity.

 Figure 9. (a) NFD Contour plot – Base (with BPS), (b) NFD Contour plot – without BPS.

 Figure 10. (a) Box plot of average bus delay, (b) Box plot of average car delay (red line showing
 the median, top and bottom of each box are 75th and 25th percentiles of the samples).

Transportation 2020 Conference, 10 – 13 March, Christchurch Town Hall
Multi-modal Traffic Dynamics of Christchurch CBD Lee, H.S., Oh, K., Keyvan-Ekbatani, M., Ngoduy, D., Johari, M. Page 9

Figure 10 shows the box plot comparison of the two scenarios against the overall bus delay and car
delay of the network. The base model has a median average bus delay of 138.4 sec/km while the
model without BPS has 139.5 sec/km. The maximum bus delay in the base network is 149.4 sec/km,
which is higher than the maximum bus delay in the network without BPS of 145.5 sec/km. The
median car delay of the base model is 139.0 sec/km, which is slightly higher than the median of the
model without BPS of 138.8 sec/km. Again, the difference is not significant enough to compare the
performance of each network.

The discrepancy between the two scenarios is identified in Table 1. Similar to the box plot
comparison, no clear differences can be observed from the results. However, the Total Travel
Distance (TTD) of the car in the network without BPS was found as 85,852.7 km in contrast to the
base network of 84,092.1 km. This result suggests that the throughput of cars in the network without
BPS is higher by 1,760.6 km compared to the base network during the simulation period of two
hours. However, it is noted that this difference is only two percent of the overall TTD in the entire
network of the CBD, which compared to the number of cars in the system cannot be considered as
a significant difference.

 Base (with BPS) Without BPS
 Average Car Speed (km/hr) 20.4 20.4
 Average Bus Speed (km/hr) 12.4 12.2
 Total Travel Time of Car (hr) 4999.8 5035.8
 Total Travel Time of Bus (hr) 42.1 42.3
 Total Travel Distance of Car (km) 84092.1 85852.7
 Total Travel Distance of Bus (km) 481.8 483.0

 Table 1. Comparison of results (median).

DISCUSSION
FINDINGS

The results show that the effects of BPS in the simulated network of Christchurch CBD are minimal
and for some instances, the network performance was slightly better in the network without BPS
than the base model with BPS. However, it is difficult to find any overall difference in the results
between the two networks. This is contrary to the general assumption that BPS should improve the
performance of the bus network in the system. It should be noted, however, that the results are
somewhat expected at the network level where only five intersections have been implemented with
BPS among 119 signalised intersections in the entire CBD network. It should be also noted that the
results do not prove that BPS does not work in the multi-modal traffic network, but that the effects
may be localised in an area within the CBD and do not propagate to the network level. To this end,
it is worth considering the effect of BPS on a local scale and compared to the network level.

One interesting observation that can be identified in the simulation is the sensitivity of simulation
results related to buses. The number of buses during the simulation period is relatively small
compared to the number of cars in the network. Therefore, even the smallest change to the delay in
buses can produce contradicting results. On the other hand, due to the sheer number of cars in the
network, any minor changes to the car dynamics in the network will not cause an overall change at
the network scale.

LIMITATIONS IN SIMULATION

There are various limitations in the modelling and simulation of Christchurch CBD in Aimsun. First,
it must be highlighted that the simulated urban network in Aimsun is not a fully functioning
representation of the real traffic network of Christchurch CBD due to many limitations in the Aimsun
simulation environment. One of the critical limitations is the fixed signal plans that have been used

Transportation 2020 Conference, 10 – 13 March, Christchurch Town Hall
Multi-modal Traffic Dynamics of Christchurch CBD Lee, H.S., Oh, K., Keyvan-Ekbatani, M., Ngoduy, D., Johari, M. Page 10

in the simulation. This is vastly different from the coordinated traffic control of SCATS in real-life.

Secondly, Aimsun is a traffic simulation tool that is inherently based on the vehicle traffic model.
Therefore, the simulation of other modes of travel including the traffic dynamics of pedestrian flow is
still in its infancy. Vehicular movements are complex, but they can be simulated through many traffic
assignments such as the car-following model. On the other hand, pedestrian movements are difficult
to predict through a mathematic model due to the dynamic and disordered behaviours on the streets.
As a result, the traffic dynamics of pedestrians have been largely overlooked in the modelling
process except in small instances where a dedicated signal phase was employed at the signalised
intersection. It is however noted, that the central city is driven by multi-modal traffic dynamics,
especially the pedestrian flow. The pedestrian dynamics is fundamental in the simulation of the traffic
behaviour in the central city due to their priority over vehicles. As more cities adopt city policies
towards people-friendly cities, this notion will only continue to grow and its influence in the multi-
modal traffic dynamics in the central city would be deemed too important to be excluded in the
analysis.

Another important aspect to consider is the shared roads in the urban network of Christchurch CBD.
During the simulation, it was observed that a significant number of vehicles travelled through the
shared roads during the peak period. Initially, due to the low-speed limit (10km/hr), there was low
usage of the shared roads for travel. However, with a gradual increase in the traffic demand of the
network and as congestion started to form in the links, an increase in shared road usage was
observed. This is reasonable in the simulation environment as the simulated vehicles are
programmed to seek the shortest path based on a stochastic mechanism. However, in real-life, cars
are discouraged from using the shared pathway through various traffic control mechanism in the
shared road design. To simulate real conditions in Aimsun, the shared roadway should be less
attractive to path users.

Another limitation is related to the simulation of buses and their associated traffic behaviour in
Aimsun. First, the bus dwell time in the simulation was assumed as 30 ± 10 seconds. In real-life, the
dwell time will range between zero to a few minutes depending on the demand of the bus service.
Also, it was observed during the simulation that a significant bus delay was experienced at the bus
interchange exit on Lichfield Street. The localised bus delay was due to the simulated buses that
were unable to enter a congested road at the interchange exit with a large queue of cars on Lichfield
Street. This was especially observable when a give way assignment was set in Aimsun for the bus
movement out of the bus interchange based on real traffic assignment at the site. However, in real
life, the opposite would occur, and cars would give way to buses during congested road conditions.
This behaviour may be cultural-specific but in New Zealand, at least, a pseudo-rule exists among all
drivers to give way to vehicles struggling to enter the road during congested road conditions. In order
to simulate this behaviour, the give way rule was removed for the interchange bus exit movement in
Aimsun simulation. This shows the limitation of Aimsun to be flexible in simulating a cultural-specific
behaviour of vehicle dynamics in New Zealand.

CONCLUSION
This paper considers the multi-modal traffic dynamics of Christchurch CBD. The traffic network of
Christchurch CBD was modelled in the microscopic simulation environment of Aimsun using real
traffic data of Christchurch. Two simulated scenarios in Aimsun were used to investigate the effects
of the BPS in the urban network of Christchurch CBD. First, the base model, representing the current
urban network of the CBD, was simulated. Second, the CBD network without BPS was simulated for
comparison and analysis.

The results show that the effects of BPS in the simulated model of Christchurch CBD are negligible.
This is contrary to the general expectation that BPS should improve the performance of the bus
network. However, it is noted that the results are of the entire network level and the effects of BPS
may have been localised along critical bus routes with BPS implementations. To this end, further
study would be warranted to study the effects of BPS on the local scale. Furthermore, it should be

Transportation 2020 Conference, 10 – 13 March, Christchurch Town Hall
Multi-modal Traffic Dynamics of Christchurch CBD Lee, H.S., Oh, K., Keyvan-Ekbatani, M., Ngoduy, D., Johari, M. Page 11

noted that the base network model in Aimsun is not a fully functioning representation of the real
traffic dynamics of Christchurch CBD due to many limitations in the modelling and lack of calibration
used in the simulation. Therefore, further investigation is required to validate the findings in the report
for industry applications. To this end, it is recommended that additional research in the modelling of
Christchurch CBD in the microscopic simulation environment will benefit the understanding of multi-
modal traffic dynamics of Christchurch CBD, as well as contributing to the future transport planning
of Christchurch.

ACKNOWLEDGMENTS
This project was only made possible through the collaboration between the University of Canterbury
(UC), CTOC, CCC, and ECAN. A special acknowledgment to Chris Bealing from CTOC and Hamid
Mirbaha from CCC in assisting the authors in the various tasks involved in the project including data
collection and traffic software implementations.

AUTHOR CONTRIBUTION STATEMENT
Hee Seung Lee and Kyungrok Oh are the main authors and have carried out the research (e.g.
literature review, data collection, data analysis, modelling, simulation, results and discussion) under
the supervision of Dr. Keyvan-Ekbatani (e.g. leading the research, developing research ideas and
interpretation of results) along with co-supervisor Dr. Ngoduy (e.g. research discussion and
interpretation of results) and associate supervisor Mansour Johari (e.g. data analysis and network
modelling review).

REFERENCES
Canterbury Earthquake Recovery Authority, 2013. An Accessible City – Christchurch Central
Recovery Plan: Replacement transport chapter – October 2013, Christchurch, Canterbury
Earthquake Recovery Authority.

Chong-White, C., & Shaw, S., 2012. Indicative traffic control performance of the SCATS installation
in New South Wales including Sydney, paper presented at 19th ITS World Congress, Vienna,
Austria, 22 October 2012 through 26 October 2012, viewed 17 May 2019.

Christchurch City Council, 2019. Speed Limit Map, viewed 9 September 2019, .

Geroliminis, N. and Daganzo, C.F., 2008. Existence of urban-scale macroscopic fundamental
diagrams: Some experimental findings. Transportation Research Part B: Methodological, 42(9),
pp.759-770.

Geroliminis, N., Zheng, N. and Ampountolas, K., 2014. A three-dimensional macroscopic
fundamental diagram for mixed bi-modal urban networks. Transportation Research Part C: Emerging
Technologies, 42, pp.168-181.

Harris, D., 2018. Commuting in NZ’s car capital costs Christchurch drivers $10,000 a year, viewed
16 May 2019, .

Keyvan-Ekbatani, M., Kouvelas, A., Papamichail, I. and Papageorgiou, M., 2012. Exploiting the
fundamental diagram of urban networks for feedback-based gating. Transportation Research Part
B: Methodological, 46(10), pp.1393-1403.

Keyvan-Ekbatani, M., Gao, X., Gayah, V.V. and Knoop, V.L., 2019. Traffic-responsive signals

Transportation 2020 Conference, 10 – 13 March, Christchurch Town Hall
Multi-modal Traffic Dynamics of Christchurch CBD Lee, H.S., Oh, K., Keyvan-Ekbatani, M., Ngoduy, D., Johari, M. Page 12

combined with perimeter control: investigating the benefits. Transportmetrica B: Transport
Dynamics, 7(1), pp.1402-1425.

Martin, P.T. and Stevanovic, A., 2008. Adaptive Signal Control V-SCATS Evaluation in Park City,
Utah (No. MPC Report No. 08-200).

Papageorgiou, M., Diakaki, C., Dinopoulou, V., Kotsialos, A. and Wang, Y., 2003. Review of road
traffic control strategies. Proceedings of the IEEE, 91(12), pp.2043-2067.

Slavin, C., Feng, W., Figliozzi, M. and Koonce, P., 2013. Statistical study of the impact of adaptive
traffic signal control on traffic and transit performance. Transportation Research Record, 2356(1),
pp.117-126.

Statistics New Zealand, 2015. Commuting patterns in greater Christchurch: Trends from the Census
of Population and Dwellings 2006 and 2013, viewed 16 May 2019, .

Transportation 2020 Conference, 10 – 13 March, Christchurch Town Hall
You can also read