Our air is making us sick. Advanced analytics can help - Ramboll Shair
←
→
Page content transcription
If your browser does not render page correctly, please read the page content below

Our air is making us sick.
Advanced analytics can help.

Ramboll Shair™
Ramboll Shair

Contents

3        Choking on air, drowning in data
3           7 million lives lost
3           Sensor data overload
4           Making sense of your air quality data
6        How Shair works
7           CAMx
9           Realtime traffic emissions estimates
9           Shairstreet
13          Integrating measurement data in near-realtime
14          Fully Automated and Cloud Native
14       Driven to empower communities
16       About us
16       Our team
16       Contact us!
17       References
Ramboll Shair

Choking on air, drowning in data
7 million lives lost
The simple act of breathing kills 7 million people every year (Figure
1, IHME 2021A). At the regional level, governments have made great
strides toward reducing air pollution concentrations and their per-capita
health effects. For example, the county of Los Angeles, California (USA)
has seen significant decreases in smog in the last half decade. Air quality,
however, is affected on a level far more local than the regional scale at
which we often observe and regulate it. Recently published research has
shown air pollution values differing substantially even between neigh-
boring city blocks (EDF 2017), yet the global average distance between a
population and its nearest fine particulate pollution monitor is relatively
massive at 220 km (Martin, et al. 2019). Recent efforts to fill in the par-
                6/16/2021                                                            Page 1

ticulate matter monitoring gaps with techniques like satellite sensing,
chemical transport, and
                                 7.5M
statistical modeling have
been shown to overesti-          7.0M

mate or underestimate
                                 6.5M
actual values by upwards
of 50 µg/m³ – 5 times the        6.0M

WHO recommended ex-
                                 5.5M
                                      1990 1995 2000  2005   2010    2015   2020
posure level of 10 µg/m³                            Estimated Deaths   Upper bound   Lower bound

(Martin, et al. 2019). The
Shair model is predicated         Figure 1:
                                  Global total all-cause deaths attributable to air pollution 1990-
on the belief that sensor data    2019. Per-capita burden is decreasing, but, as population grows,
                                  so, too, does the total disease burden of air pollution (IHME
and advanced analytics can        2021B).
help.

Sensor data overload
Local agencies, cities, and communities have recently begun their own
Ramboll Shair

efforts to fill the data gaps between regulatory monitors by setting up
their own monitors and monitoring networks. These networks are large-
ly comprised of mid-to-low cost sensors that can be easily mounted,
configured, and deployed. A quick look at data from just a single manu-
facturer of low-cost sensor-based monitors (Purple Air) reveals roughly
10,500 of their units are in use outdoors within the continental United
States. This manufacturer alone has nearly three times the presence of
the United States Environmental Protection Agency — which operates
roughly 2,000 various regulatory monitors across the United States—
and sensor adoption is increasing at an exponential rate. Within the
next few years, we expect to see tens of thousands around the world. If
integrated properly into traditional air quality assessment methods, the
large (and growing!) network of mid-to-low-cost sensors can dramati-
cally reduce the average distance between a population and the nearest
monitor. In effect, such integration can increase our understanding of
hyper-local changes in exposure-relevant air quality at a global scale.

On their own, sensor data alone are poorly-suited for assigning hotspot
causation to emissions sources and, in effect, understanding how
hotspots can be prevented. This is especially true in air sheds with com-
plex source profiles. To answer these questions, emissions inventories
and physical and chemical transport modeling methods are needed.
Similarly, we are unlikely to see a density of sensors that is so high that it
replaces the need for filling data gaps with modeling or interpolation --
these data gaps will become smaller but not disappear.

Making sense of air quality data
At Shair, we combine sensor data with tried and tested methods like
dispersion and weather modeling to uncover geographic and temporal
hotspots as well as the identities of responsible emissions sources. We
Ramboll Shair

use street-level and regional physical and chemical transport models
(CAMx) informed by traditional emissions inventories and novel realtime
traffic estimation methods to estimate concentrations at a hyper-local
10 meter resolution. Furthermore, we carefully adjust these estimates to
more accurately reflect measurements taken both by sensors-based and
regulatory grade monitors. Anchoring this model in measurement data
improves realtime temporal and spatial accuracy. It allows us to improve
our street-level model and potentially identify emissions sources missing
from local inventories.

The final result is a near-realtime look at the most significant sources
of pollution affecting a population and how levels of that pollution vary
around your city, facilitating meaningful actions for reducing exposures.
Ramboll Shair
How Shair works
The Shair team’s air quality model
(eponymously named “Shair”) adds
value to sensor network data by uncov-
ering emission sources and their contri-
butions. The model is sensor-agnostic
and can ingest information from any air
quality monitor or local emissions in-
ventory. Shair operates in the cloud to
translate large and unwieldy quantities
of air quality data into the information
needed to influence action and mitiga-
tion efforts by cities and air pollution
control agencies. Shair outputs sum-
mary datasets, maps, and visualizations
through a custom interface that can be
integrated into web applications or data
management systems. Shair is built on a
backbone of the CAMx regional air qual-
ity model with a custom street-level ur-
ban pollution model called “Shairstreet.”
Near-realtime data are integrated into
Shair (e.g., sensor data, reference data,
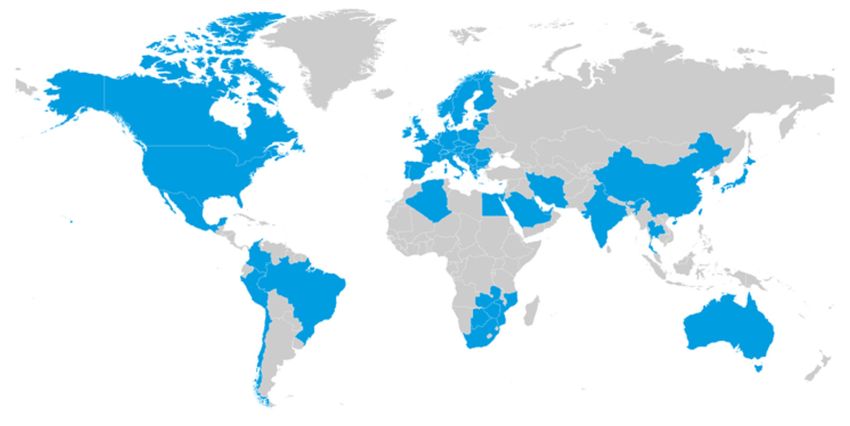
meteorology, traffic data, and other Figure 2:
The Shair architecture.
activity data) to “anchor” the model to
the near-realtime measurements. All of
this is performed in the cloud on Goo-
gle Cloud Platform (GCP) for increased
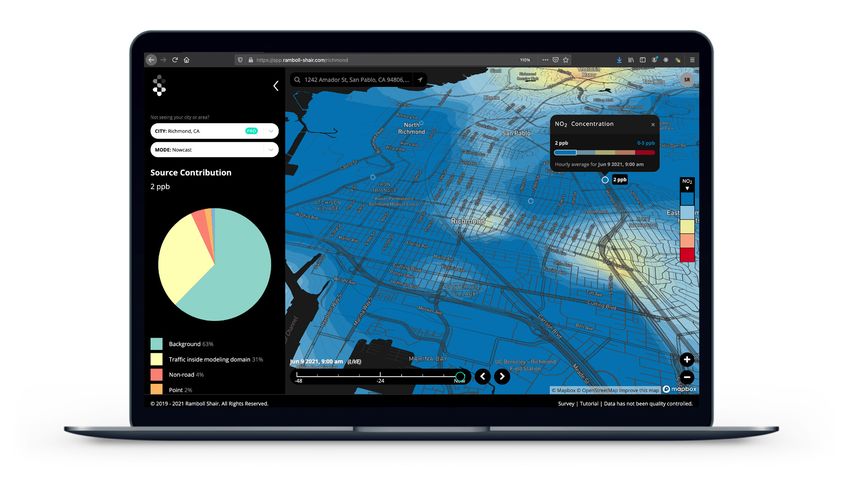
speed and reliability.Ramboll Shair Figure 3: CAMx applications (blue) worldwide. (Source: www.camx.com) CAMx The Shair workflow begins with the Comprehensive Air Quality Mod- el with extensions (CAMx), which is used to produce hourly estimates of local ground level NO2 and PM2.5 concentrations at a 200 m x 200 m scale. CAMx is a sophisticated open-source photochemical grid model developed by scientists at Ramboll. CAMx has been used extensive- ly for decades to support scientific research and regulatory air quality assessments for local, state, regional, and federal agencies (Figure 3). It has been well-tested and trusted since 1996 and is updated frequent- ly. In addition to PM2.5 and NO2, CAMx can be used to model transport and deposition of emissions of air toxics, ozone (O3), and other reactive tracers. CAMx allows Shair to account for photochemical reactions that produce O3, track the contributions from different source categories and use some of the same inputs that are used by local government agencies
Ramboll Shair

 for air quality modeling. Shair also takes advantage of CAMx’s parallel
 processing capabilities to ramp up modeling speeds and ensure timely
 outputs.

 Critical to the proper implementation of any air quality model are reliable
 emissions inventories and accurate meteorological information. Govern-
 ment agencies such as the Bay Area Air Quality Management District
 (BAAQMD) in California collect data and calculate emission inventories
 for different sources such as industry, traffic, ports, and airports. These
 inventories are then used by BAAQMD and other government agencies
 for studying and quantifying impacts of these emissions to regional air
 quality. Shair utilizes these where they are available. However, these
 emission inventories are not available in real-time and are either a snap-
 shot of the past or forecasts for the future. Therefore, where addition-
 al data is available, these inventories are fully replaced or modified to
 match current, real-time conditions. Shair uses meteorological data from
 the National Center for Atmospheric Research’s Weather Research &
 Forecasting model (WRF, pronounced “wharf”).

Figure 4:
Overview of the workflow and data sources used by Shair for estimating traffic flows.
Ramboll Shair

Realtime traffic emissions estimates
Shair is capable of estimating realtime road traffic emissions based on
traffic speed and congestion data provided via API from traffic report-
ing services. Shair currently leverages realtime data produced by HERE,
a traffic API owned by trusted geospatial data providers Nokia and
NAVTEQ. Shair can also be applied in areas with limited data availability
from traffic APIs and traffic counts from local agencies. In these instanc-
es, the methodology for deriving traffic flows varies based on the data
that is available. A general overview of the steps for estimating traffic
flows and emissions is presented in Figure 4.

Ultimately, Shair calculates traffic emissions from traffic flows and re-
gional pollutant-specific traffic emission factors. In the US, MOVES and
EMFAC can be utilized to derive fleet-average emission factors for each
hour of day, day of week, month, year, and speed. Depending on the
model, additional emission factors could be prepared for different road-
way and vehicle classifications. Outside of the US the COPERT model
can be used for this purpose. These models are usually developed and
maintained by government agencies and are based on local vehicle regis-
tration data.

Vehicle classification is an important factor in calculating emissions and
it also affects the traffic induced turbulence discussed in the Shairstreet
section below. However, such data cannot be easily obtained or esti-
mated. The current version of Shair uses travel demand model results to
estimate the average vehicle fleet composition by different road types
and time of day.

Shairstreet
Shairstreet is the roadway component of the Shair air quality modeling
system that provides a high-resolution (10m x 10m) pollutant concen-
Ramboll Shair

tration map from the real-time traffic emissions described above. Shair-
street works best when it is coupled with CAMx, though it can also be
used as a standalone model to estimate concentrations of pollutants
from traffic in urban areas.

The Shairstreet model is comprised of three main components:

•        An urban street canyon model
•        A simplified nitrogen oxide (NOx) chemistry model
•        A dispersion model for pollutant concentrations away from the
         roadways

Traffic pollution can have a great impact in urban areas where traffic
density and concentrations of vehicle exhaust gases are high and where
buildings adjacent to the street produce “street canyons” that modify
windflow conditions and restrict dilution. Capturing the complexity of
windflow patterns in street canyons is essential to understanding how
pollutant concentrations change on streets and sidewalks – where ex-
posure potential is increased – and how they move throughout a region.
Shairstreet can use several different methods to account for street can-
yon effects.

The default Shairstreet street canyon model developed at Shair is based
on the Operational Street Pollution Model (OSPM), a semi-empirical
model developed by researchers at the National Environmental Research
Institute of Denmark (Berkowicz et al 1997). OSPM, which has been used
and updated over the last 20 years, operates under the assumption that
the pollutant concentration of a street canyon has 3 major contributors:
direct contributions emitted from traffic affected by ground-level wind,
contributions from pollution in air that is recirculated by a well-mixed
vortex generated inside of the canyon, and background concentrations
Ramboll Shair entrained above the street canopy (i.e., above the street canyon and the buildings that create it). Shairstreet’s default street canyon model assumes that vertical disper- sion is governed primarily by mechanical turbulence with thermal strat- ification ignored, and that street-level mechanical turbulence is created by near-surface wind and vehicles in the street. Realtime vehicle counts and average vehicle speeds for all road links – which are based on speed and congestion data collected from a service like the HERE API – are used as inputs for calculating street level vertical turbulence. The vehi- cle induced turbulence is especially important on calm days, when the ambient turbulence is small, in determining pollutant concentrations. The street level wind speed is derived from canopy-level windspeeds provided by WRF and is calculated assuming a logarithmic reduction of the wind speed over the distance between the canopy top and the near-surface level and accounting for the angle of wind flow at the cano- py top. Traffic induced turbulence is characterized in the same approach as OSPM, which accounts for flow distortion and related turbulence produced by vehicles moving on the street. For roads without adjacent buildings (i.e., no street canyon), street level concentrations are assumed to be affected by only the surface level wind and traffic induced turbu- lence. Atmospheric dispersion of point emission sources can be well-modeled as Gaussian plumes. Estimating concentrations from line sources – as the Shair model estimates traffic emissions for road segments – only has an exact Gaussian solution when wind flow is perpendicular to that line source, but perpendicular airflow is frequently not a reality. Some mod- els, like AERMOD, approximate line sources as a high number of point or area sources for dispersion calculations, but this is computationally expensive when there are a large number of roadways and related line
Ramboll Shair

segments. Instead, Shairstreet employs a computationally efficient meth-
od for approximating Gaussian line source dispersion based on work
published by researchers at the University of California, Riverside and
the National Center for Atmospheric Research (VH2006) (Venkatram
and Horst 2006). This method has been shown to produce small, accept-
able errors when compared to an exact solution. The resulting dispersed
concentration values, similar to those demonstrated in Figure 5, are then
used to inform the concentrations of pollutants in nearby grid cells of the
Shair model (note: concentrations in Figure 5 are normalized).

Shairstreet also accounts for the formation of NO2, which is a complex
                                    photochemical process that depends
                                    on the amount of NOx and O3 avail-
                                    able. To model NO2 , Shairstreet uses
                                    a chemistry model published in 2011
                                    (During et al 2011), which accounts
                                    for the photolytic decomposition of
                                    NO2, temperature, mixing time, and
                                    compound residence time along with
                                    background concentrations of NOx
                                    and O3, which can be taken from near-
 Figure 5:
 Example implementation of VH2006   by reference monitors.
 dispersion for a line source with wind at 45
 degrees from the horizontal using normalized
 concentrations.                    Since Shairstreet calculates traffic
                                    concentrations resulting from each
individual road link, Shairstreet can also be used as a tool for urban plan-
ning informed by air quality.
Ramboll Shair Integrating measurement data in near-realtime A major innovation of the Shair model is its integration of near-realtime measurement data from both regulatory and sensor-based monitors to reduce model bias. All modeled pollutant concentrations are com- pared to measurements taken across the modeled domain. Errors dis- covered in the model are then adjusted for. The process Shair uses for this (“Shairsense”) is described graphically in Figure 6. The most recent measurements available are automatically called via API from all sensors and regulatory monitors within the modeling domain to which we have been given access. Values between these measurements are interpolat- ed using objective analysis methods like the Barnes method or kriging to produce an estimate of air quality at every point throughout the modeled domain. The difference between the values rooted in measurements and the modeled values are compared at each point to estimate model error in near-realtime. Model output is then adjusted for that error prior to pro- duction of the final Shair model output. As a result, Shair’s model output is anchored in near-realtime measurement data. Figure 6: Shair’s automated framework for integrating measurements and model output.
Ramboll Shair

One issue faced by community members and policy makers relying on
data in near-realtime is that scientists have not had a chance to manually
verify values or to check for false measurements and equipment failures.
The result can be misinformed decision making, especially when people
are worried about acute exposure events. Therefore, Shair has developed
an automated review process using sensor operating specifications and
historical trends. Our review process flags suspicious measurements
and possible outliers to prevent immediate integration with Shair. Once
flagged, these data can be examined for trends to identify unknown
emission sources or failing hardware.

Fully Automated and Cloud Native
Once the Shair model is customized, configured, and tuned for a geo-
graphic region, it is deployed in a completely automated way to the
cloud. The Shair workflow leverages Google’s cloud computing architec-
ture – GCP – to estimate near-realtime hyper-local air quality concen-
trations in a manner that is scalable to large spatial domains in a com-
pute-resource efficient way. On GCP, Shair utilizes cloud-native tools like
Kubernetes and Argo Workflows to execute all phases of real-time traffic
forecasting, Shairstreet, data quality control, and Shairsense. Data can
be disseminated to customers in a secure way via our web/phone apps
and APIs which include data and map-tile capabilities.

Driven to empower communities
Shair has been methodically designed to provide reliable, science-
backed information on local air quality trends to empower a wide variety
of users to devise and implement effective and defensible air quality in-
terventions. Shair output allows city planners, environmental managers,
and regulators to identify spatial and temporal pollution hotspots with
Ramboll Shair

detailed air quality maps rooted in near-realtime measurements. Planners
and regulators can also deploy Shair to gain a clearer understanding of
how source contributions in their region change across neighborhoods,
meteorological conditions, and time facilitating more efficient and effec-
tive mitigation efforts. Our online mapping solution and data insights can
be used to boost a community’s environmental engagement, enabling
citizens to plan healthier commutes and recreation. Every aspect of Shair
is designed with actionability in mind to support users’ efforts to improve
their health and environment.
Ramboll Shair

About us
Ramboll is an international consulting firm focused on building a more
sustainable world. Ramboll’s network of experts hold deep domain
knowledge in air pollution measurement and mitigation. The Ramboll
Shair team focuses on integrating state-of-the-science dispersion mod-
eling approaches with emerging low-cost sensing solutions to produce
hourly estimates of air quality at a 10m x 10m resolution and to trace
measured pollutants back to their sources for effective mitigation.

Our Team
Justin Bandoro, PhD       Kurt Richman       Ayah Hassan, EIT

Greg Yarwood, PhD         Chris Emery        Shari Libicki, PhD

Contact us!
Request a demo or find out more by visiting www.ramboll-shair.com or
sending us an email at shair@ramboll.com. Shair can be configured to
meet your specific needs. Don’t have any of your own sensors yet? The
Shair team would be delighted to introduce you to one of our sensor
hardware partners.
Ramboll Shair

References
Berkowicz et al. 1997. “Modelling traffic pollution in streets. Roskil-
de: National Environmental Research Institute.” http://orbit.dtu.dk/
files/128001317/Modelling_traffic_pollution_in_streets.pdf.

During et al. 2011. “A simplified NO/NO2 conversion model under consid-
eration of direct NO2-emissions.” Meteorologische Zeitschrift (20): 67-73.
doi:10.1127/0941-2948/2011/0491.

EDF. (2017, June 4). Study: Urban air pollution varies from block to block.
Retrieved September 9, 2019, from https://www.edf.org/media/study-ur-
ban-air-pollution-varies-block-block

IHME. 2021A. United States - All causes attributable to Paritculate matter
pollution, both sexes, all ages. University of Washington. Accessed June
18, 2021. https://vizhub.healthdata.org/gbd-compare/.

IHME. 2021B. Global, Both sexes, All Ages, All causes, risk: Air pollution.
Accessed June 10, 2021. http://ghdx.healthdata.org/gbd-results-tool.

Martin, R, M Brauer, A van Donkelaar, G Shaddick, U Narain, and S Dey.
2019. “No one knows which city has the highest concentration of fine
particulate matter.” Atmospheric Environment. doi:10.1016/j.aeaoa.
2019.100040.

Venkatram and Horst. 2006. “Approximating dispersion from a finite line
source.” Atmospheric Environment (40): 2401-2408. doi:10.1016/j.at-
mosenv. 2005.12.014.
You can also read