Air Quality Assessment Ninth Line Class EA - City of Mississauga SLR Project No: 241.20066.00000
←
→
Page content transcription
If your browser does not render page correctly, please read the page content below
Air Quality Assessment
 Ninth Line Class EA
 City of Mississauga

 SLR Project No: 241.20066.00000
 April 2021
Air Quality Assessment – Ninth Line
 From Derry Road to Eglington Avenue
 SLR Project No: 241.20066.00000

 Submitted by:
 SLR Consulting (Canada) Ltd.
 150 Research Lane, Suite 105
 Guelph, Ontario, N1G 4T2

 Prepared for:
 HDR Inc.
 255 Adelaide Street West
 Toronto, ON M5H 1X9

 April 2021

Prepared by: Reviewed by:

Richard Xiao Jenny Graham
Air Quality Scientist Senior Engineer

 Reviewed by:

 Jason Slusarczyk
 Principal, Air Quality Specialist

Distribution: 1 copy (PDF) – HDR Inc.
 1 copy - SLR Consulting (Canada) Ltd.

SLR #: 241.20066.00000 CONFIDENTIAL
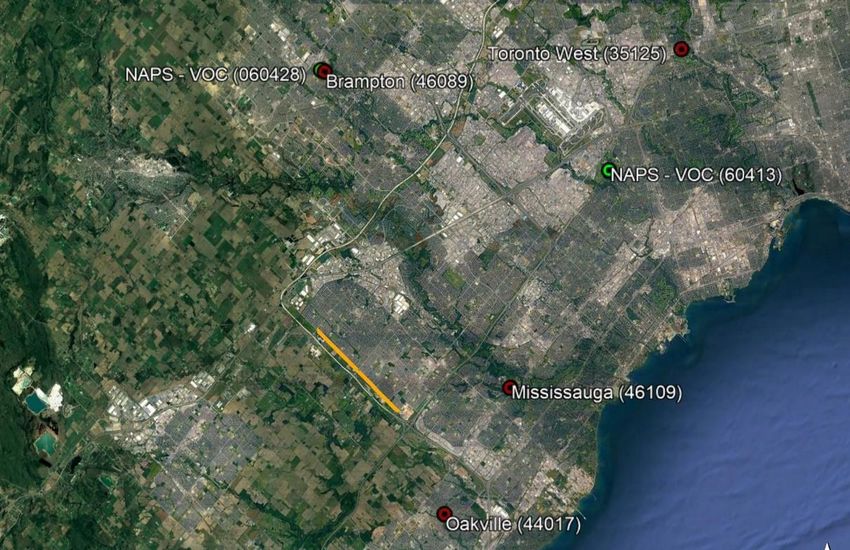
TABLE OF CONTENTS
1. INTRODUCTION .............................................................................................................................. 1
 Study Objectives ..................................................................................................................... 1
 Contaminants of Interest........................................................................................................ 1
 Applicable Guidelines ............................................................................................................. 2
 General Assessment Methodology ......................................................................................... 3

2. BACKGROUND AMBIENT DATA ....................................................................................................... 4
 Overview................................................................................................................................. 4
 Selection of Relevant Ambient Monitoring Stations ............................................................... 5
 Detailed Analysis of Selected Worst-case Monitoring Stations .............................................. 7

3. LOCAL AIR QUALITY ASSESSMENT ................................................................................................... 9
 Location of Sensitive Receptors within the Modelled Area .................................................... 9
 Road Traffic Data .................................................................................................................. 11
 Mereological Data ................................................................................................................ 14
 Motor Vehicle Emission Rates .............................................................................................. 14
 Re-suspended Particulate Matter Emission Rates ................................................................ 16
 Air Dispersion Modelling Using CAL3QHCR .......................................................................... 17
 Modelling Results ................................................................................................................. 17
 3.7.1 Nitrogen Dioxide CAAQs....................................................................................... 19
 3.7.2 Nitrogen Dioxide .................................................................................................. 20
 3.7.3 Carbon Monoxide................................................................................................. 21
 3.7.4 Fine Particulate Matter (PM2.5) ............................................................................ 22
 3.7.5 Coarse Particulate Matter (PM10) ......................................................................... 23
 3.7.6 Total Suspended Particulate Matter (TSP) ........................................................... 24
 3.7.7 Acetaldehyde ....................................................................................................... 25
 3.7.8 Acrolein ................................................................................................................ 26
 3.7.9 Benzene................................................................................................................ 27
 3.7.10 1,3-Butadiene ....................................................................................................... 28
 3.7.11 Formaldehyde ...................................................................................................... 29

4. GREENHOUSE GAS ASSESSMENT .................................................................................................. 30

5. AIR QUALITY IMPACTS DURING CONSTRUCTION ........................................................................... 32

6. CONCLUSIONS .............................................................................................................................. 33

7. REFERENCES................................................................................................................................. 35

Ninth Line EA April 2021
SLR #: 241.20066.00000
 i

TABLES
Table 1: Contaminant of Interest ................................................................................................... 1
Table 2: Applicable Contaminant Guidelines ................................................................................. 2
Table 3: Relevant MECP and NAPS Station Information ................................................................ 6
Table 4: Selection of Background Monitoring Stations .................................................................. 7
Table 5: Traffic Volumes (AADT – Vehicles/Day) Used in the Assessment................................... 12
Table 6: Traffic Volumes (AADT – Vehicles/Day) Used in the Assessment................................... 12
Table 7: Hourly Vehicle Distribution Used in the Assessment ..................................................... 13
Table 8: MOVES Input Parameters .............................................................................................. 15
Table 9: MOVES Output Emission Factors for Roadway Vehicles (g/VMT); Idle Emission Rates are
 grams per vehicle hour .................................................................................................. 16
Table 10: Re-suspended Particulate Matter Emission Factors....................................................... 16
Table 11: CAL3QHCR Model Input Parameters.............................................................................. 17
Table 12: Worst-Case Sensitive Receptors for 2041 Future Build Scenario ................................... 18
Table 13: Summary of Predicted NO2 Concentrations ................................................................... 19
Table 14: Summary of Predicted NO2 Concentrations ................................................................... 20
Table 15: Summary of Predicted CO Concentrations ..................................................................... 21
Table 16: Summary of Predicted PM2.5 Concentrations ................................................................. 22
Table 17: Summary of Predicted PM10 Concentrations.................................................................. 23
Table 18: Summary of Predicted TSP Concentrations ................................................................... 24
Table 19: Summary of Predicted Acetaldehyde Concentrations ................................................... 25
Table 20: Summary of Predicted Acrolein Concentrations ............................................................ 26
Table 21: Summary of Predicted Benzene Concentrations ........................................................... 27
Table 22: Summary of Predicted 1,3-Butadiene Concentrations ................................................... 28
Table 23: Summary of Predicted Formaldehyde Concentrations .................................................. 29
Table 24: Summary of Ninth Line Traffic Volumes, Roadway Length and Emission Rates ............. 30
Table 25: Changes in predicted GHG Emissions ............................................................................ 31
Table 26: Predicted Future Build GHG Emissions compared to GHG targets ................................ 31
Table 27: Worst-Case Summary of Predicted Combined Contaminant Concentrations for the
 2041 Future Build........................................................................................................... 34

Ninth Line EA April 2021
SLR #: 241.20066.00000
 ii
CONTENTS (CONTINUED)
FIGURES
Figure 1: Study Area and Modelled Hotspot ................................................................................................. 1
Figure 2: Motor Vehicle Emission Sources .................................................................................................... 1
Figure 3: Effect of Trans-Boundary Air Pollution (MECP, 2005) .................................................................... 4
Figure 4: Typical Wind Direction during an Ontario Smog Episode ............................................................... 5
Figure 5: Location of Ambient Monitoring Stations, Relevant to the Study Area .......................................... 6
Figure 6: Worst-Case Summary of Ambient Background Concentrations ..................................................... 8
Figure 7: Sensitive Receptor Locations Within Modelled Hotspot Area ...................................................... 10
Figure 8: Wind Frequency Diagram for Pearson International Airport (2013-2017) ................................... 14

APPENDICES
Appendix A Results for Each Receptor

Ninth Line EA April 2021
SLR #: 241.20066.00000
 iii
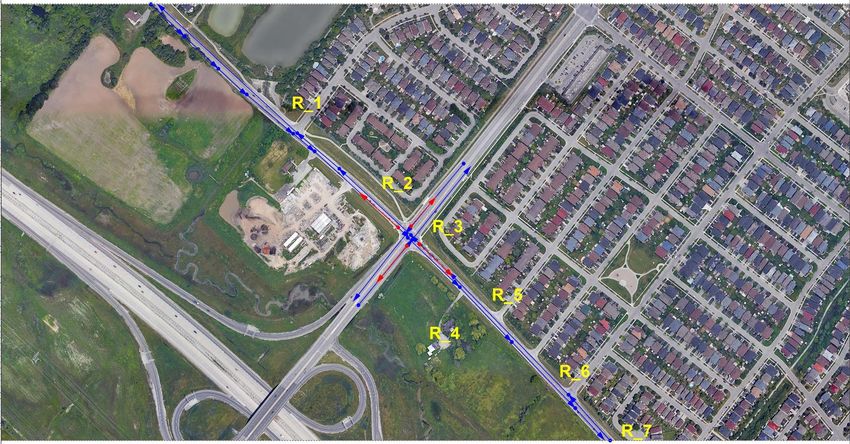
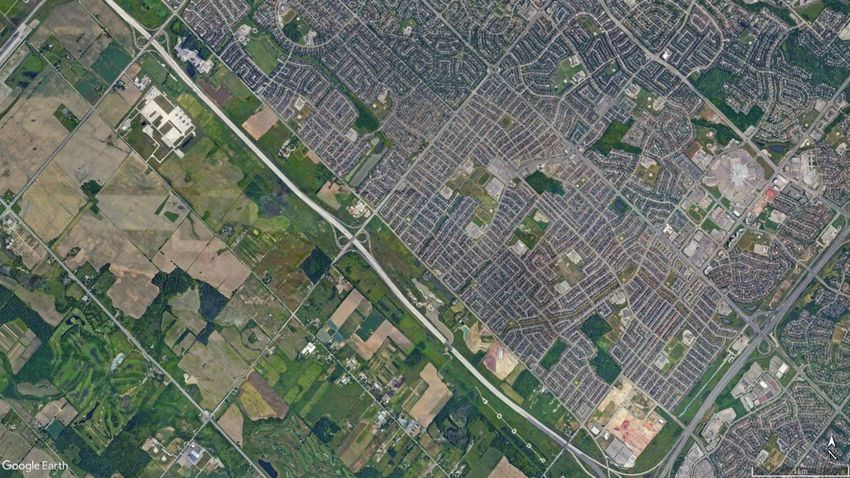
1. INTRODUCTION
SLR Consulting (Canada) Ltd., was retained by HDR Inc. to conduct an air quality assessment as part of the
Municipal Class Environmental Assessment for the widening of Ninth Line between Derry Road and
Eglinton Avenue, a length of approximately 6.2 kilometres within Mississauga, Ontario. The project
involves the widening of Ninth Line to two lanes, with the addition of one or two turning lanes at multiple
intersections.

 STUDY OBJECTIVES
The main objective of the study was to assess the local air quality impacts due to the proposed Ninth Line
widening from Derry Road to Eglinton Avenue. The study also includes an overview of construction
impacts and a screening level assessment of greenhouse gases (GHG). To meet these objectives, the
following scenarios were considered:
 • 2018 No Build (NB) – Assess the existing air quality conditions at representative receptors.
 Predicted contaminant concentrations from the existing traffic levels were combined with hourly
 measured ambient concentrations to determine combined impacts.
 • 2041 Future Build (FB)– Assess the future air quality conditions with the proposed project in
 place. Predicted contaminant concentrations associated with traffic levels for the preferred
 alternatives were combined with hourly measured ambient concentrations to determine
 combined impacts.
Given the nature of the roadway improvements and location of sensitive receptors within the study area,
HDR Inc. requested a “hotspot analysis” be performed. Rather than assessing the total length of the
roadway, the air quality assessment focused on one hotspot within the study area where worst-case
impacts are likely to occur. The intersection at Ninth Line with Britannia Road was selected to be assessed
for air quality impacts. This intersection was identified to have one of the highest future 2041 intersection
volumes. The segment also has high concentrations of critical receptors and sensitive receptors in the
form of parks and low-rise residential units respectively along Ninth Line. This section of the roadway was
determined to be representative of worst-case impacts for the air quality study. The hot-spot approach
and selected hot-spot was reviewed and accepted by the City of Mississauga prior to conducting the air
quality study.
The modelling considered vehicle emissions within a 1km hotspot centered at the Ninth Line and
Britannia Road intersection. The roadway segments considered in this assessment are shown in Figure 1.

Ninth Line EA April 2021
SLR #: 241.20066.00000
 1

Modelled Area

 Figure 1: Study Area and Modelled Hotspot

Ninth Line EA April 2021
SLR #: 241.20066.00000
 1
CONTAMINANTS OF INTEREST
The contaminants of interest from vehicle emissions are based on the regularly assessed contaminants of
interest for transportation assessments in Ontario, as determined by the Ministry of Transportation
Ontario (MTO) and Ministry of Environment, Conservation and Parks (MECP). Motor vehicle emissions
have largely been determined by scientists and engineers with United States and Canadian government
agencies such as the U.S. Environmental Protection Agency (EPA), the MECP, Environment Canada (EC),
Health Canada (HC), and the MTO. These contaminants are emitted due to fuel combustion, brake wear,
tire wear, the breakdown of dust on the roadway, fuel leaks, evaporation and permeation, and refuelling
leaks and spills as illustrated in Figure 2. Note that emissions related to refuelling leaks and spills are not
applicable to motor vehicle emissions from roadway travel. Instead, these emissions contribute to the
overall background levels of the applicable contaminants. All of the selected contaminants are emitted
during fuel combustion, while emissions from brake wear, tire wear, and breakdown of road dust include
only the particulates. A summary of these contaminants is provided in Table 1.

 Figure 2: Motor Vehicle Emission Sources

 Table 1: Contaminant of Interest

 Contaminants Volatile Organic Compounds (VOCs)

 Name Symbol Name Symbol

 Nitrogen Dioxide NO2 Acetaldehyde C2H4O
 Carbon Monoxide CO Acrolein C3H4O
 Fine Particulate Matter
 PM2.5 Benzene C6H6
 (
APPLICABLE GUIDELINES
In order to understand the existing conditions in the modelled area, ambient background concentrations
have been compared to guidelines established by government agencies and organizations. Relevant
agencies and organizations in Ontario and Canada, and their applicable contaminant guidelines are:
 • MECP Ambient Air Quality Criteria (AAQC);
 • Health Canada/Environment Canada National Ambient Air Quality Objectives (NAAQOs); and
 • Canadian Council of Ministers of the Environment (CCME) Canadian Ambient Air Quality
 Standards (CAAQS).
Within the guidelines, the threshold value for each contaminant and its applicable averaging period were
used to assess the maximum predicted impact at sensitive receptors derived from computer simulations.
The contaminants of interest are compared against 1-hour, 8-hour, 24-hour, and annual averaging
periods. The threshold values and averaging periods used in this assessment are presented in Table 2. It
should be noted that the CAAQS for PM2.5 is not based on the maximum 24-hour concentration value;
PM2.5 is assessed based on the annual 98th percentile value, averaged over 3 consecutive years.

 Table 2: Applicable Contaminant Guidelines

 3
Contaminant Averaging Period (hrs) Threshold Value (µg/m ) Source

 1 400 AAQC
 24 200 AAQC
 79
 NO2 1 [1] CAAQS (to be phased-in in 2025)
 (42 ppb)
 23
 Annual [2] CAAQS (to be phased-in in 2025)
 (12 ppb)
 1 36,200 AAQC
 CO
 8 15,700 AAQC
 [3]
 24 27 CAAQS (to be phased-in in 2020)
 PM2.5
 [4]
 Annual 8.8 CAAQS

 PM10 24 50 Interim AAQC
 TSP 24 120 AAQC
 Acetaldehyde 24 500 AAQC
 24 0.4 AAQC
 Acrolein
 1 4.5 AAQC
 Annual 0.45 AAQC
 Benzene
 24 2.3 AAQC
 24 10 AAQC
1,3-Butadiene
 Annual 2 AAQC

Ninth Line EA April 2021
SLR #: 241.20066.00000
 2
3
Contaminant Averaging Period (hrs) Threshold Value (µg/m ) Source

Formaldehyde 24 65 AAQC
[1] The 1-hour NO2 CAAQs is based on the 3-year average of the annual 98th percentile of the NO2 daily maximum 1-hour average concentrations.
[2] The annual CAAQs is based on the average over a single calendar year of all the 1-hour average NO2 concentrations.
[3] The 24-hr PM2.5 CAAQS is based on the 3-year average of the annual 98th percentile of the 24-hr average concentrations.
[4] The annual PM2.5 CAAQS is based on the average of the three highest annual average values over the study period.

 GENERAL ASSESSMENT METHODOLOGY
The worst-case contaminant concentrations due to motor vehicle emissions from the roadways were
predicted at nearby receptors using dispersion modelling software on an hourly basis for a five-year
period. 2013-2017 historical meteorological data from Pearson International Airport was used. Five
years were modelled in order to capture the worst-case meteorological conditions. Two emission
scenarios were assessed: 2018 No Build and 2041 Future Build.
Combined concentrations were determined by adding modelled and background (i.e., ambient data)
concentrations together on an hourly basis. Background concentrations for all available contaminants
were determined from MECP and NAPS (National Air Pollution Surveillance) stations nearest to the
modelled area with applicable datasets.
Maximum 1-hour, 8-hour, 24-hour, and annual predicted combined concentrations were determined for
comparison with the applicable guidelines using emission and dispersion models published by the U.S.
Environmental Protection Agency (EPA). The worst-case predicted impacts are presented in this report;
however, it is important to note that the worst-case impacts may occur infrequently and at only one
receptor location.

Ninth Line EA April 2021
SLR #: 241.20066.00000
 3
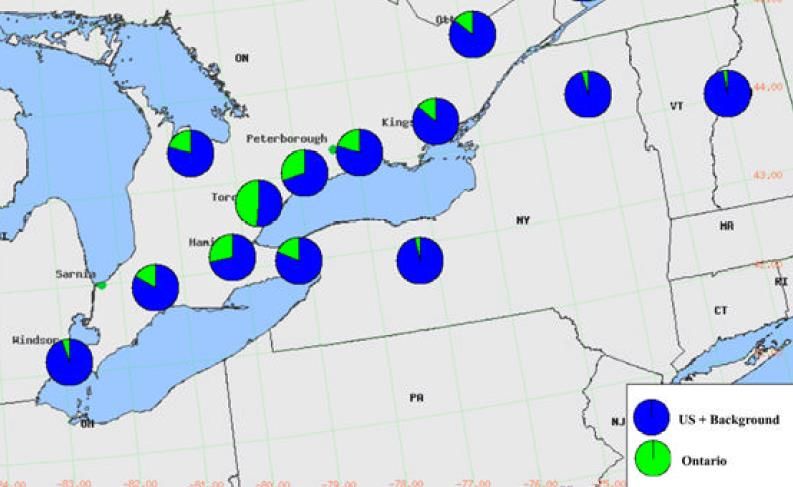
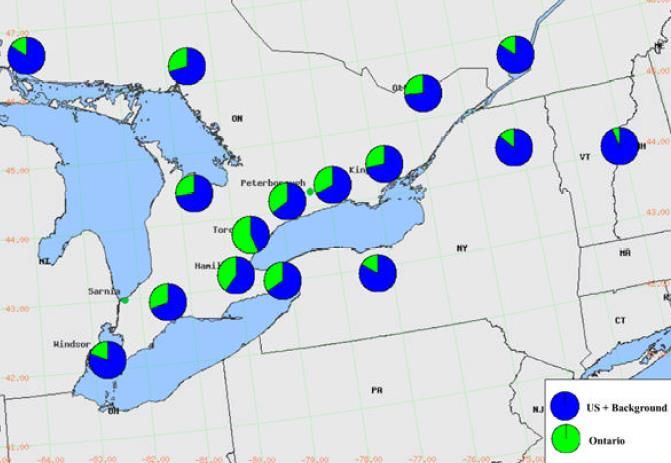
2. BACKGROUND AMBIENT DATA
 OVERVIEW
Background (ambient) conditions are measured contaminant concentrations that are independent of
emissions from the proposed project infrastructure. These concentrations consist of trans-boundary
(macro-scale), regional (meso-scale), and local (micro-scale) emission sources and result from both
primary and secondary formation. Primary contaminants are emitted directly by the source and
secondary contaminants are formed by complex chemical reactions in the atmosphere. Secondary
pollution is generally formed over great distances in the presence of sunlight and heat and most
noticeably results in the formation of fine particulate matter (PM2.5) and ground-level ozone (O3), also
considered smog.
In Ontario, a significant amount of smog originates from emission sources in the United States which is
the major contributor during smog events which usually occur in the summer season (MECP, 2005).
During smog episodes, the U.S. contribution to PM2.5 can be as much as 90 percent near the southwest
Ontario-U.S. border. The effects of U.S. air pollution in Ontario on a high PM2.5 day and on an average
PM2.5 spring/summer day are illustrated in Figure 3.

 High PM2.5 Days Average PM2.5 of Spring/Summer Season

 US + Background US + Background

 Ontario Ontario

 Figure 3: Effect of Trans-Boundary Air Pollution (MECP, 2005)
Air pollution is strongly influenced by weather systems (i.e., meteorology) that commonly move out of
central Canada into the mid-west of the U.S. then eastward to the Atlantic coast. This weather system
generally produces winds blowing from the southwest that can travel over major emission sources in the
U.S. and result in the transport of pollution into Ontario. This phenomenon is demonstrated in the
following figure and is based on a computer simulation from the Weather Research and Forecasting
(WRF) Model.

Ninth Line EA April 2021
SLR #: 241.20066.00000
 4
Figure 4: Typical Wind Direction during an Ontario Smog Episode
As discussed, understanding the composition of background air pollution and its influences are important
in determining potential impacts of a project, considering that the majority of the combined
concentrations are typically due to existing ambient background levels. In this assessment, background
conditions were characterized utilizing existing ambient monitoring data from MECP and NAPS Network
stations and added to the modelled predictions in order to conservatively estimate combined
concentrations.

 SELECTION OF RELEVANT AMBIENT MONITORING STATIONS
A review of MECP and NAPS ambient monitoring stations in Ontario was undertaken to identify the
monitoring stations that are in relative proximity to the modelled area and that would be representative
of background contaminant concentrations in the modelled area. The closest MECP station is located
8.3km east of the site at University of Toronto Mississauga Campus, second closest being Oakville at 9km
away. The closest NAPS (Etobicoke West) station is located within 17km of the site; therefore these
monitoring stations and several others were used to summarize background concentrations in the
modelled area. Note that CO is only monitored at the Toronto West Station, therefore this station was
used only to assess background CO concentrations. Also note that Windsor is the only station in Ontario
at which background Acrolein, Formaldehyde, and Acetaldehyde are measured in recent years. Only
these contaminants were considered from the Windsor station; the remaining contaminants from the
Windsor station were not considered given the stations’ distance from the modelled area. The locations
of the relevant ambient monitoring stations in relation to the modelled area are shown in Figure 5.
Station information is presented in Table 3.

Ninth Line EA April 2021
SLR #: 241.20066.00000
 5
Study Area

 Figure 5: Location of Ambient Monitoring Stations, Relevant to the Study Area

 Table 3: Relevant MECP and NAPS Station Information

 City/Town Station ID Location Operator Contaminant

 3359 Mississauga Rd. N., U of T NO2|PM2.5
 Mississauga 46109 MECP
 Campus.
 Eighth Line/Glenashton Dr. NO2|PM2.5
 Oakville 44017 MECP
 Halton Res.
 Brampton 46089 525 Main St. N., Peel Manor MECP NO2|PM2.5
 Toronto West 35125 125 Resources Rd MECP CO
 Etobicoke West 60413 Elmcrest Road NAPS 1,3-Butadiene|Benzene
 Brampton 60428 525 Main St. N., Peel Manor NAPS 1,3-Butadiene|Benzene
 Formaldehyde |Acetaldehyde
 Windsor West 60211 College St/Prince St NAPS
 | Acrolein

Ninth Line EA April 2021
SLR #: 241.20066.00000
 6
DETAILED ANALYSIS OF SELECTED WORST-CASE MONITORING STATIONS
Year 2013 to 2017 hourly ambient monitoring data from the selected stations were statistically
summarized for the desired averaging periods: 1-hour, 8-hour, 24-hour, and annual. Note that for the
NAPS stations (VOCs), formaldehyde, acetaldehyde and acrolein are only measured at the Windsor
station, and were not measured after 2010. Therefore 2006-2009 data was used for these VOCs.
Note that PM10 and TSP are not measured in Ontario; therefore, background concentrations were
estimated by applying a PM2.5/PM10 ratio of 0.54 and a PM2.5/TSP ratio of 0.3 (Lall et al., 2004). Ambient
VOC data is not monitored hourly, but is typically measured every six days. To combine this dataset with
the hourly modelled concentrations, each measured six-day value was applied to all hours between
measurement dates, when there were 6 days between measurements. When there was greater than 6
days between measurements, the 90th percentile measured value for the year in question was applied for
those days in order to determine combined concentrations. This method is conservative as it applies a
concentration that is higher than 90% of the measured concentrations whenever data was not available.

Table 4 shows the selected monitoring station for the various contaminants considered in the
assessment.

 Table 4: Selection of Background Monitoring Stations

 Contaminant Worst-Case Station Contaminant Worst-Case Station

 CAAQ NO2 (1-Hr) Brampton TSP Brampton

 CAAQ NO2 (ann) Brampton 1,3-Butadiene (24-hr) Toronto Downtown

 NO2 (1-Hr) Mississauga 1,3-Butadiene (ann) Toronto Downtown

 NO2 (24-Hr) Brampton Benzene (24-hr) Etobicoke West

 CO (1-Hr) Toronto West Benzene (ann) Etobicoke West

 CO (8-hr) Toronto West Formaldehyde Windsor

 PM2.5 (24-hr) Brampton Acrolein Windsor

 PM2.5 (ann) Mississauga Acetaldehyde Windsor

 Pm10 Brampton

Ninth Line EA April 2021
SLR #: 241.20066.00000
 7
A detailed statistical analysis of the selected worst-case background monitoring station for each of the
contaminants was performed and is summarized in Figure 6. Presented is the average, 90th percentile,
and maximum concentrations as a percentage of the guideline for each contaminant from the worst-case
monitoring station determined above. Maximum ambient concentrations represent a single worst-case
value. The 90th percentile concentration represents a reasonably worst-case background concentration,
and the average concentration represents a typical background value. The 98th percentile concentration is
shown for PM2.5, as the guideline for PM2.5 is based on 98th percentile concentrations.
Based on a review of ambient monitoring data from 2013-2017, background concentrations were
generally below their respective guidelines. The exceptions are particulate matter and benzene, as well as
the 1-hour NO2 CAAQS. In many cases the exceedances represent maximum concentrations and the 90th
percentile and/or average concentrations are below the guideline. It should be noted that PM10 and TSP
were calculated based on their relationship to PM2.5.

 Figure 6: Worst-Case Summary of Ambient Background Concentrations

Ninth Line EA April 2021
SLR #: 241.20066.00000
 8
3. LOCAL AIR QUALITY ASSESSMENT
 LOCATION OF SENSITIVE RECEPTORS WITHIN THE MODELLED AREA
Land uses which are defined as sensitive receptors for evaluating potential air quality effects are:
 • Health care facilities;
 • Senior citizens’ residences or long-term care facilities;
 • Childcare facilities;
 • Educational facilities;
 • Places of worship; and
 • Residential dwellings.
Seven sensitive receptor locations were selected to be representative of potential impacts within the
modelled area. They are all residential houses with the closest proximity to Ninth Line, and thus the most
likely impacted by the lane expansion. The receptors are distributed between the residences east and
west of Ninth Line as shown in Figure 7.

Ninth Line EA April 2021
SLR #: 241.20066.00000
 9
Figure 7: Sensitive Receptor Locations Within Modelled Hotspot Area

Ninth Line EA April 2021
SLR #: 241.20066.00000
 10
ROAD TRAFFIC DATA
Traffic data was provided by HDR Inc. in the form of annual average daily traffic (AADT) for the major
intersections within the study area for both the 2018 No Build and 2041 Future Build configurations. The
AADT volumes used in the assessment of the modelled area are shown in Table 5 and Table 6. Vehicle
posted speed limits of 60km/h and 70km/h were applied for Ninth Line and Britannia respectively.
Lastly, a heavy duty vehicle percentage was also provided by HDR for Ninth Line and arterial roads as
shown in Table 5 and Table 6. Hourly traffic volumes for Ninth Line were provided. Hourly traffic volumes
were not available for arterial road, therefore the US EPA standard rural weekday hourly distribution was
used for these roadways. The hourly distributions applied in this assessment are shown in Table 7.

Ninth Line EA April 2021
SLR #: 241.20066.00000
 11
Table 5: Traffic Volumes (AADT – Vehicles/Day) Used in the Assessment

 Along Ninth Line (Northbound and Southbound)

 2018 No Build 2041 Future Build % Medium % Heavy Truck
 Location % Trucks[1]
 AADT AADT Trucks Split[2] Splits[2]

 Between Derry Rd E and
 14,900 29,300 1.75% 72% 28%
 Britannia Rd

 Between Britannia Rd and
 18,400 39,800 1.05% 79% 21%
 Freeman Terrance
Note: [1] - Future truck % assumed to be same as No Build scenario
 [2] - % Truck split from total truck volumes

 Table 6: Traffic Volumes (AADT – Vehicles/Day) Used in the Assessment

 Britannia Road (Eastbound and Westbound)

 2018 No Build 2018 No Build 2041 Future Build 2041 Future Build % Heavy
 % % Medium
Location AADT West of AADT East of AADT West of AADT East of Truck
 Trucks[1] Trucks Split[2]
 Ninth Line Ninth Line Ninth Line Ninth Line Splits[2]

 Britannia
 20,700 18,500 36,300 25,500 0.9% 76% 24%
 Rd
Note: [1] - Future truck % assumed to be same as No Build scenario
 [2] - % Truck split from total truck volumes

Ninth Line EA April 2021
SLR #: 241.20066.00000
 12
Table 7: Hourly Vehicle Distribution Used in the Assessment

 Hour Along Ninth Line US EPA Weekday US EPA Weekend

 1 0.5% 1.0% 1.8%
 2 0.3% 0.7% 1.1%
 3 0.2% 0.6% 0.9%
 4 0.4% 0.7% 0.8%
 5 1.2% 0.9% 0.8%
 6 3.2% 2.0% 1.0%
 7 6.5% 4.1% 1.9%
 8 7.6% 5.8% 2.7%
 9 5.2% 5.4% 3.9%
 10 4.4% 5.3% 5.2%
 11 4.5% 5.5% 6.3%
 12 4.9% 5.8% 7.0%
 13 5.3% 5.9% 7.2%
 14 5.5% 6.0% 7.2%
 15 6.5% 6.6% 7.3%
 16 7.9% 7.2% 7.4%
 17 8.2% 7.8% 7.3%
 18 6.8% 7.6% 7.0%
 19 5.9% 5.9% 6.1%
 20 5.3% 4.3% 5.1%
 21 4.0% 3.6% 4.1%
 22 2.8% 3.1% 3.3%
 23 1.8% 2.4% 2.6%
 24 1.2% 1.8% 2.0%

Ninth Line EA April 2021
SLR #: 241.20066.00000
 13
MEREOLOGICAL DATA
2013-2017 hourly meteorological data was obtained from the Pearson International Airport in Toronto
and upper air data was obtained from Buffalo, New York as recommended by the MECP for the modelled
area. The combined data was processed to reflect conditions at the modelled area using the U.S. EPA’s
PCRAMMET software program which prepares meteorological data for use with the CAL3QHCR vehicle
emission dispersion model. A wind frequency diagram (wind rose) representing winds blowing from a
certain direction is shown in Figure 8.

 Figure 8: Wind Frequency Diagram for Pearson International Airport (2013-2017)

 MOTOR VEHICLE EMISSION RATES
The U.S. EPA’s Motor Vehicle Emission Simulator (MOVES) model provides estimates of current and
future emission rates from motor vehicles based on a variety of factors such as local meteorology, vehicle
fleet composition and speed. MOVES 2014b, released in December 2018, is the U.S. EPA’s tool for
estimating vehicle emissions due to the combustion of fuel, brake and tire wear, fuel evaporation,
permeation, and refuelling leaks. The model is based on “an analysis of millions of emission test results
and considerable advances in the Agency's understanding of vehicle emissions and accounts for changes
in emissions due to proposed standards and regulations”. For this project, MOVES was used to estimate
vehicle emissions based on vehicle type, road type, model year, and vehicle speed. Emission rates were

Ninth Line EA April 2021
SLR #: 241.20066.00000
 14
estimated based on the heavy-duty vehicle percentages provided by HDR. Vehicle age was based on the
U.S. EPA’s default distribution. Table 8 specifies the major inputs into MOVES.
From the MOVES outputs, the highest monthly value for each contaminant was selected to represent a
worst-case emission rate. The emission rates for each vehicle speed and contaminant modelled are
shown in Table 9 for the No Build and Future Build years, for a heavy and medium duty vehicle
percentage of 0.8 and 0.22%, respectively. As shown in Table 9, emissions in the future year are generally
predicted to decrease.

 Table 8: MOVES Input Parameters

 Parameter Input

 Scale Custom County Domain

 Temperature and Relative Humidity were obtained from
 Meteorology meteorological data from the Environment Canada Toronto
 TORONTO INTL A station for the years 2013 to 2017.

 Years 2018 (No Build) and 2041 (Future Build)

 Geographical Bounds Custom County Domain

 Fuels Compressed Natural Gas / Diesel Fuels / Gasoline Fuels

 Combination Long-haul Truck / Combination Short-haul Truck
 / Intercity Bus / Light Commercial Truck / Motor Home /
 Source Use Types Motorcycle / Passenger Car / Passenger Truck / Refuse Truck /
 School Bus / Single Unit Long-haul Truck / Single Unit Short-
 haul Truck / Transit Bus

 Road Type Rural Principal Arterial

 NO2 / CO / PM2.5 / PM10 / Acetaldehyde / Acrolein / Benzene /
 1,3-Butadiene / Formaldehyde/Equivalent CO2.
 TSP can’t be directly modelled by MOVES. However, the U.S.
 Contaminants and Processes
 EPA has determined, based on emissions test results, that
 >97% of tailpipe particulate matter is PM10 or less. Therefore,
 the PM10 exhaust emission rate was used for TSP.

 Vehicle Age Distribution MOVES defaults based on years selected for the roadway.

Ninth Line EA April 2021
SLR #: 241.20066.00000
 15
Table 9: MOVES Output Emission Factors for Roadway Vehicles (g/VMT); Idle Emission Rates are
 grams per vehicle hour

 Speed 1,3- Formald- Acetalde- 1
Year CO NOX Benzene Acrolein PM2.5 PM10 TSP
 (Km/hr) Butadiene ehyde hyde

2018 60 2.82 0.22 2.17E-03 1.29E-04 9.88E-04 5.61E-04 5.45E-05 4.91E-02 1.22E-02 1.22E-02

2018 70 2.49 0.22 1.92E-03 1.12E-04 8.68E-04 4.91E-04 4.78E-05 3.24E-02 9.98E-03 9.98E-03

2018 Idle 10.07 1.07 3.44E-02 3.47E-03 1.97E-02 1.26E-02 1.15E-03 1.10E-01 9.88E-02 9.88E-02

2041 60 0.87 0.04 7.80E-04 4.89E-07 3.40E-04 1.39E-04 1.69E-05 4.50E-02 8.07E-03 8.07E-03

2041 70 0.83 0.04 7.13E-04 4.16E-07 3.05E-04 1.25E-04 1.52E-05 2.79E-02 5.93E-03 5.93E-03

2041 Idle 2.08 0.20 9.70E-03 1.00E-05 5.04E-03 1.94E-03 2.45E-04 3.11E-02 2.77E-02 2.77E-02
 [1] – Note that TSP can’t be directly modelled by MOVES. However, the U.S. EPA has determined, based on emissions test results, that
 >97% of tailpipe particulate matter is PM10 or less. Therefore, the PM10 exhaust emission rate was used for TSP.

 RE-SUSPENDED PARTICULATE MATTER EMISSION RATES
A large portion of highway particulate matter emissions comes from dust on the pavement which is re-
suspended by vehicles travelling on the highway. These emissions are estimated using empirically
derived values presented by the U.S. EPA in their AP-42 report. The emissions factors for re-suspended
PM were estimated by using the following equation from U.S. EPA’s Document AP-42 report, Chapter
13.2.1.3 and are summarized in Table 10.
 = ( )0.91 ∗ ( )1.02
Where: E = the particulate emission factor
 k = the particulate size multiplier
 sL = silt loading
 W = average vehicle weight (Assumed 3 Tons based on fleet data and U.S. EPA vehicle weight
and distribution)

 Table 10: Re-suspended Particulate Matter Emission Factors

 K sL W E (g/VMT)
 Roadway AADT
 (PM2.5/PM10/TSP) (g/m2) (Tons) PM2.5 PM10 TSP

 10,000 0.25/1.0/5.24 0.03 3 0.03299 0.13195 0.368

Ninth Line EA April 2021
SLR #: 241.20066.00000
 16
AIR DISPERSION MODELLING USING CAL3QHCR
The U.S. EPA’s CAL3QHCR dispersion model, based on the Gaussian plume equation, was specifically
designed to predict air quality impacts from roadways using site specific meteorological data, vehicle
emissions, traffic data, and signal data. The model input requirements include roadway geometry,
sensitive receptor locations, meteorology, traffic volumes, and motor vehicle emission rates as well as
some contaminant physical properties such as settling and deposition velocities. CAL3QHCR uses this
information to calculate hourly concentrations which are then used to determine 1-hour, 8-hour, 24-hour
and annual averages for the contaminants of interest at the identified sensitive receptor locations. Table
11 provides the major inputs used in CAL3QHCR. The emission rates used in the model were the outputs
from the MOVES and AP-42 models, weighted for the vehicle fleet distributions provided. The outputs of
CAL3QHCR are presented in the results section.

 Table 11: CAL3QHCR Model Input Parameters

 Parameter Input

 Hourly traffic distributions were applied to the AADT traffic volumes in order to input traffic
 Free-Flow and Queue Link volumes in vehicles/hour.
 Traffic Data Emission rates from the MOVES output were input in grams/VMT or grams per vehicle hour.
 Signal timings for the traffic signal were input in seconds.

 Meteorological Data 2013-2017 data from Pearson International Airport

 PM2.5: 0.1 cm/s
 PM10: 0.5 cm/s
 Deposition Velocity
 TSP: 0.15 cm/s
 NO2, CO and VOCs: 0 cm/s
 PM2.5: 0.02 cm/s
 PM10: 0.3 cm/s
 Settling Velocity
 TSP: 1.8 cm/s
 CO, NO2, and VOCs: 0 cm/s
 The land type surrounding the project site is categorized as suburban. Therefore, a surface
 Surface Roughness
 roughness height of 52cm was applied in the model.

 Vehicle Emission Rate Emission rates calculated in MOVES and AP-42 were input in g/VMT

 MODELLING RESULTS
Presented below are the modelling results for the 2018 No Build and 2041 Future Build scenarios based
on 5-years of meteorological data. For each contaminant, combined concentrations are presented along
with the relevant contribution due to the background and roadway. Results in this section are presented
for the worst-case sensitive receptors for each contaminant and averaging period (see Table 12), which
were identified as the maximum combined concentration for the 2041 Future Build scenario. Results for
all modelled receptors are provided in Appendix A. It should be noted that the maximum combined
concentration at any sensitive receptor often occurs infrequently and may only occur for one hour or day
over the 5-year period.

Ninth Line EA April 2021
SLR #: 241.20066.00000
 17
Table 12: Worst-Case Sensitive Receptors for 2041 Future Build Scenario

 Contaminant Averaging Period Sensitive Receptor

 1-hour 5
 CAAQ NO2
 Annual 3
 1-hour 4
 NO2
 24-hour 4
 1-hour 3
 CO
 8-hour 3
 24-hour 3
 PM2.5
 Annual 3

 PM10 24-hour 2

 TSP 24-hour 2

 24-hour 1
 1,3-Butadiene
 Annual 1

 Formaldehyde 24-hour 4

 24-hour 2
 Benzene
 Annual 3
 1-hour 3
 Acrolein
 24-hour 2

 Acetaldehyde 24-hour 3

Coincidental hourly modelled roadway and background concentrations were added to derive the
combined concentration for each hour over the 5-year period. Hourly combined concentrations were
then used to determine contaminant concentrations based on the applicable averaging period. Statistical
analysis in the form of maximum, 90th percentile, and average combined concentrations were calculated
for the worst-case sensitive receptor for each contaminant and are presented below. The maximum
combined concentration (or 3-year average annual 98th percentile concentration in the case of PM2.5) was
used to assess compliance with MECP guidelines or CAAQS. If concentrations in excess of the guideline
were predicted, a frequency analysis was undertaken in order to estimate the number of occurrences
above the guideline. Provided below are the modelling results for the contaminants of interest.

Ninth Line EA April 2021
SLR #: 241.20066.00000
 18
3.7.1 NITROGEN DIOXIDE CAAQS
Table 13 presents the predicted combined concentrations for the worst-case sensitive receptor for 1-
hour and annual NO2 based on 5 years of meteorological data. The results conclude that:
 • The annual 98th percentile of daily maximum 1-hour NO2 concentrations, averaged over
 three consecutive years exceeds the CAAQS with a 3% contribution from the roadway.
 • The annual average concentration is within the guideline with a 2% contribution from the
 roadway.

 Table 13: Summary of Predicted NO2 Concentrations

 Statistical Analysis 2041 FB
 % of CAAQS Guideline:
 98th Percentile 125%
 th
 90 Percentile 98%
 Average 53%
 Roadway Contribution:
 98th Percentile 3%
 th
 90 Percentile 1%
 Average 1%
 Maximum combined concentrations
 exceed the 1-hour CAAQ Guideline.
 Note that the maximum background
 concentrations alone exceed the
 CAAQ’s 1-hr objective of 79 µg/m3.
 Also note that this objective is based
 on the 3-year average of the annual
 98th percentile of the NO2 daily-
 maximum 1-hour average
 concentrations.
 % of CAAQs Guideline:
 Maximum 89%
 Average 80%
 Roadway Contribution:
 Maximum 1%
 Average 2%

 Maximum combined concentrations
 fall within the annual CAAQ Guideline
 of 24 µg/m3.

Ninth Line EA April 2021
SLR #: 241.20066.00000
 19
3.7.2 NITROGEN DIOXIDE
 Table 14 presents the predicted combined concentrations for the worst-case sensitive receptor for 1-
 hour and 24-hour NO2 based on 5 years of meteorological data. The results conclude that:
 • Both the maximum 1-hour and 24-hour NO2 combined concentrations were below their respective
 MECP guidelines.

 Table 14: Summary of Predicted NO2 Concentrations

 Statistical Analysis 2041 FB
 % of MECP Guideline:
 Maximum 36%
 th
 90 Percentile 9%
 Average 4%
 Roadway Contribution:
 Maximum
3.7.3 CARBON MONOXIDE
 Table 15 presents the predicted combined concentrations for the worst-case sensitive receptor for 1-
 hour and 8-hour CO based on 5 years of meteorological data. The results conclude that:
 • Both the maximum 1-hour and 8-hour CO combined concentrations were well below their
 respective MECP guidelines.

 Table 15: Summary of Predicted CO Concentrations

 Statistical Analysis 2041 FB
 % of MECP Guideline:
 Maximum 6%
 th
 90 Percentile 1%
 Average 1%
 Roadway Contribution:
 Maximum 2%
 90th Percentile 3%
 Average 3%

 % of MECP Guideline:
 Maximum 10%
 th
 90 Percentile 3%
 Average 2%
 Roadway Contribution:
 Maximum 3%
 90th Percentile 3%
 Average 3%

Conclusions:
 • All combined concentrations were below their respective MECP guidelines.
 • The contribution from the roadway to the combined concentrations was 3%.

 Ninth Line EA April 2021
 SLR #: 241.20066.00000
 21
3.7.4 FINE PARTICULATE MATTER (PM2.5)
Table 16 presents the predicted combined concentrations for the worst-case sensitive receptor for 24-
hour and annual PM2.5 based on 5 years of meteorological data. The results conclude that:
 • The average annual 98th percentile of 24-hour PM2.5 combined concentrations, averaged
 over three consecutive years was below the CAAQS.
 • The three-year annual average concentration exceeded the guideline with a 4%
 contribution from the roadway.

 Table 16: Summary of Predicted PM2.5 Concentrations

 Statistical Analysis 2041 FB
 % of CAAQs Guideline:
 98th Percentile 88%
 th
 90 Percentile 54%
 Average 30%
 Roadway Contribution:
 98th Percentile 3%
 th
 90 Percentile 2%
 Average 4%
 The PM2.5 results were below
 the 3-year CAAQS. The
 highest 3 year rolling average
 of the yearly 98th percentile
 combined concentrations was
 calculated to be 23.80 µg/m3
 or 88% of the CAAQS.
 % of CAAQs Guideline:
 Maximum 3-Year
 101%
 Annual Average
 Roadway Contribution:
 Maximum 3-Year
 4%
 Annual Average

 The PM2.5 results were above
 the 3-year CAAQS.
 The maximum 3-year annual
 average concentration was
 101% of the guideline. Note
 that the background
 concentration alone is at 97%
 of the CAAQ guideline.

Ninth Line EA April 2021
SLR #: 241.20066.00000
 22
3.7.5 COARSE PARTICULATE MATTER (PM10)
 Table 17 presents the predicted combined concentration for the worst-case sensitive receptor for 24-
 hour PM10 based on 5 years of meteorological data. The results conclude that:
 • The maximum 24-hr PM10 combined concentration exceeded the MECP guideline.

 Table 17: Summary of Predicted PM10 Concentrations

 Statistical Analysis 2041 FB
 % of MECP Guideline:
 Maximum 158%
 th
 90 Percentile 56%
 Average 32%
 Roadway Contribution:
 Maximum 3%
 90th Percentile 7%
 Average 10%

Conclusions:
 • The maximum combined concentration of PM10 was found to exceed the guideline of 50 µg/m3. It
 should be noted, however, that background concentrations alone exceeded the guideline and that
 the roadway contribution is 3% of the maximum value.
 • Frequency analysis was conducted to determine the frequency of exceedances over the 5-year
 period.
 • A total of 13 days exceeded the guideline in the five-year period for No Build and 14 days for the
 2041 Future Build scenario, which equate to less than 1% of the time.

 Ninth Line EA April 2021
 SLR #: 241.20066.00000
 23
3.7.6 TOTAL SUSPENDED PARTICULATE MATTER (TSP)
 Table 18 presents the predicted combined concentration for the worst-case sensitive receptor for 24-
 hour TSP based on 5 years of meteorological data. The results conclude that:
 • The maximum 24-hr TSP combined concentration exceeded the MECP guideline.

 Table 18: Summary of Predicted TSP Concentrations

 Statistical Analysis 2041 FB
 % of MECP Guideline:
 Maximum 123%
 th
 90 Percentile 46%
 Average 26%
 roadway Contribution:
 Maximum 6%
 90th Percentile 15%
 Average 16%

Conclusions:
 • The TSP results show that the combined concentrations exceed the guideline. It should be
 noted, however, that background concentrations alone account for 117% of the guideline and that
 the roadway contribution is 6% of the maximum value.
 • Frequency analysis was conducted to determine the frequency of exceedances over the 5-year
 period.
 • A total of 4 days exceeded the guideline in the five-year period, in both the No Build and Future
 Build scenarios, which equates to less than 1% of the time. Note that there are no additional
 exceedances between the No Build and Future Build scenarios.

 Ninth Line EA April 2021
 SLR #: 241.20066.00000
 24
Ambient VOC concentrations are typically measured every 6 days in Ontario. In order to combine the
 ambient data to the modelled results, the measured concentrations were applied to the following 6 days
 when measurements were 6 days apart. When measurements were further than 6 days apart, the 90th
 percentile annual value was used to represent the missing data. This background data was added to the
 predicted hourly roadway concentrations at each receptor to obtain results for the VOCs.

 3.7.7 ACETALDEHYDE
 Table 19 presents the predicted combined concentration for the worst-case sensitive receptor for 24-
 hour acetaldehyde based on 5 years of meteorological data. The results conclude that:
 • The maximum 24-hour acetaldehyde combined concentration was well below the
 respective MECP guideline.

 Table 19: Summary of Predicted Acetaldehyde Concentrations

 Statistical Analysis 2041 FB
 % of MECP Guideline:
 Maximum
3.7.8 ACROLEIN
Table 20 presents the predicted combined concentrations for the worst-case sensitive receptor for 1-
hour and 24-hour acrolein based on 5 years of meteorological data. The results conclude that:
 • The maximum 1-hour and 24-hour acrolein combined concentrations were below the
 respective MECP guidelines.

 Table 20: Summary of Predicted Acrolein Concentrations

 Statistical Analysis 2041 FB
 % of MECP Guideline:
 Maximum 3%
 th
 90 Percentile 2%
 Average 1%
 Guideline: 4.5 µg/m3 Roadway Contribution:
 Maximum 2%
 90th Percentile
3.7.9 BENZENE
Table 21 presents the predicted combined concentrations for the worst-case sensitive receptor for 24-
hour and annual benzene based on 5 years of meteorological data. The results conclude that:
 • The maximum 24-hour benzene combined concentration was below the respective MECP
 guideline. The roadway contribution to the maximum concentration was 2%.
 • The annual benzene concentration exceeded the guidline. The roadway contribution to
 the maximum annual average was 1%.

 Table 21: Summary of Predicted Benzene Concentrations

 Statistical Analysis 2041 FB
 % of MECP Guideline:
 Maximum 69%
 th
 90 Percentile 48%
 Average 32%
 Roadway Contribution:
 Maximum 2%
 th
 90 Percentile 1%
 Average 2%
 Conclusions:
 The combined concentrations
 were below the respective
 MECP 24-hr guideline. The
 roadway contribution to the
 maximum was 2%.
 % of MECP Guideline:
 Maximum 210%
 Average 162%
 Roadway Contribution:
 Maximum 1%
 Average 1%
 Conclusions:
 The combined concentration
 exceeded the MECP annual
 guideline. It should be noted
 that ambient concentrations
 were 209% of the guideline
 and the roadway contribution
 to the maximum was 1%.

Ninth Line EA April 2021
SLR #: 241.20066.00000
 27
3.7.10 1,3-BUTADIENE
Table 22 presents the predicted combined concentrations for the worst-case sensitive receptor for 24-
hour and annual 1,3-butadiene based on 5 years of meteorological data. The results conclude that:
 • The maximum 24-hour and annual 1,3-butadiene combined concentrations were well
 below the respective MECP guidelines.

 Table 22: Summary of Predicted 1,3-Butadiene Concentrations

 Statistical Analysis 2041 FB
 % of MECP Guideline:
 Maximum 2%
 th
 90 Percentile 1%
 Average
3.7.11 FORMALDEHYDE
 Table 23 presents the predicted combined concentration for the worst-case sensitive receptor for 24-
 hour formaldehyde based on 5 years of meteorological data. The results conclude that:
 • The maximum 24-hour formaldehyde combined concentration was below the respective
 MECP guideline.

 Table 23: Summary of Predicted Formaldehyde Concentrations

 Statistical Analysis 2041 FB
 % of MECP Guideline:
 Maximum 6%
 th
 90 Percentile 4%
 Average 3%
 Roadway Contribution:
 Maximum
4. GREENHOUSE GAS ASSESSMENT
In addition to the contaminants of interest assessed in the local air quality assessment, greenhouse gas
(GHG) emissions were predicted from the project. Potential impacts were assessed by calculating the
relative change in total emissions between the 2018 No Build and 2041 Future Build scenarios as well
comparing the total emission to the 2030 provincial and Canada-wide GHG targets. Total GHG emissions
from the roadway were determined based on the total 6.2km length of the study roadway, traffic
volumes, and predicted emission rates.

From a GHG perspective, the contaminants of concern from motor vehicle emissions are carbon dioxide
(CO2), methane (CH4), and nitrous oxide (N2O). These GHGs can be further classified according to their
Global Warming Potential. The Global Warming Potential is a multiplier developed for each GHG, which
allows comparison of the ability of each GHG to trap heat in the atmosphere, relative to carbon dioxide.
Using these multipliers, total GHG emissions can be classified as CO2 equivalent emissions. For this
assessment, the MOVES model was used to determine total CO2 equivalent emission rates for the posted
speed and heavy/medium-duty vehicle percentage on Ninth Line. Table 24 summarizes the length of the
roadway, traffic volumes, and emission rates used to determine total GHG emissions on Ninth Line in the
2018 No Build and 2041 Future Build scenario.

 Table 24: Summary of Ninth Line Traffic Volumes, Roadway Length and Emission Rates

 2018 2041 2018 CO2 2041 CO2
 Length of Heavy/Medium Posted
 Two- Two- Equivalent Equivalent
 Roadway Roadway Duty Vehicle Speed
 Way Way Emission Rate Emission Rate
 (Miles) Percentage (%) (km/hr)
 AADT AADT (g/VMT) (g/VMT)

 Ninth Line
 South of 14,900 29,300 1.86 0.5/1.3 60 366 277
 Derry
 Ninth Line
Britannia to 18,400 39,800 0.12 0.8/0.2 60 371 232
 Freeman
 Ninth Line
Freeman to 18,500 40,000 1,80 0.8/0.2 60 4,512 6,100
 Stardust[1]
Ninth Line
Stardust to 18,500 40,000 0.12 0.6/1.6 60 384 245
 Eglington
Note: [1] – AADT estimated using the worst case of Freeman and Stardust
The total predicted annual GHG emissions for the 2018 No Build and 2041 Future Build scenarios are
shown in Table 25. Also shown is the percent change in total GHG emissions between the scenarios. The
results show that due to the increases in traffic volumes on existing routes and decrease in future vehicle
emissions levels, the total GHG emissions will increase by 8%.
Table 26 shows the GHG emissions on Ninth Line represent 0.0093% of the provincial target and 0.0019%
of the Canada-wide target. The contribution of GHG emissions from the project is small in comparison to
these provincial and national targets.

Ninth Line EA April 2021
SLR #: 241.20066.00000
 30
Table 25: Changes in predicted GHG Emissions

 2018 CO2 Equivalent Emission Rate 2041 CO2 Equivalent Emission Rate Changes in Emission
Roadway
 (g/VMT) (g/VMT) (%)

 Ninth
 8,820 9,567 8%
 Line

 Table 26: Predicted Future Build GHG Emissions compared to GHG targets

 Roadway Total CO2 Equivalent (tonnes/year)

 Ninth Line from Derry to Eglington 9,560
 Comparison to Canada-wide Target 0.0019%
 Comparison to Ontario-wide Target 0.0093%
 Comparison to Transportation Target 0.0058%
 Canada-Wide 2030 GHG Target1 517,000,000
 Ontario-Wide 2030 GHG Target2 102,350,000
 Transportation Sector GHG 2030 Target3 164,000,000

1
 Environment and Climate Change Canada (2018) Canadian Environmental Sustainability Indicators: Progress towards Canada's greenhouse gas
 emissions reduction target. Available at: www.canada.ca/en/environment-climate-change/services/environmentalindicators/progress-towards-
 canada-greenhouse-gas-emissions-reduction-target.html.
2 Ontario Climate Change Strategy. Available at: https://www.ontario.ca/page/climate-change-strategy
3 CANADA’S SECOND BIENNIAL REPORT ON CLIMATE CHANGE. Available at https://www.canada.ca/en/environment-climate-
 change/services/climate-change/greenhouse-gas-emissions/second-biennial-report.html

Ninth Line EA April 2021
SLR #: 241.20066.00000
 31
5. AIR QUALITY IMPACTS DURING CONSTRUCTION
During construction of the roadway, dust is the primary contaminant of concern. Other contaminants
including NOx and VOC’s may be emitted from equipment used during construction activities. Due to the
temporary nature of construction activities, there are no air quality criteria specific to construction
activities. However, the Environment Canada “Best Practices for the Reduction of Air Emissions from
Construction and Demolition Activities” document provides several mitigation measures for reducing
emissions during construction activities. Mitigation techniques discussed in the document include
material wetting or use of chemical suppressants to reduce dust, use of wind barriers, and limiting
exposed areas which may be a source of dust and equipment washing. In addition, planting of additional
vegetation (for example coniferous species) and use of non-chloride dust suppressants for dust control
are recommended by the MECP. It is recommended that these best management practices be followed
during construction of the roadway to reduce any air quality impacts that may occur.

Ninth Line EA April 2021
SLR #: 241.20066.00000
 32
6. CONCLUSIONS
Presented in Table 27 is a summary of the worst-case modelling results for the 2041 Future Build based
on 5-years of meteorological data. For each contaminant, combined concentrations are presented as a
percentage of the applicable guideline.
The maximum combined concentrations for the Future Build were all below their respective MECP
guidelines or CAAQS, with the exception of the 1-hr and annual NO2 CAAQ, annual PM2.5, 24-hr PM10, 24-
hr TSP, 24-hour benzene and annual benzene. Note that background concentrations exceeded the
guideline for all of these contaminant averaging periods as well. The contribution from the roadway
emissions to the combined concentrations was small.
Mitigation measures are not warranted, due to the small number of days which are expected to exceed
the guideline.
Greenhouse gas assessment and air quality impacts during construction are discussed in Section 4 and
Section 5.

Ninth Line EA April 2021
SLR #: 241.20066.00000
 33
Table 27: Worst-Case Summary of Predicted Combined Contaminant Concentrations
 for the 2041 Future Build

 5 Year Statistical Summary % of Guideline
 2041 FB
 CAAQ NO2 (1-hr) 125%
 CAAQ NO2
 89%
 (Annual)
 NO2 (1-hr) 36%
 NO2 (24-hr) 44%
 CO (1-hr) 6%
 CO (8-hr) 10%
 PM2.5 (24-hr See
 88%
 Note)
 PM2.5 (Annual) 101%
 PM10 158%
 TSP 123%
 Acetaldehyde
7. REFERENCES
Air & Waste Management Association, 2011. The Role of Vegetation in Mitigating Air Quality Impacts
from Traffic Emissions. [online] http://www.epa.gov/nrmrl/appcd/nearroadway/pdfs/baldauf.pdf
CCME, 2000. Canadian Council of Ministers of the Environment. Canada-Wide Standards of Particulate
Matter and Ozone. Endorsed by CCME Council of Ministers, Quebec City.
[Online]http://www.ccme.ca/assets/pdf/pmozone_standard_e.pdf
Environment Canada. 2000. Priority Substances List Assessment Report: Respirable Particulate Matter
Less Than or Equal to 10 Microns. Canadian Environmental Protection Act, 1999. Environment Canada,
Health Canada. [Online] http://www.ec.gc.ca/Substances/ese/eng/psap/final/PM-10.cfm.
Health Canada. 1999. National Ambient Air Quality Objectives for Particulate Matter Part 1: Science
Assessment Document. Health Canada. A report by the CEPA/FPAC Working Group on Air Quality
Objectives and Guidelines.
Lall, R., Kendall, M., Ito, K., Thurston, G., 2004. Estimation of historical annual PM2.5 exposures for health
effects assessment. Atmospheric Environment 38(2004) 5217-5226.
Ontario Publication 6570e, 2008. Ontario's Ambient Air Quality Criteria. Standards Development Branch,
Ontario Ministry of the Environment.
Ontario Ministry of the Environment, 2005. Transboundary Air Pollution in Ontario. Queens Printer for
Ontario.
Randerson, D., 1984. Atmospheric Science and Power Production . United States Department of Energy.
Seinfeld, J.H. and Pandis, S.P.,2006. Atmospheric Chemistry and Physics From Air Pollution to Climate
Change. New Jersey: John Wiley & Sons.
United States Environmental Protection Agency, 2008. AERSURFACE User’s Guide. USEPA.
United States Environmental Protection Agency, 1997. Document AP 42, Volume I, Fifth Edition, Chapter
13.2.1. USEPA.
United States Environmental Protection Agency, 2010. Exhaust and Crankcase Emission Factors for
Nonroad Engine Modeling – Compression-Ignition. USEPA.
United States Environmental Protection Agency, 2009. MOVES 2010 Highway Vehicles: Population and
Activity Data. USEPA.
WHO. 2005. WHO air quality guidelines global update 2005. Report on a Working Group meeting, Boon,
Germany, October 18-20, 2005..

Ninth Line EA April 2021
SLR #: 241.20066.00000
 35
You can also read