Discovery of a 30-degree-long ultraviolet arc in Ursa Major
←
→
Page content transcription
If your browser does not render page correctly, please read the page content below
A&A 636, L8 (2020)
https://doi.org/10.1051/0004-6361/202037975                                                                           Astronomy
c ESO 2020                                                                                                             &
                                                                                                                      Astrophysics

                                                          LETTER TO THE EDITOR

          Discovery of a 30-degree-long ultraviolet arc in Ursa Major
      A. Bracco1,2 , R. A. Benjamin3 , M. I. R. Alves4 , A. Lehmann2 , F. Boulanger2 , L. Montier5 , D. Mittelman6 ,
                                              D. di Cicco6 , and S. Walker6

      1
          Rudjer Bošković Institute, Bijenička cesta 54, 10000 Zagreb, Croatia
          e-mail: abracco@irb.hr
      2
          Laboratoire de Physique de l’Ecole Normale Supérieure, ENS, Université PSL, CNRS, Sorbonne Université, Université de Paris,
          Paris, France
      3
          University of Wisconsin-Whitewater, Department of Physics, 800 West Main St, Whitewater, WI 53190, USA
      4
          Radboud University, Department of Astrophysics/IMAPP, PO Box 9010, 6500 GL Nijmegen, The Netherlands
      5
          IRAP, Université de Toulouse, CNRS, CNES, UPS, Toulouse, France
      6
          MDW Sky Survey, New Mexico Skies Observatory, Mayhill, NM 88339, USA

     Received 17 March 2020 / Accepted 3 April 2020

                                                                   ABSTRACT

     Our view of the interstellar medium of the Milky Way and the universe beyond is affected by the structure of the local environment
     in the solar neighborhood. We present the discovery of a 30-degree-long arc of ultraviolet emission with a thickness of only a few
     arcminutes: the Ursa Major arc. This consists of several arclets seen in the near- and far-ultraviolet bands of the GALEX satellite. A
     two degree section of the arc was first detected in the Hα optical spectral line in 1997; additional sections were seen in the optical by
     the team of amateur astronomers included in this work. This direction of the sky is known for very low hydrogen column density and
     dust extinction; many deep fields for extragalactic and cosmological investigations lie in this direction. Diffuse ultraviolet and optical
     interstellar emission are often attributed to scattering of light by interstellar dust. The lack of correlation between the Ursa Major arc
     and thermal dust emission observed with the Planck satellite, however, suggests that other emission mechanisms must be at play. We
     discuss the origin of the Ursa Major arc as the result of an interstellar shock in the solar neighborhood.
     Key words. ultraviolet: ISM – ISM: structure – shock waves – ISM: supernova remnants – solar neighborhood –
     local insterstellar matter

1. Introduction                                                            2. Description of the Ursa Major (UMa) arc
New observations of the diffuse interstellar medium (ISM)                  We investigated the MB filament in several wavebands using
in 21 cm emission, dust emission and polarization, and low                 the Aladin sky-viewer (Boch & Fernique 2014) and discov-
radio frequency polarized emission, have awakened new inter-               ered that the MB filament is also visible both in the far ultra-
est in linear structures in the ISM that may affect our view               violet (FUV; 130–180 nm) and in the near ultraviolet (NUV;
of the solar neighborhood (Clark et al. 2015; Jelić et al. 2015;          170–280 nm) bands of the Galaxy Evolution Explorer (GALEX)
Planck Collaboration Int. XXXII 2016). The study of the struc-             All-Sky Imaging Survey (AIS; Bianchi 2009). The Ultraviolet
ture of the local and diffuse ISM is important as it provides a            imaging, which covers a much wider area of the sky than the
foreground that must be accounted for in studying our Milky                original Hα observations, demonstrates that the MB filament is a
Way and the universe beyond.                                               piece of a much larger arc-like structure. A GALEX FUV image
     In 2001 P. McCullough and R.A. Benjamin presented the                 displaying a large fraction of the Ursa Major arc (UMa arc) is
discovery of an unusually straight and narrow ionized fila-                shown in Fig. 1 along with zoom-in views of selected sections in
ment that is 2◦.5 in length in the direction of Ursa Major                 Hα and the GALEX NUV band. The structure consists of sev-
(McCullough & Benjamin 2001, hereafter MB01). This filament                eral piecewise-continuous arclets, which are occasionally multi-
was detected in Hα (656 nm, hereafter the MB filament) and                 ple. Most of the arclets we found lie along a curved path from
has a surface brightness of ∼0.5 R, and its origin has yet to              Galactic coordinates (l, b) = (115◦.4, 30◦.7) to (147◦.7, 43◦.5).
be established. These authors considered four options for the                  If the structure were due to a linear trail, the option favored
origin of this structure: (1) a low-density jet, (2) an unusually          by MB01, it would project onto a great circle on the sky. We
straight nebular filament, (3) shock ionization by a compact               found that no single great circle can fit the arc we observed. In
source, such as a neutron star, and (4) a trail of ionized gas left        addition, a search of GALEX images of nearby white dwarfs and
by a low-luminosity ionizing source. Although they favored the             hot subdwarfs with parallaxes and proper motions measured by
final “Fossil Stromgren trail” (FST) option, no plausible ionizing         the Gaia satellite (Geier et al. 2019) shows no structures in the
source was ever identified.                                                FUV similar to the original MB filament. For these two reasons,
     In this Letter we present the outstanding discovery of a              the FST hypothesis appears to be ruled out.
longer portion of the MB filament seen both in the ultraviolet                 We found instead that most of the arclets lie along one-sixth
and in Hα extending over thirty degrees on the sky. We discuss             (1 radian) of a circle centered on (l, b) = (107◦.7, 60◦.0) with angu-
its origin in terms of interstellar shocks in the ISM.                     lar radius ΘR = 29◦.28 ± 0◦.23, labeled as feature A in Fig. 1.

                                                       Article published by EDP Sciences                                             L8, page 1 of 8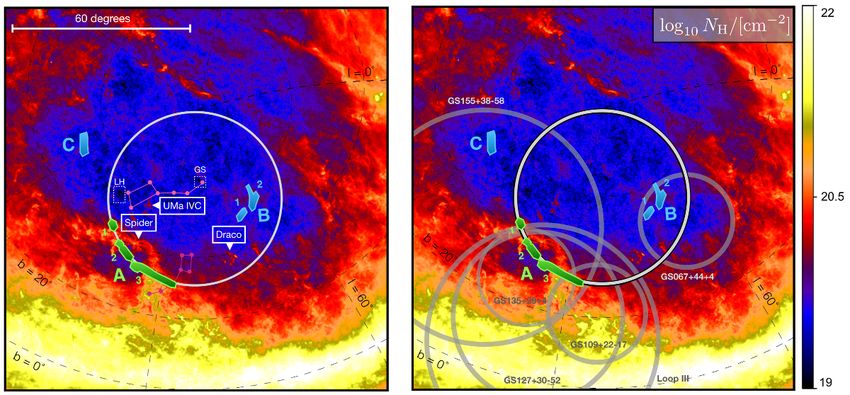
A&A 636, L8 (2020)

Fig. 1. Ursa Major (UMa) arc, feature A (between the red arrows), in a mosaicked image of GALEX FUV data taken in 2005. Each (circular)
pointing has a diameter of 1◦.27. Inset (a) shows the original 1997 detection of the Hα filament published by McCullough & Benjamin (2001); inset
(b) shows part of the arc in GALEX NUV data; inset (c) shows a section of the arc that was observed in Hα as part of the MDW Hydrogen-Alpha
Sky Survey in 2016 (Mittelman et al. 2019). The bright NUV feature below A.2 is an artifact in the GALEX data. Intensity scaling in all diagrams
is arbitrary. In general, brighter colors correspond to more intense regions in the FUV and NUV maps, while darker colors correspond to more
intense Hα. The three sections of this feature are labeled as A.1–A.3 interrupted by gaps in the GALEX coverage. The two additional insets in the
FUV maps along A.3 have an adapted color scale to optimize the visualization of the arcs.

If one three-degree-long arclet, centered at (l, b) = (131◦ ,+33◦.7)      observations (radio Loop III; Quigley & Haslam 1965), stud-
(the lowest arclet in A.3a in Fig. 1), is not considered, the stan-       ies of dust emission (north celestial loop/GS135+29+4)
dard deviation drops to σΘ = 0◦.18 or 0.6% of the angular radius.         (Meyerdierks et al. 1991), and 21 cm observations (intermediate
The individual arclets are even thinner, ranging from 0.3 to a            velocity arch/GS155+38−58, Kuntz & Danly 1996; plus addi-
few arcminutes. An extrapolation of this arc – the UMa circle –           tional Heiles shells, Heiles 1984). None of these shells, which
encircles a total area of 2681 square degrees (0.25π steradians),         are far less well delineated than the UMa arc, are clearly aligned
6.5% of the total sky and 27% of the sky above Galactic latitude          with the arc we observe. We also investigated the Effelsberg-
b = 32◦ . The angular size of this full region is comparable to           Bonn HI Survey (EBHIS; Winkel et al. 2016) and found no evi-
the largest angular size radio-continuum loops discovered in the          dence for a 21 cm counterpart to the Hα, or ultraviolet, emission.
1960s (Quigley & Haslam 1965). What distinguishes the UMa                 For visualization purposes we also present the UMa arc and cir-
arc compared to these other structures is (1) the thickness-to-           cle in Fig. C.2.
radius ratio, (2) the nearly perfect circular fit over 30 degrees of           The region within the UMa circle is well known for hav-
arc, and (3) the high Galactic latitude of the center.                    ing the lowest column densities of neutral hydrogen in the sky,
     Figure 2 shows the positions of the arclets and the UMa              including the “Lockman Hole” (Lockman et al. 1986), which
circle on a stereographic projection, overlaid on the total gas           lies 5◦.4 interior to the arc. This low column density region is
column density derived from Planck observations of thermal                part of a vertically extended, tilted low-density cavity identi-
dust emission (Planck Collaboration XI 2014). A visual search             fied as the “local chimney” (Welsh et al. 1999). The low column
of the GALEX mosaics identified three additional high-latitude            density and the large angular size of the UMa circle also make
arclets: two (feature B.1 and B.2, centered at (l, b) = (79◦ ,+52◦ ))     it a potentially important foreground for extragalactic and cos-
lie interior to the UMa circle; only one (feature C, centered at          mological studies, requiring a thorough characterization of the
(l, b) = (185◦ ,+53◦ )) lies outside this region (see also Fig. C.1).     interstellar emission interior and exterior to the arc.
Also overlaid in Fig. 2 are the locations of several previ-                    Locating the UMa arc along the line of sight is not triv-
ously claimed loops, shells, and arcs based on radio continuum            ial given the data in hand. The large angular size suggests its

L8, page 2 of 8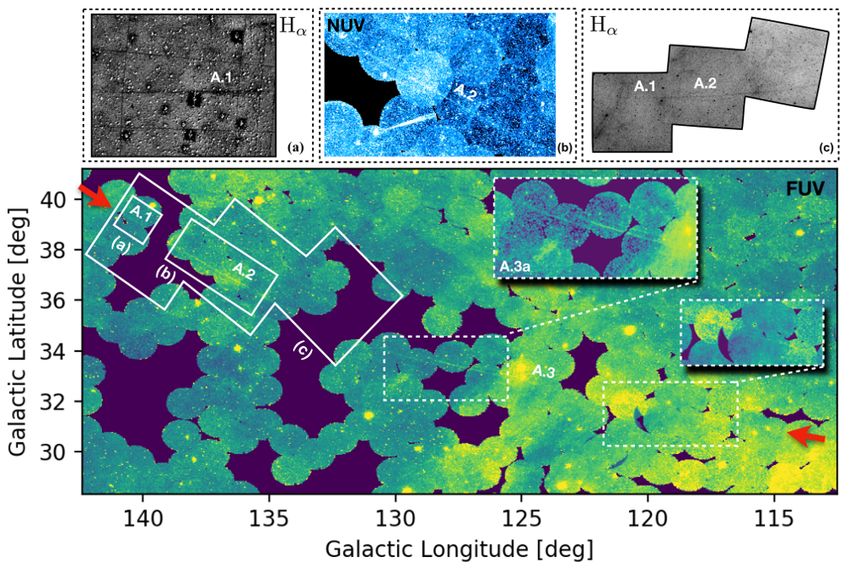
A. Bracco et al.: Discovery of a 30-degree-long ultraviolet arc in Ursa Major

Fig. 2. Stereographic projection of the total gas column density, NH , derived from Planck observations of dust thermal emission (color scale). The
locations of feature A, which defines the UMa arc, and features B and C are denoted. The UMa circle is shown in light gray. Left panel: positions
of the UMa IVC, Draco, and Spider clouds, along with the Ursa Major and Minor constellations (in pink). Two of the lowest column density
windows in the Galaxy (Lockman Hole (LH) and Groth strip (GS)) are shown. Right panel: positions of known arches and loops, in dark gray. The
transition between blue and red on the false-color intensity scale corresponds to NH = 1020 cm−2 .

proximity. The presence of three well-known interstellar clouds
that lie – in projection – within the UMa circle may be
also indicative: the UMa molecular intermediate-velocity cloud
(IVC), the Spider cloud, and the Draco molecular IVC, which
have distances of 356 ± 20 pc, 369 ± 22 pc, and 481 ± 50 pc,
respectively (Zucker et al. 2019). If the Draco cloud were physi-
cally inside the UMa arc, this would imply that the center of this
structure is more than 350 pc above the Galactic midplane with
a radius larger than 200 pc. Given all these caveats and the large
angular size of the structure, the UMa arc cannot be further than
a few hundred parsec from the Sun.

3. Ultraviolet emission of the UMa arc
In the following, we examine the source of the UV emission
from the UMa arc. Analyses of high latitude, diffuse ultravio-
let emission using both the Spectroscopy of Plasma Evolution
from Astrophysical Radiation (SPEAR/FIMS on the STSAT-1
Korean satellite) and GALEX have shown that FUV emission
is generally highly correlated with 100 µm dust emission – due
to dust scattering – and somewhat correlated with Hα intensity             Fig. 3. Comparison between the GALEX FUV data (top panel) and the
(Seon et al. 2011). Figure 3 shows the same section of feature             dust optical depth (τ850 µm , bottom panel), derived from the dust thermal
A in FUV (top panel) and in dust optical depth (bottom panel)              emission measured by Planck at 850 µm. Regions S.1 and S.2 are iden-
                                                                           tified in both FUV and dust emission, whereas features A.1 and A.2 are
as traced by the Planck observations at 850 µm. While areas of             only seen in FUV emission.
enhanced dust emission, S.1 and S.2, in the Planck image are
associated with an increase in FUV brightness, presumably due
to dust scattering, the UMa arc features, A.1 and A.2, are clearly         continuum emission from hydrogen, ion-atomic emission lines,
not associated with dust emission. This is also confirmed by the           such as C IV λ 154.8/155.1 nm, He II λ 164.0 nm, and O III] λ
average FUV/NUV ratio that we computed along the A.2 portion               166.2 nm, and fluorescent molecular hydrogen emission lines.
of the Arc. As detailed in Appendix A, we measured the ratio
using perpendicular profiles to the FUV and NUV filaments in
the GALEX maps and averaging them along their full length. We              4. UMa arc: A possible shock front
found a ratio of 0.31 ± 0.05, which is significantly smaller than
the values expected for dust scattering, mostly larger than unity          Ion lines are proxies of hot gas (with temperatures >104 K) likely
(Murthy et al. 2010).                                                      produced in the cooling zone of interstellar shocks with veloc-
    If not associated with dust scattering, other sources of dif-          ities larger than 50 km s−1 (Nishikida et al. 2006). Recombina-
fuse FUV emission must be considered including the two-photon              tion of the post-shock gas would produce two-photon emission
                                                                                                                                     L8, page 3 of 8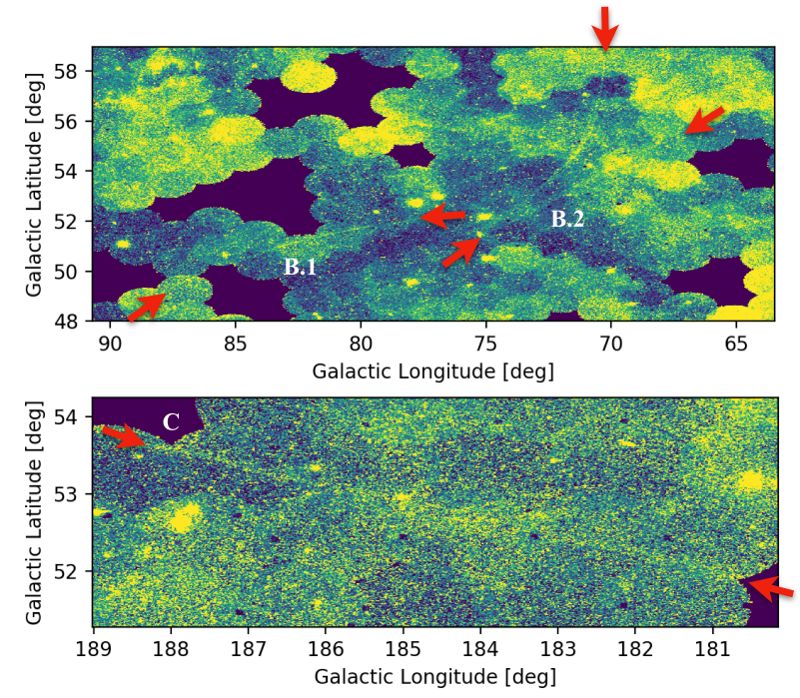
A&A 636, L8 (2020)

Fig. 4. Grid of models of radiative shocks from Sutherland & Dopita (2017) with varying magnetic-field strengths and shock velocities in a diffuse
medium with pre-shocked density of 0.1 cm−3 . Top row: FUV/NUV ratio from the models (left), line/continuum ratio in the GALEX FUV bandpass
(center, similar behaviors are found in the NUV case), Hα emission (right). The line-to-continuum ratio is centered around 0 so that blue (red)
colors correspond to larger (smaller) continuum emission compared to line emission. Bottom row: ion line to Hα ratios for OIII (left), SII (center),
and NII (right). In all six panels the black contours represent the 1σ level of the observed FUV/NUV of 0.31 ± 0.05.

contributing to the UV continuum as well. Radiative shocks are             simple model of blast wave evolution for a SNR (Draine 2011).
expected to be a key source of dissipation of kinetic energy               Under the assumption that the UMa arc is a section of a front
driven by supernova blast waves in the ISM, making supernova               centered on a point d100 = d/(100 pc) from the Sun and using a
remnants (SNRs) the most favorable scenario for the formation              standard explosion energy of ESN = 1051 ergs, the remnant will
of structures such as the UMa arc.                                         still be in the adiabatic phase – with shock speed greater than
     To test this idea we inspected GALEX FUV images of four               190 km s−1 – if the ambient density is nH,0 < (0.17 cm−3 )d100
                                                                                                                                        −2.38
                                                                                                                                              .
large angular-diameter (ΘR > 10◦ ) old SNRs: the Monogem Ring              Alternately, for an assumed ambient density of nH,0 = 1 cm−3 ,
(Plucinsky et al. 1996), Antlia SNR (McCullough et al. 2002),              the remnant would have transitioned to a pressure-modified,
G70.0−21.5 (Fesen et al. 2015) and G353−34 (Testori et al.                 momentum-conserving, snowplow1 phase with an age of tsnow =
2008). The first two objects have been the targets of low angu-                        3.5
                                                                           (0.7 Myr)d100   and a front speed that is approaching the random
lar resolution FUV spectroscopy with SPEAR/FIMS (Shinn et al.              ISM velocity.
2007). All four objects show networks of thin FUV filaments rem-                Assuming that the ambient density was sufficiently high to
iniscent of the UMa arc, but over a smaller solid angle of the sky;        trace a radiative front, we computed a series of shock mod-
two of these, Antlia SNR and G070.0−21.5, have also been shown             els from publicly available libraries (Sutherland & Dopita 2017)
to have similar Hα filaments. In Fig. C.3 we show the case of              with shock velocities between 50 km s−1 and 400 km s−1 , pre-
G070.0−21.5 in Hα, FUV, and dust emission.                                 shock interstellar magnetic-field strengths between 1 µG and
     The geometry of the arclets, the emission in the GALEX                10 µG, and mean diffuse gas density in the pre-shock medium
NUV and FUV channels, and the concomitant Hα are all con-                  of 0.1 cm−3 . These models allow us to predict the level of
sistent with the hypothesis that the UMa arc is a shock, or                emission – both lines and continuum – within the GALEX band-
pressure front, created by an explosion, yet unknown, toward               passes at the shock front that we can compare to the observed
(l, b) = (107◦.7,60◦.0). The thinness and multiplicity of the struc-       FUV/NUV ratio.
tures could be produced by the edge-on projection of corrugated                 As shown in the top row of Fig. 4, we identified two pos-
sheets in the front and post-shock recombination zones, simi-              sible domains that reproduce the observations delimited by
lar to what is seen in the Cygnus Loop SNR (Hummer & Storey                the 1σ contour of the measured FUV/NUV ratio. Shocks at
1987; Raymond et al. 1988). If this hypothesis was true then the           intermediate velocities (between 50 km s−1 and 100 km s−1 ) and
UMa arc could be associated with a corrugated edge on sheet of             at high velocity (>300 km s−1 ) are both consistent with the
the Loop III SNR (see Fig. 2).                                             measured value of 0.31 ± 0.05. These two regimes, however,
     With the caveat that the radius of curvature of an individ-
ual arc is not always the same as the radius of curvature of the           1
                                                                              In this phase the energy radiated behind the shock front is compara-
full remnant, we can compare the UMa arc to expectations of a              ble to the initial energy of the explosion.

L8, page 4 of 8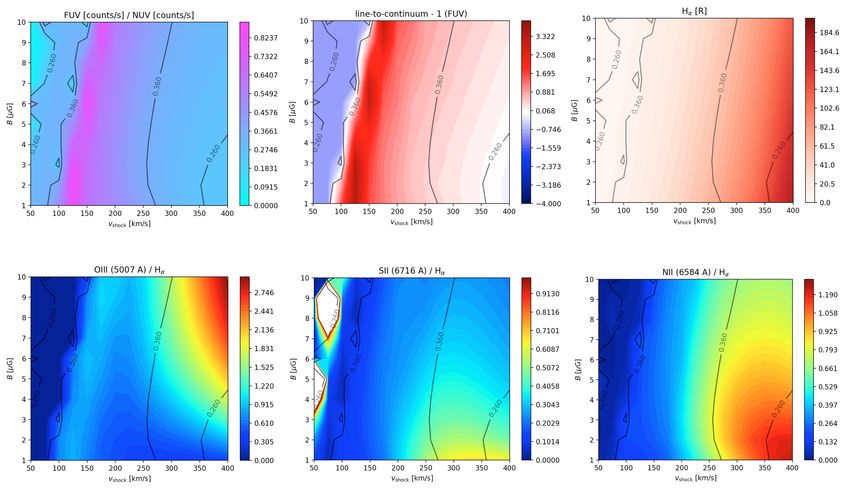
A. Bracco et al.: Discovery of a 30-degree-long ultraviolet arc in Ursa Major

show opposite line-to-continuum ratios, that is, show opposite              hard work and untimely passing of David Mittelman in 2017, who strongly
line-to-continuum ratios, that is, the two-photon continuum                 contributed to the realization of the MDW survey. We thank as well Bruce
emission only dominates over the ion-line contribution at inter-            Draine and Peter G. Martin for comments to the manuscript. A.B. acknowl-
                                                                            edges the support of the Agence Nationale de la Recherche (project BxB:
mediate velocities (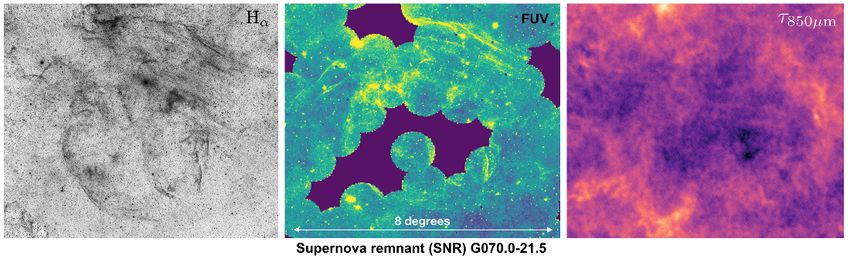
A&A 636, L8 (2020)

Appendix A: Measuring the FUV/NUV ratio from
  the GALEX data

Fig. A.1. Left panel: FUV (blue) and NUV (red) intensities, averaged over the whole length of A.2 (see Fig. 3), vs. position across the width
in arcmin. We show the average profiles, labeled hFUVi and hNUVi, and their corresponding errors. The hFUVi is scaled up for visualization
purposes; the best-fit profile is shown in green (see main text and right panel). Two vertical dashed lines delimit the borders of the A.2 filament
merging with the local background/foreground UV emission. Right panel: scatter plot and linear correlation between hFUVi and hNUVi. The
linear fit was computed only considering the data points (see orange circles) within the vertical dashed lines in the left panel. The intensity profile
obtained scaling the hNUVi with the best-fit parameters of the linear fit is shown in green on the left.

We computed the ratio of the FUV to NUV bands for the                        the data for the Case B recombination (Hummer & Storey 1987),
straightest/longest portion of the UMa arc (A.2 in Fig. 1) using             and [hνP2sν ] is the energy emitted per frequency interval for the
the mosaics of the GALEX All-Sky Survey that were delivered                  two-photon continuum. The recombination rate to the 2s level is
by the GALEX team to the Mikulski Archive for Space Tele-                    one-third of the total recombination rate, where we use a fit to the
scopes (MAST)2 .                                                             temperature dependence (Draine 2011): α(2s)Beff (T ) = (1/3)(2.59×
     In order to account for visible offset variations among the dif-        10−13 cm3 s−1 ) f 2s (T ), where f 2s (T ) = T −0.833−0.035 ln T4 and
ferent tessellations of the mosaic (see Fig. 1), we computed the             T 4 = T/104 K. We use an analytical fit to the spectral shape
FUV/NUV ratio by correlating average UV fluxes perpendicu-                   of
                                                                             h the itwo-photon continuum (Nussbaumer & Schmutz 1984):
lar to the main crest of A.2 (see Fig. A.1) labeled hFUVi and                 hνP2s   = hyA(y)/A2s→1s , where y = (ν/νLy α ) is the frequency
                                                                                  ν
hNUVi, respectively. With the caveat that offsets were uniform
within each tessellation, any miscalibration among the mosaics               scaled by the Lyman α frequency, A2s→1s = 8.2249 s−1 is the
would be captured by the intercept of the linear fit between                 Einstein A value for the two-photon decay, and
hNUVi and hFUVi, while the slope would correspond to the
                                                                             A(y) = C y(1 − y)(1 − (4y(1 − y))γ + α(y(1 − y))β (4y(1 − y))γ ) ,
                                                                                       h                                                        i
actual ratio between the two frequency bands.
     In the right panel of Fig. A.1 we show the linear fit and the                                                                                 (B.2)
corresponding slope of 0.31 ± 0.05 obtained for the pixels that
correspond to the position of A.2 (orange data points). As shown             with C = 202.0 s , α = 0.88, β = 1.53, and γ = 0.8. It is also
                                                                                                    −1

by the green profile in the left panel of the same figure, the linear        convenient to define the unitless function B(y) = A(y)/202.0 s−1 .
fit allows us to strikingly reproduce the observed hFUVi profile                 Taken together, for a constant density path length, L, with an
from the observed hNUVi.                                                     emission measure of EM = ne np L, theR two-photon continuum
                                                                             intensity per frequency interval, Iν2s,B = j2s,B
                                                                                                                         ν ds is written as

Appendix B: Theoretical estimate of the two-photon                           Iν2s,B (y, T, EM) = (3.45 × 10⁻²¹ ergs s−1 cm−2 sr−1 Hz−1 )
  emission                                                                                                        "
                                                                                                                     EM
                                                                                                                            #
                                                                                                 × f 2s (T )yB(y)                                  (B.3)
Below we calculate the expected GALEX count rate for two-                                                           cm−6 pc
photon emission, which is expected to produce a fixed ratio                      Similarly, the Case B recombination Hα intensity can be
of FUV to NUV emission (Spitzer & Greenstein 1951). For                      written as
two-photon emission, the Case B emissivity per unit frequency
(ergs s−1 cm−2 sr−1 Hz−1 ) is given by (Draine 2011)
                                                                                                                                        "         #
                                                                                                                                           EM
                                                                             I   Hα,B
                                                                                        (T, EM) = (8.71 × 10 ergs s cm sr ) f
                                                                                                          −8     −1   −2   −1   Hα
                                                                                                                                     (T )           ,
                                                                                                                                          cm−6 pc
                           1                  h      i
 jνB (2s → 1s) = jν2s,B =    ne np α(2s)B
                                    eff           ν ,
                                          (T ) hνP2s     (B.1)                                                                                     (B.4)
                          4π
where ne , np are the electron and proton densities, αeff
                                                      (2s)B
                                                            (T ) is          where f Hα (T ) = T 4−0.942−0.031 ln T4 . Expressed in Rayleighs
the total recombination to the hydrogen 2s level, where we use               (R), the Hα intensity is I Hα,B (T, EM) = (0.36 R) f Hα
2
  They can be found at https://archive.stsci.edu/prepds/
gcat/gcat_dataproducts.html with further documentation at
http://www.galex.caltech.edu/wiki/GCAT_Manual

L8, page 6 of 8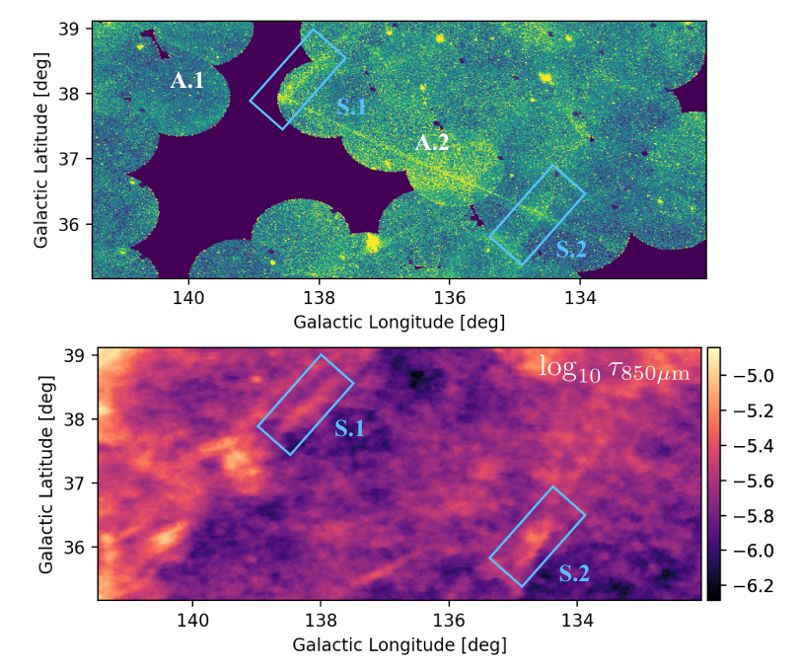
A. Bracco et al.: Discovery of a 30-degree-long ultraviolet arc in Ursa Major
(T ) [EM/cm−6 pc]. For T = 8000 K, this yields the oft-used con-
version that 1R corresponds to EM = 2.25 cm−6 pc.
In wavelength units, λÅ = λ/(1Å), where y = 1215/λÅ , the
two-photon continuum intensity is given by
Iλ2s,B (y, T, EM) = (1.04 × 10⁻² ergs s−1 cm−2 sr−1 Å−1 )
" #
EM
× f 2s (T )yB(y)λ−2
Å cm−6 pc
. (B.5)
To calculate the bandpass Rweighted continuum intensities,
Iband = T band (λ)Iλ2s,B dλ /
R
T band (λ)dλ we use the inten-
sity formula above together with the effective area curves,
T band (λ)3 . For an emission measure of EM = 1 cm−6 pc
at T = 8000 K, this yields Iband = 3.6 and 1.4 ×
10−10 ergs s−1 cm−2 Å−1 sr−1 for the FUV and NUV chan-
nels, respectively. Using the standard GALEX conversion
(Hamden et al. 2013) from energy units (ergs s−1 cm−2 Å−1 )
to count rate (counts s−1 ), and assuming a pixel size of
(12.88)2 arcsec2 yields a predicted GALEX count rate of Cband =
(0.98 and 2.61 × 10⁻³ counts s−1 pixel−1 ) [EM/cm−6 pc] for the
FUV and NUV channels, resulting in a predicted FUV/NUV Fig. C.1. Features B (top) and C (bottom) in a mosaicked image of
count ratio for two-photon continuum emission of 0.37. GALEX FUV data.
Appendix C: Supporting figures For comparison with the UMa arc, Fig. C.3 presents the SNR
In this appendix we show a series of figures to support the main G070.0-21.5 introduced in Sect. 4. It shows the SNR in Hα from
body of the paper. the MDW survey, in FUV from GALEX, and in dust optical
Figure C.1 shows features B and C introduced in Sect. 2. depth from Planck. As for the UMa arc, an intertwined network
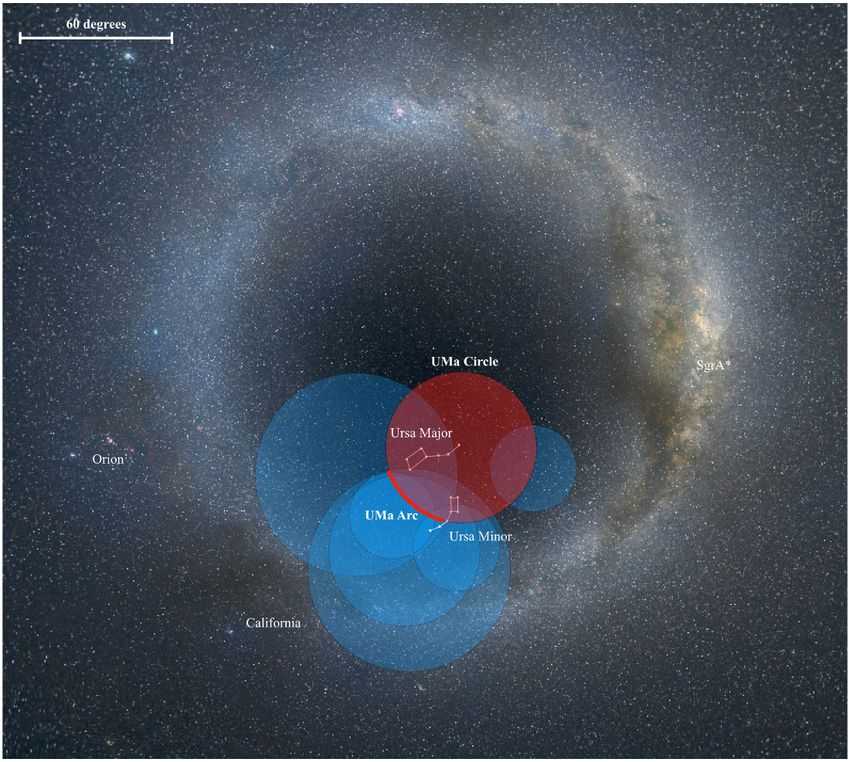
In Fig. C.2, for visualization purposes, we show a large-scale of filaments can be seen in Hα and FUV without any counterpart
stereographic projection of the UMa arc and circle (in red) on top in dust emission. This supports the interpretation of the ultravi-
of the Mellinger full-sky map (Mellinger 2009). The loops and olet emission from the UMa arc as the product of a process that
shells already presented in Fig. 2 are shown in light blue. is different than dust scattering in the diffuse ISM.
3
http://www.galex.caltech.edu/researcher/effective_area/
L8, page 7 of 8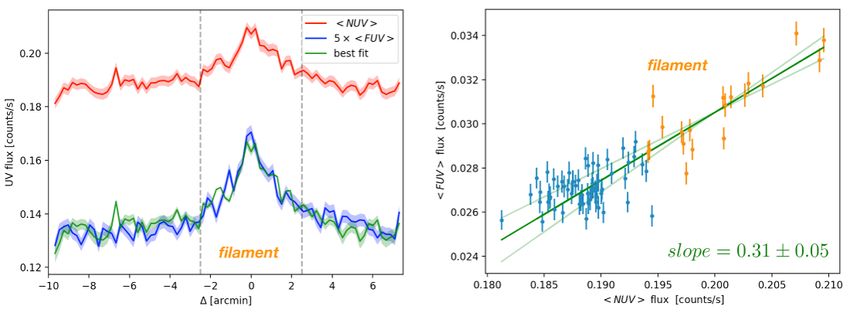
A&A 636, L8 (2020)

Fig. C.2. Large-scale stereographic overview of the UMa arc and circle (red) on top of the Mellinger full-sky map. We also show as reference the
positions of the loops and shells presented in Fig. 2 in light blue and some known constellations and the Galactic center (SgrA*).

Fig. C.3. Supernova remnant SNR G070.0-21.5 (see Sect. 4) in Hα from the MDW survey (left), in FUV from GALEX (center), and in dust optical
depth from Planck (right).

L8, page 8 of 8
You can also read