Linear Regression Algorithm Results for a PV Dual-Axis Tracking-Type System
←
→
Page content transcription
If your browser does not render page correctly, please read the page content below
International Journal of Electrical and Electronic Engineering & Telecommunications Vol. 10, No. 2, March 2021
Linear Regression Algorithm Results for a PV
Dual-Axis Tracking-Type System
Motlatsi C. Lehloka1, James A. Swart2, and Pierre E. Hertzog2
1
Department of Electrical and Mining Engineering, University of South Africa, Florida, Roodepoort, South Africa
2
Central University of Technology, Bloemfontein, South Africa
Email: lehlomc@unisa.ac.za; {aswart; phertzog}@cut.ac.za
Abstract—A photovoltaic (PV) module converts solar energy user interface is often used, and can be built in LabVIEW
into electrical energy. In order to increase the output power [4], where various parameters can be monitored and
of any PV module, several factors including tilt angle, managed, including the output power and alignment of a
orientation angle, load profile, environmental condition, PV module.
latitude of the location site, and energy management
techniques should be considered. It is essential to
The output power of a PV module is influenced by a
continuously deliver the highest possible power to a load for number of factors, including its installation (its alignment
a given day, which may be achieved by using a tracking-type to the sun), varying atmospheric conditions and abnormal
system as compared to a fixed-type system. The purpose of module degradation [5]. The installation can either be
this paper is to present the results of an algorithm that may fixed, or variable (tracking-type), where the PV module is
be applied to a dual-axis system located in an elevated constantly aligned to the direct beam radiation of the sun
plateau of the interior of South Africa in order to sustain a by using either a single-axis or dual-axis system.
high output power. Two identical 310W PV modules were Research has shown that tracking-type systems produce
used for a fixed-type and tracking-type system. The fixed- more power than fixed-type systems. One study showed
type system was installed at a tilt angle of Latitude minus
10° serving as a baseline to the tracking-type system. A
that a single-axis system can produce 13% more power
LabView user interface was developed to record and display than a fixed-axis system [6] while a dual-axis system can
the voltage and current measurements from the PV modules. produce 18% more power than a single-axis system. This
Results indicate that the dual-axis tracking-type system suggests that a dual-axis system can produce around 31%
extracted more power (on average 39.32% more power) as more power than a fixed-axis system, as noted by Akbar,
compared to the fixed-type system. A key recommendation Siddiq and Aziz [7] who did their study in Iraq. However,
is to use a linear regression algorithm with a tracking-type would this percentage improvement hold true for all dual-
system to enable a higher output energy yield for a given axis systems that experience varying atmospheric
day. conditions based on their location?
Index Terms—Photovoltaic, tilt angle, orientation angle, The purpose of this paper is to present the results of an
Latitude, LabVIEW 1 algorithm that may be applied to a dual-axis system
located in an elevated plateau of the interior of South
Africa in order to sustain a high output power. A
I. INTRODUCTION
theoretical overview of fixed-type and tracking-type
In a world of ever-increasing population and pollution, systems is firstly presented. Secondly, the experimental
there exists a demand for more energy. Different types of setup is outlined followed by the research methodology.
renewables, or green energy resources, exist, such as Subsequently the results are listed and analyzed. Lastly
hydropower, wind power, biomass and solar energy [1]. the conclusion completes the paper.
Economic growth depends heavily on the long-term
availability of energy that is affordable, accessible, and II. LITERATURE STUDY
environmentally sustainable. Research into renewable
Efficient operation of PV modules depends on many
energy has therefore included finding more efficient and
factors, including its installation [8]. The optimum
feasible methods to add to the existing energy supply [2].
installation for a fixed-type system involves placing a PV
This has included research into various energy
module at an orientation angle of 0˚ North (if in the
monitoring and management systems.
Southern Hemisphere) and changing the tilt angle to be
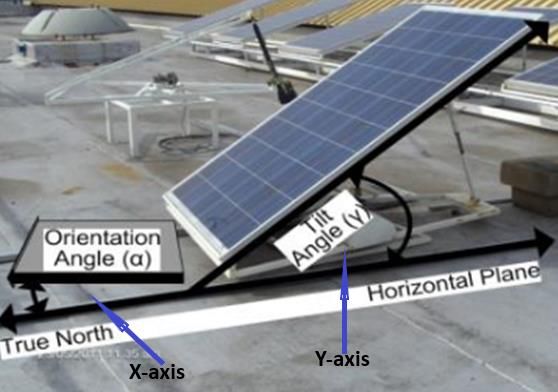
Monitoring and managing Photovoltaic (PV) module
close to the Latitude angle of the site. The orientation
performance facilitates preventive maintenance and fault
angle is defined as the angle between true South (or true
detection [3], that can lead to a higher sustained yield of
North) and the projection of the normal of the PV module
energy over a prolonged period of time. These
to the horizontal plane [9]. The tilt angle is defined as the
management systems often contain a hardware and
angle between the PV module surface and the horizontal
software section. Software that includes a customizable
plane. The tilt and orientation angles of a PV module are
Manuscript received June 20, 2020; revised September 2, 2020;
shown in Fig. 1. The angle of the sun differs between
accepted October 21, 2020. different hours of the day and the various seasons of the
Corresponding author: M. C. Lehloka (email: lehlomc@unisa.ac.za). year resulting in the introduction of solar tracking-type
©2021 Int. J. Elec. & Elecn. Eng. & Telcomm. 139
doi: 10.18178/ijeetc.10.2.139-144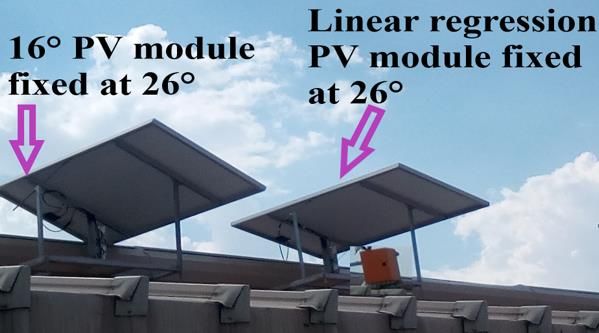
International Journal of Electrical and Electronic Engineering & Telecommunications Vol. 10, No. 2, March 2021
systems. A tracking-type system follows the sun's daily winter periods. Brief afternoon thunderstorms and rainfall
motion (from east to west), by constantly trying to ensure are common in summer whereas winters are crisp and dry,
a perpendicular direct beam radiation of the sun onto the with frost occurring in the southern areas. The wind
glass surface of the PV module. Solar tracking-type speed is generally light (4ms−1) except during
systems do consume energy during operation [10], as thunderstorms, and average evaporation rate ranges
either actuators or motors are used to change the between 109 and 246 mm month−1) [15].
alignment of the PV module to the direct beam radiation The second 310W PV module (a tracking-type system)
of the sun throughout the day. was controlled by a linear regression algorithm that was
However, they yield more energy that compensates for developed in LabVIEW. The development of this
the higher construction, operations and maintenance costs algorithm was published in 2018 [16]. The system block
[11]. Furthermore, its overall efficiency can also be diagram is illustrated in Fig. 2 while a photo of the
influenced by the type of control algorithm that is used to modules is shown in Fig. 3.
control the actuators or motors, which can include linear
regression [12].
Fig. 2. Block diagram of the system.
Fig. 1. Tilt and orientation angles of a PV module [9].
III. EXPERIMENTAL SETUP
The output characteristic of a PV system is nonlinear
and varies with ambient temperatures and solar irradiance Fig. 3. Experimental setup showing fixed 16°, linear regression
levels [13]. However, a linear regression algorithm can be algorithm PV modules and DAQ hardware box.
used as a way of fitting a straight-line model to observed
data [14]. The relationship between the independent The data logging interface circuit provides signal
variable X (time of day) and the dependent variable Y conditioning between the PV modules and specific data
(output voltage of the PV m module) can be modelled to acquisition (DAQ) equipment from National Instruments
enable a higher output power from a PV system. In this (NI). It was installed close to the PV modules and
research, two identical PV modules of 310W are used connected to a remote personal computer using a network
along with a logging interface circuit that links to a cable. The DAQ was also used with other PV modules
LabVIEW user interface. Polycrystalline modules that do not form part of this study. Voltage and current
(YL310P-35b) are used with a rated voltage of 36.3V, measurements from the PV modules were relayed to
open circuit voltage of 45.6V, rated current of 8.53A and LabVIEW where the output power is calculated, and the
a short circuit current of 8.99A. result visually displayed in graph form. The main
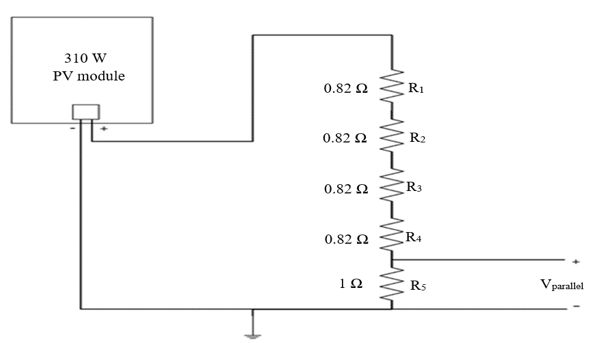
The logging interface circuit connects to a load function of the data logging interface circuit is to scale
comprising 5 resistors (4 by 0.82Ω resistors in series with down the output voltage of the PV module to a value less
a 1Ω resistor (100W)). One of the PV modules (a fixed- than 10V, being the maximum input voltage to the DAQ
type system) was set to an orientation angle of 0°North equipment.
and tilt angle of 16°. Previous research has suggested Fig. 4 illustrates the resistor configuration used in the
using the Latitude of the installation side, or then Latitude load (see Fig. 5 for a photo of them). These are high
+10° or Latitude 10° depending on the season of the power resistors that are chosen to satisfy the voltage
year [8]. This 16°is 10°less than the Latitude value of divider rule. An economic viable load for considering
the installation site of the Science Campus of the output power results from identical PV modules can
University of South Africa (UNISA). This campus lies on include the following [17]:
an elevated plateau of the interior of South Africa Batteries with a solar charger;
(Highveld) that is well-known for its spectacular Batteries with a maximum power point tracker
thunderstorms. The climate is subtropic with a high- (MPPTs);
altitude plateau of extensive grasslands located about Regulated and non-regulated light emitting diode
1700 m above sea level. The temperature ranges between (LED) lamps; and
15°C and 26°C in summer and between 4°C and 16°C in Fixed load resistors.
©2021 Int. J. Elec. & Elecn. Eng. & Telcomm. 140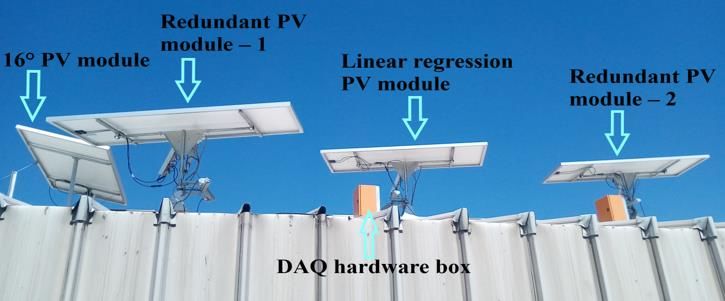
International Journal of Electrical and Electronic Engineering & Telecommunications Vol. 10, No. 2, March 2021
required no calibration adjustments to the system.
Subsequently, the two PV modules were then set back to
their respective positions (fixed-type and tracking-type
system) (see Fig. 7).
Fig. 4. Circuit diagram of the load resistance.
Fig. 6. Fixed-type and tracking-type systems fixed at a 26ºtilt angle.
Fig. 7. PV modules used in this study.
Fig. 5. System's load.
Using fixed load resistors is an effective and easy
method to start loading PV modules located outdoors for
measurement purposes. They can greatly reduce costs and
complexity; however, the disadvantage is that there is no
way to implement maximum power tracking (MPT).
Fixed load resistors in this study form a typical voltage
divider circuit, where five resistors are connected in
series across a source voltage. As the source voltage is
dropped in successive steps through the series resistors,
any desired portion of the source voltage may be “tapped
off” to supply individual voltage requirements [18]. The
voltage divider circuit provides signal conditioning, as
the maximum power point voltage of the PV module is
rated at 36.3V which is much higher than the allowed Fig. 8. LabVIEW front panel.
input voltage to the NI DAQ unit which is limited to 10V.
Using three 0.82Ω and 1Ω resistors (100W) in series V. RESULTS AND DISCUSSIONS
enables the input voltage to the NI DAQ to be less than This section provides results regarding the different
10V. output powers measured from the fixed-type and
tracking-type systems. Fig. 8 shows the LabVIEW user
IV. RESEARCH METHODOLOGY interface that was used to display voltage and current
This section describes the research methodology that readings.
was followed for this study. An experimental research The measured voltage and current values were used to
approach was used where one PV module was set to a calculate the output power (P = VI). It must be noted that
fixed position (Latitude minus 10° (16°)) and the other the readings for Panel 3 do not form part of this study.
one was used to track the sun throughout the day, using a The LabVIEW user interface provides the following
linear regression algorithm. The data was collected for a information:
period of six months (November 2018 to April 2019). Analog instantaneous value of voltage for each PV
The calibration of the systems was verified on 3 module (point A);
February 2019 between 12 noon and 1 pm. Both were set Analog instantaneous value of current for each PV
to the same orientation angle of 0° North and to a tilt module (point B);
angle of 26°(Latitude) (reference to Fig. 6). Voltage and Digital instantaneous value of voltage for each PV
current measurements were taken to observe if there was module (point C);
any significant difference between the two systems. Digital instantaneous value of current for each PV
Results showed no significant difference which then module (point D);
©2021 Int. J. Elec. & Elecn. Eng. & Telcomm. 141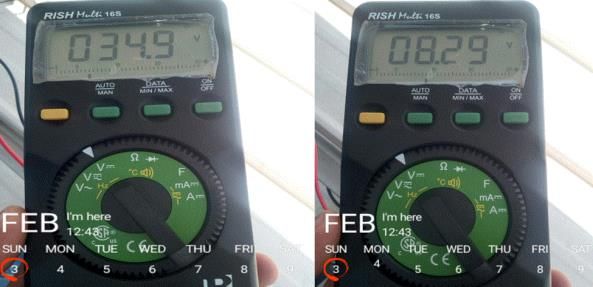
International Journal of Electrical and Electronic Engineering & Telecommunications Vol. 10, No. 2, March 2021
Execution date and time of the system (point E and The voltage measured for one day was utilized to plot
F); a graph as illustrated in Fig. 10 where the two PV
Manual start of the measuring system ignoring the modules (Panel l – fixed-type system and Panel 2 –
set system's start time (G); tracking-type system) were fixed at the same tilt and
Manual stop button function to control the while orientation angles (0°and 26°) for calibration purposes.
loop execution (point H); The PV modules behaved similarly throughout the day.
Voltage curve for each PV module (point I); and From 10 am to 15:00 pm the PV modules were aligned to
Current curve for each PV module (point J). the larger portion of the solar radiation which is normally
The readings highlighted in Fig. 9 show the physically maximum at 12 noon. The PV modules were producing
measured voltage of 34.9V and current of 8.29A on the the same output voltage which was nearly the maximum
digital multimeters taken on 3 February 2019 as part of rated voltage. The purpose of the calibration was to
the calibration process. These values correlated well with determine any invariability between the two systems.
the rated value of the PV module (rated voltage of 36.3V None existed, resulting in a valid setup where subsequent
and rated current of 8.53A) and with those shown on the measurements or results were reliable.
LabVIEW user interface as shown in Table I, which also Table II lists the daily average hourly power and the
presents the percentage difference between the digital total hourly power for the tracking-type (Panel 2) and the
multimeter and LabVIEW readings. The highest error fixed-type system (Panel 1). Panel 2 extracted power
percentage for voltage occurred for the fixed-type system from the sun by tracking it in both axes (dual axis) while
PV module (being 0.57%). Identical PV systems can be Panel 1 extracted power fixed at tilt angle of 16°. The
calibrated to produce the same results, with variability of percentage difference (41 %) is evident at the bottom of
less than 1% being excellent [4]. A consistent percentage the table. This suggests that Panel 2 extracted 41 % more
(0.24%) error was also determined between the energy than Panel 1 for this specific day in the summer
multimeter and LabVIEW user interface. No adjustment season. The table was also used to plot a graph as
to the calibration settings of the system were thus illustrated in Fig. 11, where one day (1 December 2018)
required. All subsequent measurements were thus deemed of instantaneous power (in watts - W) for both fixed-type
valid and reliable. and tracking-type systems is shown. It is evident that the
tracking-type system performed better than the fixed-type
system from 6 am to 10:00 am and from 3 pm to 6:00 pm.
However, from 11 am to 2 pm, the PV modules produced
constant output voltage which was nearly maximum. This
was due to the fact that the PV modules were aligned to
the larger portion of the solar radiation which is normally
maximum at 12 noon.
TABLE II: FIXED-TYPE (PANEL 1) AND TRACKING-TYPE (PANEL 2) PV
MODULES AVERAGE HOURLY POWER READINGS (W) AND THE TOTAL
WH FOR 1 DECEMBER 2018
Fig. 9. Rish multi 16S True RMS multimeter Time Panel 2 Panel 1
6AM-7AM 171,76 4,78
TABLE I: CALIBRATION RESULTS 7AM-8AM 262,22 39,8
8AM-9AM 254,96 127,04
Multimete
Multimete
percentag
percentag
r Current
r Voltage
LabVIE
Current
Current
LabVIE
Systems
Voltage
Voltage
9AM-10AM 256,64 233,28
Error
Error
e (%)
e (%)
(A)
(A)
(V)
(V)
W
W
10AM-11AM 271,21 271,23
11AM-12PM 274,41 274,81
12PM-13PM 289,74 291,14
Fixe-type 13PM-14PM 282,3 279,65
system 8,27 8,29 0,24 34,7 34,9 0,57 14PM-15PM 269,79 269,69
Tracking- 15PM-16PM 253,02 187,05
type 16PM-17PM 234,47 91,39
system 8,27 8,29 0,24 34,4 34,5 0,29 17PM-18PM 112,15 14,93
Total Wh for the day 2942,67 2084,79
Percentage difference 41%
Fig. 10. Two PV modules fixed at 0°orientation and 26°tilt angles for Fig. 11. Fixed-type (Panel 1) and tracking-type (Panel 2) PV modules
calibration purposes. average daily power output.
©2021 Int. J. Elec. & Elecn. Eng. & Telcomm. 142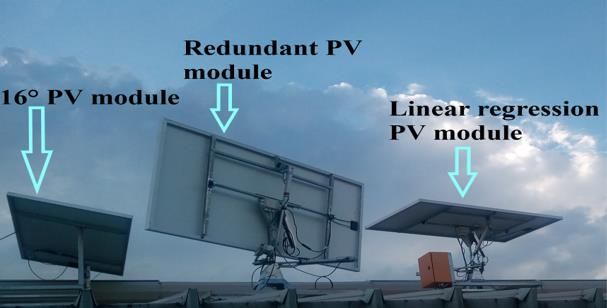
International Journal of Electrical and Electronic Engineering & Telecommunications Vol. 10, No. 2, March 2021

       TABLE III: TRACKING-TYPE AND FIXED-TYPE MODULES                           This South African study revealed an average output
        INSTANTANEOUS POWER READINGS FOR SIX MONTHS
                                                                             power improvement of 39.32% over a 6-month period.
                Time                  Panel 2          Panel 1               The main results indicated that Panel 2 (tracking-type
              Nov-18                  6277,87          4727,85
                                                                             system) outperformed Panel 1 (fixed-type system) by
              Dec-18                  8254,22          5849,14
               Jan-19                 6780,27          4822,38               41% for 1 December 2018 and by 39.32% in a six-month
               Feb-19                 6035,62          4280,27               period.
              Mar-19                  4262,09          3022,07                   The reliability and validity of these results was
               Apr-19                 1630,26          1156,51               established by having the two PV module set to the same
      Total 6 Months Ave. Wh         33240,33         23858,22               tilt angle for one day. A variability of less than 1 %
                                                                             between their respective output powers was established
                                                                             indicating a higher level of similarity between the
                                                                             performances of the two modules.
                                                                                 It is important to state that possible limitations of this
                                                                             study include the fact that only one research installation
                                                                             site was used, and that data has not yet been collected for
                                                                             a whole year. It is vital to obtain results for a whole year
                                                                             as varying environmental conditions always exist. Based
                                                                             on the results of this study, it is recommended to use a
                                                                             linear regression algorithm for dual-axis tracking-type
                                                                             systems, as it performs well in perpendicularly aligning
                                                                             the glass surface of a PV module to the direct beam
       Fig. 12. The tracking-type (panel 2) and fixed-type (panel 1)         radiation of the sun throughout the day.
                 system's output power for 6-months.

   Table III lists the results of the instantaneous average                                        CONFLICT OF INTEREST
power for a period of six months, being November,
                                                                                   The authors declare no conflict of interest.
December 2018, January, February, March and April
2019 for both systems. These results were used to plot a
graph as illustrated in Fig. 12. The total average Wh is                                          AUTHOR CONTRIBUTIONS
listed at the bottom of the table.                                              Mr. Lehloka conducted the research as part of his
   It is evident from Fig. 12 that the tracking-type system                  postgraduate study; Prof Swart provided guidance on
outperformed the fixed-type system for the whole six                         structuring the paper and edited it; Prof Hertzog provided
months with an average difference of 39.32 %. Dual-axis                      review comments and edited specific sections of the
tracking-type systems usually produce more than 30 %                         paper; all authors had approved the final version.
output power as compared to a fixed-type system [7] The
power output was high in the months of November and                                                  ACKNOWLEDGMENT
December 2018. However, the results show that from the
month of January to the month of April 2019 the output                         The author wishes to acknowledge both the Central
power started decreasing due to the seasonal change in                       University of Technology and the University of South
South Africa. The solar radiation curve is higher between                    Africa for their financial support.
November and February (its peak being in December)
and starts declining from February to May reaching its                                                    REFERENCES
lowest point in June in South Africa [19].                                   [1]    L. Mez, “Energiewende in Germany–the dawn of a new energy
                                                                                    era,” in Ecological Modernization Capacity of Japan and
                                                                                    Germany. Energiepolitik und Klimaschutz. Energy Policy and
                     VI. CONCLUSION
                                                                                    Climate Protection, L. Mez, L. Okamura, and H. Weidner, Eds.,
   The purpose of this paper was to present the results of                          Wiesbaden: Springer, 2020, pp. 53-67.
an algorithm that may be applied to a dual-axis system                       [2]    W. Batayneh, A. Bataineh, I. Soliman, and S. A. Hafees,
                                                                                    “Investigation of a single-axis discrete solar tracking system for
located in an elevated plateau of the interior of South                             reduced actuations and maximum energy collection,” Automation
Africa in order to sustain a high output power. A fixed-                            in Construction, vol. 98, no. 2019, pp. 102-109, 2019.
type system, set at a tilt angle of Latitude minus 10°                       [3]    A. Ahrary, M. Inada, and Y. Yamashita, “Solar power monitoring
(Panel 1), served as a baseline to a tracking-type system                           system ‘SunMieru’,” in Intelligent Decision Technologies 2017.
(Panel 2). The PV modules were installed at the Science                             IDT 2017. Smart Innovation, Systems and Technologies, I.
                                                                                    Czarnowski, R. Howlett, and L. Jain, Eds., Cham: Springer, 2017,
Campus of UNISA that is characterized as having a                                   pp. 216-224.
subtropic climate, located on a high-altitude plateau of                     [4]    A. J. Swart and P. E. Hertzog, “Regularly calibrating an energy
extensive grasslands about 1700 m above sea level. Its                              monitoring system ensures accuracy,” WEENTECH Proceedings
climate differs significantly from Iraq, where another                              in Energy, vol. 4, no. 2, 2019, pp. 37-45, 2019.
study also contrasted a dual-axis tracking-type system to                    [5]    A. J. Swart and P. E. Hertzog, “Evaluating the performance of
a fixed-type system [7]. That Iraq study was conducted                              small-scale PV modules in a semi-arid area to identify any
                                                                                    anomalies,” Indian Journal of Science and Technology, vol. 12, no.
for only one month and revealed a maximum output                                    28, pp. 1-9, 2019.
power improvement of 30% for their tracking-type                             [6]    S. Seme, A. Krawczyk, E. Ł. Tondyra, B. Štumberger, and M.
system that used a microcontroller.                                                 Hadžiselimović, “The efficiency of different orientations of

©2021 Int. J. Elec. & Elecn. Eng. & Telcomm.                           143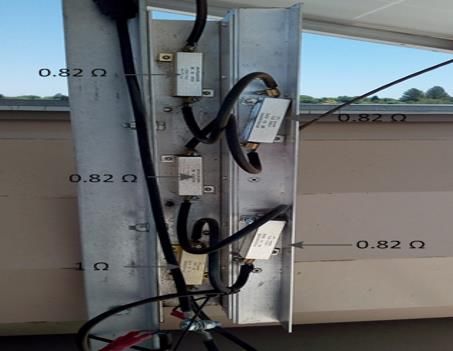
International Journal of Electrical and Electronic Engineering & Telecommunications Vol. 10, No. 2, March 2021

       photovoltaic systems,” Przegląd Elektrotechniczny, vol. 93, no. 1,         [18] N. X. Tien and S. Shin, “A novel concentrator photovoltaic (CPV)
       pp. 201-204, 2017.                                                              system with the improvement of irradiance uniformity and the
[7]    H. S. Akbar, A. I. Siddiq, and M. W. Aziz, “Microcontroller based               capturing of diffuse solar radiation,” Applied Sciences, vol. 6, no.
       dual axis sun tracking system for maximum solar energy                          9, pp. 1-8, 2016.
       generation,” American Journal of Energy Research, vol. 5, no. 1,           [19] P. E. Hertzog and A. J. Swart, “Optimum tilt angles for PV
       pp. 23-27, 2017.                                                                modules in a semi-arid region of the southern hemisphere,”
[8]    A. J. Swart and P. E. Hertzog, “Evaluating multiple tilt angles                 International Journal of Engineering & Technology, vol. 7, no.
       using an innovative jig with a singular PV module,” International               4.15, pp. 290-297, 2018.
       Journal of Engineering and Advanced Technology, vol. 8, no. 3,
       pp. 289-294, 2019.                                                         Copyright © 2021 by the authors. This is an open access article
[9]    A. J. Swart and P. E. Hertzog, “Varying percentages of full                distributed under the Creative Commons Attribution License (CC BY-
       uniform shading of a PV module in a controlled environment                 NC-ND 4.0), which permits use, distribution and reproduction in any
       yields linear power reduction,” Journal of Energy in Southern              medium, provided that the article is properly cited, the use is non-
       Africa, vol. 27, no. 3, pp. 28-38, 2016.                                   commercial and no modifications or adaptations are made.
[10]   S. Ahmad, S. Shafie, and M. Z. A. A. Kadir, “Power feasibility of
       a low power consumption solar tracker,” Procedia Environmental                                       Mr Motlatsi Cletus Lehloka Author's profile:
       Sciences, vol. 17, no. 2013, pp. 494-502, 2013.                                                      Junior lecturer, University of South Africa,
[11]   A. K. Bhagat and M. Chattopadhyay, “An analysis of economic                                          MEng student, Central University of
       benefits of solar tracking systems,” International Journal for                                       Technology.
       Innovative Research in Science & Technology, vol. 3, no. 7, pp.
       48-51, 2016.
[12]   C. T. Clack, “Modeling solar irradiance and solar PV power
       output to create a resource assessment using linear multiple
       multivariate regression,” Journal of Applied Meteorology and
       Climatology, vol. 56, no. 1, pp. 109-125, 2017.
[13]   A. Mahdi, W. Tang, Q. Wu, and A. Mahdi, “Improvement of a                                            Prof Arthur James Swart James worked for
       MPPT algorithm for PV systems and its experimental validation,”                                      Telkom SA and De Beers Namaqualand
       presented at the International Conference on Renewable Energies                                      Mines for 4 years and then joined the Vaal
       and Power Quality, Granada, Spain, 2010.                                                             University of Technology in 1995 and
[14]   Y. Kwon, “Predicting solar max dc power using a linear                                               progressed from a technician to a senior
       regression model,” M.Sc. thesis, The University of Texas at                                          lecturer in 2007. He completed a MEd in 2007
       Austin, 2012.                                                                                        and a DTech in 2011. James loves teaching
[15]   R. Olobatoke and M. Mathuthu, “Heavy metal concentration in                                          and has a keen passion for research. One of
       soil in the tailing dam vicinity of an old gold mine in                                              his mottos relates to life-long learning and
       Johannesburg, South Africa,” Canadian Journal of Soil Science,                                       states “Live to Learn and you will Learn to
       vol. 96, no. 3, pp. 299-304, 2016.                                                                   Live”.
[16]   M. C. Lehloka, A. J. Swart, and P. E. Hertzog, “A comparison of
       two automatic solar tracking algorithms,” presented at Int. Conf.                                    Prof Pierre Eduard Hertzog Pierre received
       on Power, Energy and Electrical Engineering, London, UK, 2019.                                       his D.Tech. degree in 2004 from the Central
                                                                                                            University of Technology. His research
[17]   A. J. Swart and P. E. Hertzog, “Verifying an economic viable load                                    interests include engineering education and
       for experimental purposes relating to small scale PV modules,”                                       alternative energy. He is currently an
       presented at the SATNAC 2016, Fancourt, George, Western Cape,                                        Associate Professor at the Central University
       2016.                                                                                                of Technology.

©2021 Int. J. Elec. & Elecn. Eng. & Telcomm.                                144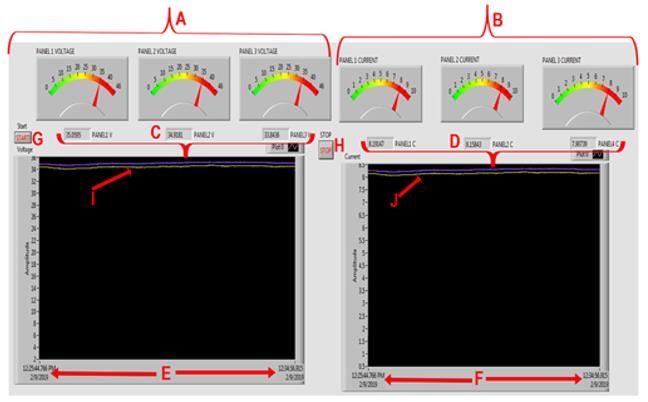


You can also read