Power Flow Analysis Using Graph based Combination of Iterative Methods and Vertex Contraction Approach - arXiv
←
→
Page content transcription
If your browser does not render page correctly, please read the page content below
2018 International Conference on Power System Technology (POWERCON 2018)                       Guangzhou, 6-8 Nov. 2018

            Power Flow Analysis Using Graph based
           Combination of Iterative Methods and Vertex
                     Contraction Approach
         Chen Yuan, Member, IEEE, Guangyi Liu, Senior Member, IEEE, Renchang Dai, Senior Member, IEEE,
                                                 Zhiwei Wang

                                                                           and making power systems more complicated and
   Abstract—Compared with relational database (RDB), graph                 unpredictable with frequent fluctuations and intermittence. So,
database (GDB) is a more intuitive expression of the real world.           the operating conditions should consider the addition of
Each node in the GDB is a both storage and logic unit. Since it is         renewable energy, distributed generation, and energy storage at
connected to its neighboring nodes through edges, and its
neighboring information could be easily obtained in one-step
                                                                           the transmission and distribution levels, as well as load demand
graph traversal. It is able to conduct local computation                   changing characteristics.
independently and all nodes can do their local work in parallel.              The transition from conventional power grids to modern
Then the whole system can be maximally analyzed and assessed in            power grids has been accelerated by public and private
parallel to largely improve the computation performance without            investments. As presented in Fig. 1, California ISO depicted
sacrificing the precision of final results. This paper firstly             California netload curves ranging from 2012 to 2020 and each
introduces graph database, power system graph modeling and
potential graph computing applications in power systems. Two
                                                                           curve represents a day in the month of March [1]. The “duck
iterative methods based on graph database and PageRank are                 curve” illustrates the emerging conditions, including short,
presented and their convergence are discussed. Vertex                      steep ramps and over-generation risk. At each timepoint,
contraction is proposed to improve the performance by                      netload equals to the value of load demand minus renewable
eliminating zero-impedance branch. A combination of the two                generation. From this figure, it clearly shows that, from 2012 to
iterative methods is proposed to make use of their advantages.             2020, since the increasing integrations of solar energy and the
Testing results based on a provincial 1425-bus system
demonstrate that the proposed comprehensive approach is a good
                                                                           plentiful solar irradiation in the daytime in the state of
candidate for power flow analysis.                                         California, the netload curve largely dips in the midday.
                                                                           However, during the period of sunset, which is also the
   Index Terms— Graph database, high-performance computing,                after-hours in the early evening, solar generation decreases and
iterative method, power flow, vertex contraction.                          the energy demand spikes. It results in a rapid ramp in the
                                                                           “duck curve”, as shown in Fig. 1, approximate 13,000 MW
                                                                           netload increment in three hours, and requires increased system
                         I. INTRODUCTION

P     OWER flow plays the fundamental and critical role in the
    power system analysis. It acts as the basic function for most
of applications in power system Energy Management Systems
(EMS), like state estimation, security constrained unit
commitment, system security assessment, “N-1” contingency
analysis and transient stability. In modern power grids, high
penetrations of renewable energy resources, distributed
generators, power electronic devices, energy storage system,
community microgrids and HVDC transmission are inevitable

   This work was supported by State Grid Corporation technology project
SGRIJSKJ(2016)800.
   C. Yuan, G. Liu, R. Dai, and Z. Wang are with the Global Energy
Interconnection Research Institute North America (chen.yuan@geirina.net,
                                                                            Fig. 1 California ISO projected electricity supply
guangyi.liu@geirina.net, renchang.dai@geirina.net).

POWERCON2018                                                    Paper No xxx                                                        Page 1/8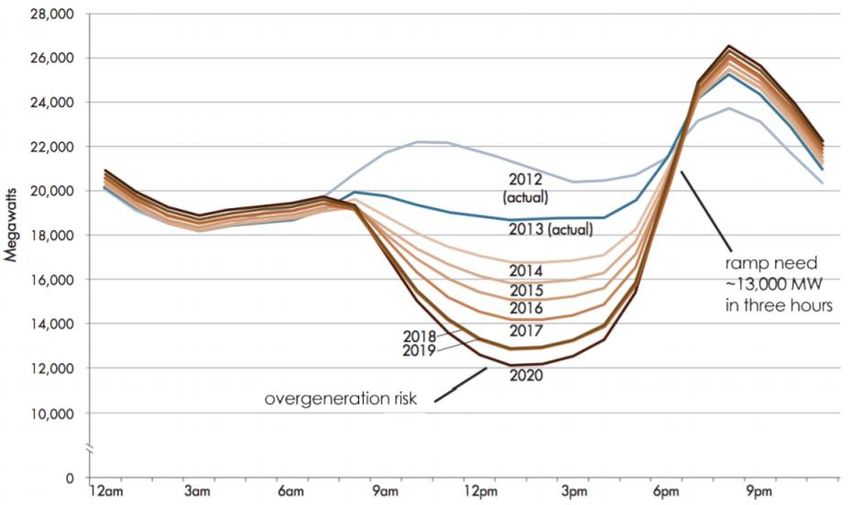
2018 International Conference on Power System Technology (POWERCON 2018) Guangzhou, 6-8 Nov. 2018
flexibility to meet challenges with such steep netload ramps, which is capable of independently and locally conducting its
over-generation risks, reliability issues [2], and even computation. This is because each node could easily acquire its
unexpected contingencies [3], [4]. If using the commercial neighboring information via one-step graph traversal. This
EMS, although data could be sent from supervisory control and paper will first provide a brief introduction of GDB, power
data acquisition (SCADA) every 5 seconds, computation system graph modeling and graph computing applications in
analysis describing the system status and assessing possible power systems. The two selected iterative methods and vertex
contingencies can take minutes to hours. Therefore, operators contraction approach for processing zero-impedance branch are
can only monitor the system state and make decisions in presented using graph computing and then they are merged into
minutes. In a severe event, the power grid could transition to an a graph based hybrid method to make use of each algorithm’s
unstable state within seconds, making it extremely challenging advantages. The speed and accuracy performance of the
for operators to respond without feasible decision support and proposed method is tested and well-demonstrated with a
planning analysis based on fast state estimation and power flow provincial system, FJ-1425 system.
analysis. This paper is organized as follows: graph database and graph
A fast, even faster than real-time, computing algorithm for computing will be briefly introduced in Section II, including its
quickly and efficiently estimating system states and solving applications in power systems. Then the proposed algorithm for
power flow has a profound influence on EMS performance. power flow analysis using graph database is well elaborated in
Parallel computing is one of promising methods to improve Section III. Section IV verifies the proposed algorithm
computation efficiency. However, the state of art of power flow accuracy using two practical systems and demonstrates its high
analysis does not effectively make use of the parallel capability, computation performance. The potential application scenario
since the relational database and computation algorithm used for the proposed method will be discussed in Section V. At last,
for existing power flow analysis were not specifically designed the paper is concluded in Section V and future work is also
for parallel computing. With the fast development of presented in this section.
computing technology and graph theory based applications,
graph based high performance computation, graph computing, II. GRAPH DATABASE AND GRAPH COMPUTING
is a feasible option for high-performance parallel computing
A. Graph Database
[5], since it was developed to deal with distributed storage and
parallel computing in big data analysis, and applicable to solve Graph is a data structure modeling pairwise relations
complicated scenarios with iterations [6]. between objects in a network. In mathematics, a graph is
Commercial EMS mostly use the fast-decoupled method and represented as G=(V, E), in which V is a set of vertices,
Newton-Raphson method to do power flow analysis, because of representing objects in the depicted system, and the set of edges
its good convergence-rate. The algorithm uses a in the graph is denoted as E, expressing how these vertices
two-dimensional sparse matrix, admittance matrix, to represent relate to each other. Each edge is denoted by e=(i, j) in E, where
the system topology. Algorithms for transmission system we refer to i and j in V as head and tail of the edge e,
power flow analysis, including technologies of sparse matrix respectively.
[7], sparse vector [8] and node ordering [9], have been well In a GDB, each node is independent to others and capable of
studied. With the evolution of software systems and hardware conducting the local computation. GDB uses graph structures
configurations in parallel computing, the external conditions of for semantic queries to represent and store data in vertices and
the power flow analysis in large-scale systems become mature. edges. Data in the GDB store are directly linked together and
Reference [10] used distributed computation technology to easily retrieved in one graph operation. So, compared with
implement parallel computation of power flow. Besides, GPU relational database (RDB), which is based on the relational
based parallel computing was introduced and applied to power model to store data, GDB permits data management in its
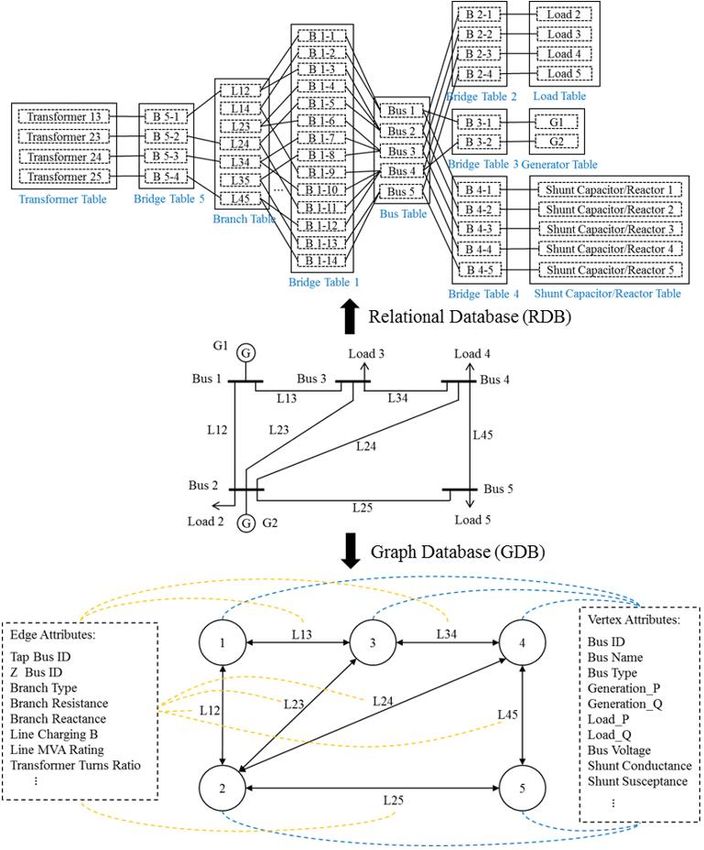
flow calculation [11], [12]. On the other hand, our previous intuitive structure. Fig. 2 presents a data storage comparison
research works have investigated the feasibility and the high between relational database and graph database using the IEEE
performance of graph database in power system energy 5-bus system. RDB needs redundant storage to store common
management systems (EMS) applications, like CIM/E based attributes in bridge tables to provide JOIN functions. Besides,
network topology processing, power grid modeling, state the data query is complicated through JOIN operations and the
estimation, “N-1” contingency analysis, and security time cost exponentially increases with the increase of the data
constrained economic dispatch [13]–[17]. set size. However, GDB is a direct expression of a real system.
In this paper, a graph-based combination of iterative methods JOIN operation is no more needed, and data information are
and vertex contraction approach is proposed for power flow stored as attributes in corresponding nodes and edges. For
analysis. Graph is an intuitive way to represent the world. Each example, in Fig. 2, the 5-bus system keeps the same topology in
node in the graph database (GDB) is a storage and logic unit, its GDB and system information are respectively assigned to
vertices and edges. Then, the operations related to data query
POWERCON2018 Paper No xxx Page 2/8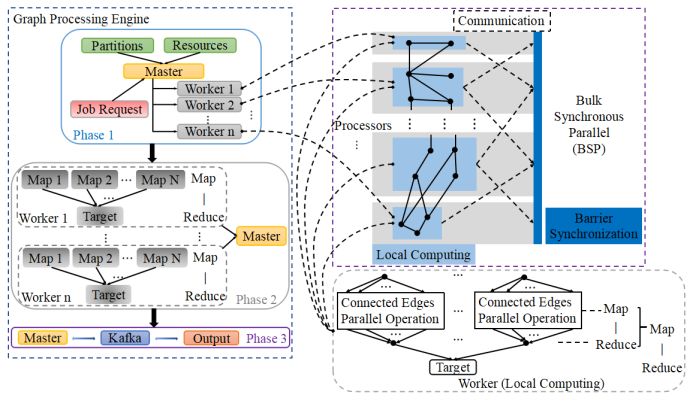
2018 International Conference on Power System Technology (POWERCON 2018)           Guangzhou, 6-8 Nov. 2018

                                                                      each bus, but also represents the topology structure of the
                                                                      power system. That is also a reason that the admittance matrix
                                                                      is very sparse. The admittance matrix is even more sparse when
                                                                      the system’s scale is larger. Furthermore, each diagonal
                                                                      element approximately equals the negative sum of off-diagonal
                                                                      elements in the corresponding row/column, and the small
                                                                      mismatch, if any, is caused by the shunt admittance and the
                                                                      transformer turns ratio. In other words, the sum of each
                                                                      row/column is close to zero, or exactly zero if no shunt
                                                                      admittance and no transformer exists. In the mathematical field
                                                                      of graph theory, the Laplacian matrix, also called admittance
                                                                      matrix, is a matrix representation of a graph. It is equal to the
Figure 3. MapReduce and BSP inside graph processing engine            graph’s degree matrix minus the adjacency matrix. For an
                                                                      undirected graph, which is applicable to power systems, the
                                                                      Laplacian matrix is symmetrical, and the summation of
                                                                      elements in each row/column is zero. So, the power system and
                                                                      the undirected graph are closely mapping to each other,
                                                                      indicating the feasible applications of GDB into power systems.
                                                                      C. Node-based Parallel Graph Computing and Its
                                                                      Applications in Power System Analysis
                                                                         1) Node-Based Parallel Computing: In graph computing,
                                                                      each node is independent to others and capable of conducting
                                                                      the local computation. In the mode of all-node-synchronization,
                                                                      nodes are all activated at the same time. Then the node-based
                                                                      graph operation is implemented in parallel to save computation
Fig. 2. Comparison between RDB and GDB in power systems modeling
                                                                      time and improve the computation efficiency. This paper
are becoming more convenient via graph operations. On the             proposes to employ graph computing for power flow analysis.
other hand, a testing on an open-source GDB management                Take the admittance matrix as an example, off-diagonal
                                                                      elements are locally and independently calculated based on the
system, Neo4j, against a widely used RDB management
                                                                      admittance attributes of the corresponding edges, and each
system, MySQL, shows that the overall performance of data
                                                                      diagonal element is calculated by summing the admittance
search in Neo4j is much better than MySQL [18].                       attributes of the node and its connected edges. So, the
B. Power System Graph Modeling                                        admittance matrix can be formulated in parallel using one graph
  In this section, this paper explores and demonstrates the           operation. Other examples of node-based parallel computation
                                                                      in power flow analysis are power injection update, system
GDB modeling in power systems. An example of mapping
                                                                      states mismatch, convergence check, branch power flow
between graph and power system is presented in Fig. 3. A 6-bus
                                                                      calculation, etc.
power system is converted to a graph with the same structure,
                                                                         2) MapReduce and Bulk Synchronous Parallel:
containing 6 vertices and 7 undirected edges. For a n-bus power       MapReduce and bulk synchronous parallel (BSP) are two
system, its admittance matrix is a n×n symmetrical matrix. It         major parallel computation models. BSP is a bridging model to
not only stores the nodal admittance and line admittance of           design parallel algorithms. It contains components who are
                                                                      capable of local memory transactions, a network that
                                                                      communicates messages between components, and a facility
                                                                      allows for synchronization. As shown in Fig. 4, within the
                                                                      graph processing engine (GPE), the master processor assigns
                                                                      tasks to worker processors per the CPU resources, data
                                                                      partitions and job request. Each worker focuses on its local
                                                                      computation, communicates with other workers, and outputs
                                                                      results to barrier synchronization. The whole process is
                                                                      implemented in BSP. For each worker, it employs MapReduce
                                                                      scheme to do local logic and algebraic operation in parallel.
                                                                      MapReduce is a framework of processing massive datasets in
Fig. 3. Mapping between graph and power system
                                                                      form of  pairs and plays a prominent role in

POWERCON2018                                                  Paper No xxx                                               Page 3/8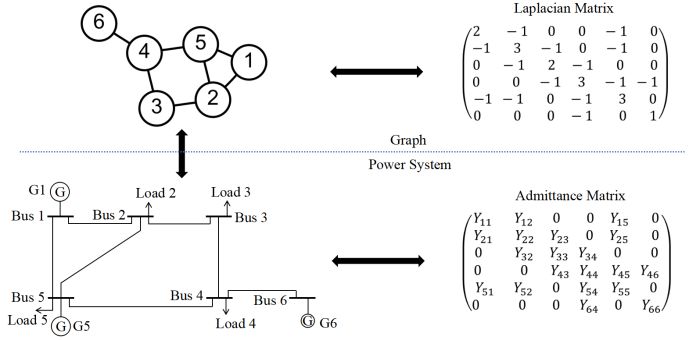
2018 International Conference on Power System Technology (POWERCON 2018) Guangzhou, 6-8 Nov. 2018
where d is the damping factor, generally around 0.85, BP is the i
set of pages linked to pi, L( p j ; t ) is the number of out links on
page pi, and N is the number of pages.
In equation (1), two features of PageRank algorithm are
presented: (a) the PageRank of each page is only determined by
its neighboring PageRank and the number of its out links; (b)
during each iteration, the PageRank computation for each page
only uses the values obtained from the previous iteration. The
former reveals that each page’s PageRank can be locally
calculated, and the second characteristic indicates that the
PageRank algorithm can be implemented in parallel. Based on
the description of graph computing, node-based parallel
Fig. 4. MapReduce and BSP inside graph processing engine computing is applicable to PageRank.
2) Jacobi Method for Power Flow Analysis Using Graph
parallel computing. It includes two phases, map phase, Computing: The power flow equations are in (2). Using Jacobi
performing local data processing in parallel, and reduce phase, method, the power flow iteration is shown in (3), which is like
processing output data per key in parallel. Below is the the PageRank algorithm. The voltage at each node is
MapReduce programming mechanism in graph computing. determined by its neighboring voltages, the connected line
Using SELECT syntax, MapReduce processes are generated admittance, and its own information, like voltage magnitude,
for selected nodes. Each node’s MapReduce is processed in voltage angle, node admittance, power injection, etc. Besides,
parallel. Beginning from ACCUM syntax, map phase starts to in each iteration, its calculation is determined by system states
do edges operations for the corresponding node. In the calculated from last iteration. Therefore, the power flow
POST-ACCUM, reduce phase updates and aggregates results analysis is feasible in parallel computing. But the slow rate of
for each node. convergence is an issue, even though it takes little memory and
does not need to do matrix factorization and forward/backward
substitution.
MapReduce in Graph Computing
1. Initialize T0 = {all nodes};
Si* = Pi − jQi = Vi* j =1 (Yij V j )
n
2. T1 = SELECT s FROM T0: s-(edges:e) t
// Start MapReduce processes for selected nodes
1 Pi − jQi
− j =1 (Yij V j )
n
3. ACCUM → Vi = (2)
4. [edge operations] // map phase for each selected Yii Vi * j i
node
5. POST-ACCUM 1 Pi ( k ) − jQi ( k )
Vi ( k +1) = − j =1 (Yij V j ( k ) )
n
(3)
6. [vertex operations]; // reduce phase for each selected Yii V i( k )* j i
node
7. End; 3) Bi-Level PageRank Method Using Graph Computing:
To improve its convergence-rate, this paper employs two
III. GRAPH BASED COMBINATION OF ITERATIVE METHODS strategies: (a) using damping factor, like PageRank algorithm;
AND VERTEX CONTRACTION FOR POWER FLOW ANALYSIS (b) separating nodes into two levels, borrowing the idea from
Gauss-Seidel algorithm.
A. Bi-level PageRank Approach for Power Flow Analysis with With the addition of the damping factor, equation (3) is
Graph Computing developed into (4). Like the function in PageRank algorithm,
1) PageRank Using Graph Computing: PageRank is an damping factor is used to improve the convergence of power
algorithm, firstly used by Google Search, to rank websites by flow calculation. First, it could avoid a sink when
calculating the web page importance. Its equation is as follows, zero-impedance branch exists. Look at (3), if there is a
indicating the PageRank of page at time point of (t+1). zero-impedance branch connected to node i, the values of
j =1Y V and Yii are too large to reflect power changes in
n
ij j
j i
1− d PR( p j ; t )
PR( pi ; t + 1) = + d ( p B ) (1) voltage update, leading to a voltage sink at node i, and a worse
N j pi
L( p j ; t ) convergence. Also, if Yij is too large, the condition number of
the admittance matrix is too large to converge. In addition,
using damping factor could help much reduce fluctuations
around the real system state and improve the convergence-rate.
POWERCON2018 Paper No xxx Page 4/82018 International Conference on Power System Technology (POWERCON 2018) Guangzhou, 6-8 Nov. 2018
But, the convergence-rate is still slow, especially when a high 15. [update power mismatch and voltage changes from
precision is needed. This is determined by the algorithm itself. last iteration];}
In each iteration, its computation only depends on results
16. End;
obtained from the previous iteration. Borrowing the idea of
Gauss-Seidel to improve power flow convergence, this paper In Fig. 5, the convergence performance of the bi-level
proposes a bi-level PageRank approach to improve the PageRank method for power flow analysis is presented, using a
convergence and meanwhile maintain the capability of parallel
provincial FJ-1425 system. Beginning with flat-start, it
computing in Jacobi method. The nodes are divided into two
converges very fast in the beginning when the voltage
levels in the GDB, ensuring that most of nodes are not mutually
connected within each level. So, based on equation (4), mismatch, respectively comparing magnitude and phase angle,
equation (5) is developed for the bi-level PageRank method is larger than 0.005. Then, the convergence curve becomes flat.
based power flow analysis. The graph for the corresponding Because of the existence of zero-impedance branch, the
power system is also divided into two, graph A and graph B. maximum bus power injection mismatch (MBPIM) is much
Graph A is first updated using results from the previous higher than 0.05 per unit even when converged.
iteration. Then nodes in graph B are updated using graph A’s
0.02
results in current iteration and graph B’s information from last
Convergence Precision
iteration [19]. 0.015
d Pi ( k ) − jQi ( k ) 0.01
Vi ( k +1) = (1 − d )Vi ( k ) + − j =1 (Yij V j ( k ) ) (4)
n
Yii V i( k )* j i
0.005
0
0 50 100 150 200 250 300 350
Vi ( k +1) = (5) Iteration
Fig. 5. Convergence of bi-level PageRank power flow analysis
(k )
Pi − jQi − (Y V ( k ) ) − (Y V ( k ) ) (i A)
(k )
(1 − d )V ( k ) + d
i
Yii Vi ( k )*
jA
ij j
jB
ij j
B. Diagonal Conjugate Gradient (DCG) Method for Power
j i Flow Analysis Using Graph Computing
(k ) In mathematics, conjugate gradient algorithm is widely
Pi − jQi − (Y V ( k +1) ) − (Y V ( k ) ) (i B )
(k )
(1 − d )Vi ( k ) + d employed as an iterative approach to solve sparse and
Yii Vi ( k )*
jA
ij j
jB
ij j
symmetric positive definite linear systems [11]. Besides, the
j i convergence-rate of an iterative linear solver increases as the
The computation procedure in graph computing is also condition number of the coefficient matrix decreases [17].
displayed below. Hence, a well-selected preconditioner M is beneficial for a
linear system solving. If using the preconditioner M = A-1, the
Graph Computing based Bi-Level PageRank Algorithm solution can be obtained directly. However, there is an extra
in Power Flow Analysis cost in the inverse operation of the coefficient matrix, A, and
1. Initialize T0 = {all nodes} matrix multiplication, A-1⸱b. So, the selection of the appropriate
2. T1 = SELECT s FROM T0:s-(edge:e) t preconditioner is the trade-off between convergence
improvement and matrix operation cost. In this paper, diagonal
3. ACCUM conjugate gradient (DCG) method is selected, because of its
4. [calculate off-diagonal elements in Ybus matrix], easy implementation and low time cost in graph database, and
5. [sum up off-diagonal elements for each node in much better convergence-rate than conjugate gradient. It is
Ybus matrix] widely employed to solve sparse symmetric positive definite
linear systems [20]. The diagonal conjugate gradient algorithm
6. POST-ACCUM is presented below.
7. [complete diagonal elements calculation for Ybus
Diagonal Conjugate Gradient Algorithm
matrix],
1. Initialization: x0 = 0 , r0 = b − A x0 , z0 = M −1 r0 , p0 = z0
8. [initialize system states];
9. while (Re{V} > threshold & Im{V}>threshold){ 2. For k = 1, 2, 3, …
10. T2 = SELECT s FROM T1:s-(edge:e) t 3. k = (rkT−1 zk −1 ) / ( pkT−1 A pk −1 ) ; Step Length
11. ACCUM 4. xk = xk −1 + k pk −1 ; Approx. Solution
12. [calculate YijV j ( k ) through edge operations]
5. rk = rk −1 − k A pk −1 ; Residual
13. POST-ACCUM
6. End if rk is sufficiently small, then exit loop.
14. [update voltages via node operations],
POWERCON2018 Paper No xxx Page 5/82018 International Conference on Power System Technology (POWERCON 2018) Guangzhou, 6-8 Nov. 2018
7. k++; 11. t.zk = t.rk / t.BIJ ,
8. zk := D−1 rk −1 ; 12. rk2 + = t.rk t.zk ;
9. k = ( zkT rk ) / ( zkT−1 rk −1 ) ; Improvement 13. End the loop if rk is sufficiently small;
10. pk = zk + k pk −1 ; Search Direction 14. k = rk2 / rk2−1 ;
11. End for-loop; 15. k++;
Based on the conjugate gradient algorithm and the feature of 16. SELECT VERTEX s in T0
graph database, variables in DCG are categorized into local 17. POST-ACCUM
variables, neighboring variables, and global variables, as 18. s.TempAP = 0 ,
shown in Fig. 6. Local variables are available and can be
directly updated using information from “local” vertices. The 19. s.Pk = s.zk + k s.Pk −1 ,
neighboring variable update needs information from vertices
and edges, meaning it must do one-step graph traversal to
20. s.TempAP + = s.BIJ t.Pk ,
retrieve information from connected edges and neighboring 21. PAP + = s.BIJ s.Pk ;
vertices. For the global variable update, it needs information
from local and neighboring variables via a full graph traversal. 22. End for-loop;
After the decomposition and analysis, DCG could be
In this paper, DCG method is applied to power system
implemented using node-based parallel graph computing.
analysis by making use of its high parallelism. The linearized
power flow equations are in equations (6) and (7).
P / V = B ' (6)
Q / V = B '' V (7)
In addition, the convergence of DCG highly depends on the
initial input x0 of the linear system A x = b . Fig.7 shows the
convergence of DCG method. Compared with Fig. 5, it took
~1000 iterations to reach the precision of 0.005 for voltage
mismatch, then it only costs approximately 200 iterations to
converge and the maximum bus power injection MBPIM is less
Fig. 6. Variables classification in the DCG approach than 0.05 per unit. It clearly shows that if x0 is close to the final
solution, it will converge quickly. In the Section III.D, DCG
In this way, the implementation of DCG in graph computing will be combined with bi-level PageRank approach in the
is demonstrated below, where .BIJ indicate the non-zero power flow analysis. Then, DCG could employ the output of
element in the matrix A, including the off-diagonal element for bi-level PageRank approach as the input of DCG power flow
edge, e.BIJ , and the diagonal element for vertex, s.BIJ . analysis, and the convergence performance is largely improved.
0.02
Diagonal Conjugate Gradient Algorithm Implemented
Convergence Precision
in Graph Computing 0.015
1. Initialization: x0 = 0 , r0 = b − A x0 , z0 = M −1 r0 , p0 = z0
0.01
2. For k = 1, 2, 3, … 0.005
3. SELECT EDGE e FROM VERTEX s in T0 to
0
VERTEX t 800 900 1000 1100 1200 1300
Iteration
4. WHERE statement // filter out disconnected edge Fig. 7. Convergence of DCG power flow analysis
5. ACCUM
C. Vertex Contraction for Power Flow Analysis Convergence
6. s.TempAP + = e.BIJ t.Pk −1 ,
Improvement
7. PAP + = t.Pk −1 e.BIJ t.Pk −1 Before combining bi-level PageRank approach and DCG
8. POST-ACCUM algorithm to improve the power flow analysis performance, one
more step is needed to reduce, even avoid, zero-impedance
9. t.xk = t.xk −1 + k t.Pk −1 , branch impact on the convergence-rate. Because of the
10. t.rk = t.rk −1 − k t.TempAP , existence of zero-impedance branches, diagonal elements in the
coefficient matrix are not dominant, worsening the
convergence. In addition, as seen in (1), if zero-impedance
POWERCON2018 Paper No xxx Page 6/82018 International Conference on Power System Technology (POWERCON 2018) Guangzhou, 6-8 Nov. 2018
branch exists, the branch admittance, Yii, is very large, much better than Bi-level PageRank, and the same as DCG and
attenuating the influence of bus power injection. So, it is the approach of VC+DCG.
difficult to guarantee that the value of maximum bus power TABLE I
injection mismatch is within an acceptable range in (1). In this PERFORMANCE OF DIFFERENT GRAPH COMPUTING BASED METHODS FOR
section, the approach of vertex contraction (VC) is employed to POWER FLOW ANALYSIS IN FJ-1425 SYSTEM
eliminate zero-impedance branch for power flow analysis, as
Convergence Number of Time MBPIM <
shown in Fig. 8. In this way, the condition number of the Approach
Precision Iteration (ms) 5E-2 p.u.
coefficient matrix in the power flow equation is much reduced
to largely improve the convergence-rate for iterative methods. Bi-Level Δ|Vr | < 2E-4
365 364.58 No
This will not affect the final solution, since the bus states on PageRank Δ|Va| < 2E-4
both sides of each zero-impedance branch have few deviations
VC based
unless nonnegligible branch is neglected. Δ|Vr | < 2E-4
Bi-Level 215 272.98 No
Δ|Va| < 2E-4
PageRank
ΔP < 5E-2
DCG 1123 1245.10 Yes
ΔQ < 5E-2
VC
ΔP < 5E-2
+ 625 774.51 Yes
ΔQ < 5E-2
Fig. 8. Vertex contraction in graph database DCG
D. Graph based Combination of Iterative Methods and Vertex ① Bi-Level
VC PageRank: ① Bi-Level
Contraction Approach for Power Flow Analysis + Δ|Vr | < 1E-2 PageRank: 8
As shown in Fig. 5 and Fig. 7, bi-level PageRank method Bi-Level Δ|Va| < 1E-2; +
370.77 Yes
converges fast in the beginning and DCG can converge quickly PageRank ② DCG: 318
+ ② DCG:
with a good initial start. Besides, with the use of VC, the impact DCG ΔP < 5E-2 Total: 326
of zero-impedance branch is minimized. So, this paper ΔQ < 5E-2
proposes to first employ VC for network preprocessing, use
bi-level PageRank to achieve a good initial start for DCG and,
at last, reach the final solution using DCG algorithm. It is able B. Discussion
to improve the convergence-rate without sacrificing the Assuming that system state changes gradually in continuous
computation accuracy. Different methods are tested and time series, then the problem solution could be converged very
compared in Section IV. fast if using the system state at the last time point as the start
point. Besides, using the method of VC + Bi-level PageRank +
IV. CASE STUDY DCG has no LU factorization and complicated matrix
manipulation, saving large amount of time.
A. Performance Testing
In this section, a practical power system in Fujian province V. CONCLUSION
with 1425 buses are used as the testing case. As shown in Table
I, five different approaches for power flow analysis are In this paper, a combinative approach is implemented for fast
implemented in FJ-1425 system. The comparison of power flow analysis. It consists of vertex contraction, Bi-level
computation performance, including both computation speed PageRank and DCG. It is verified that using vertex contraction
and calculation accuracy, is presented. It can be clearly seen can help convergence improvement by avoiding
that, with the help of VC, the impact of zero-impedance zero-impedance branch, Bi-level PageRank is able to converge
branches is minimized and the convergence-rate is largely fast in the beginning to provide a good initial start for DCG, and
improved. This is because the condition number is much then DCG can converge quickly without sacrificing the
reduced after the elimination of the zero-impedance branch. In computation accuracy.
addition, it displays that only Bi-level PageRank method is not
effective for a large system, even though its convergence-rate is REFERENCES
much better than DCG, which needs a good initial start. [1] U.S. Department of Energy, “2015 Quadrennial Technology Review,”
2015. [Online]. Available:
Regarding the fifth approach, which is a combination of https://www.energy.gov/sites/prod/files/2017/03/f34/quadrennial-techno
iterative methods and VC, its computation time is comparable logy-review-2015_1.pdf.
with Bi-level PageRank and much less than DCG and the [2] S. Zhao and C. Singh, “Studying the Reliability Implications of Line
method of VC+DCG. Furthermore, the calculation accuracy is Switching Operations,” IEEE Trans. Power Syst., vol. 32, no. 6, pp.
4614–4625, 2017.
POWERCON2018 Paper No xxx Page 7/82018 International Conference on Power System Technology (POWERCON 2018) Guangzhou, 6-8 Nov. 2018
[3] C. Yuan, M. A. Haj-ahmed, and M. S. Illindala, “Protection strategies for
medium-voltage direct-current microgrid at a remote area mine site,”
IEEE Trans. Ind. Appl., vol. 51, no. 4, pp. 2846–2853, Jul. 2015.
[4] C. Yuan, K. Lai, M. S. Illindala, M. A. Haj-ahmed, and A. S. Khalsa,
“Multilayered Protection Strategy for Developing Community
Microgrids in Village Distribution Systems,” IEEE Trans. POWER
Deliv., vol. 32, no. 1, pp. 495–503, 2017.
[5] J. Shi, G. Liu, R. Dai, J. Wu, C. Yuan, and Z. Wang, “Graph based power
flow calculation for energy management system,” in Proc. of 2018 IEEE
Power and Energy Society General Meeting, Portland, OR, 2018, pp.
1–5.
[6] R. Biswas, B. Hendrickson, and G. Karypis, “Graph partitioning and
parallel computing,” Parallel Comput., vol. 26, no. 12, pp. 1515–1517,
2000.
[7] B. Hakavik and A. T. Holen, “Power system modelling and sparse matrix
operations using object-oriented programming,” IEEE Trans. Power
Syst., vol. 9, no. 2, pp. 1045–1051, 1994.
[8] W. F. Tinney, V. Brandwajn, and S. M. Chan, “Sparse vector methods,”
IEEE Trans. Power Appar. Syst., vol. PAS-104, no. 2, pp. 295–301, 1985.
[9] G. Karypis and V. Kumar, “A parallel algorithm for multilevel graph
partitioning and sparse matrix ordering,” J. Parallel Distrib. Comput.,
vol. 48, no. 1, pp. 71–95, 1998.
[10] R. Alqadi and M. Khammash, “An Efficient Parallel Gauss-Seidel
Algorithm for the Solution of Load Flow Problems,” Int. Arab J. Inf.
Technol., vol. 4, no. 2, pp. 148–152, 2007.
[11] X. Li, F. Li, H. Yuan, H. Cui, and Q. Hu, “GPU-Based Fast Decoupled
Power Flow with Preconditioned Iterative Solver and Inexact Newton
Method,” IEEE Trans. Power Syst., vol. 32, no. 4, pp. 2695–2703, 2017.
[12] P. Błaśkiewicz, M. Zawada, P. Balcerek, and P. Dawidowski, “An
application of GPU parallel computing to power flow calculation in
HVDC networks,” in 23rd Euromicro International Conference on
Parallel, Distributed, and Network-Based Processing, PDP 2015, 2015,
pp. 635–641.
[13] Z. Zhou, C. Yuan, Z. Yao, J. Dai, G. Liu, R. Dai, Z. Wang, and G. Huang,
“CIM/E oriented graph database model architecture and parallel network
topology processing,” in Proc. of 2018 IEEE Power and Energy Society
General Meeting, Portland, OR, 2018, pp. 1–5.
[14] G. Liu, X. Chen, Z. Wang, R. Dai, J. Wu, C. Yuan, and J. Tan, “Evolving
Graph Based Power System EMS Real Time Analysis Framework,” in
Proc. of 2018 IEEE International Symposium on Circuits and Systems
(ISCAS), Florence, Italy, 2018, pp. 1–5.
[15] C. Yuan, Y. Zhou, G. Zhang, G. Liu, R. Dai, X. Chen, and Z. Wang,
“Exploration of graph computing in power system state estimation,” in
Proc. of 2018 IEEE Power and Energy Society General Meeting,
Portland, OR, 2018, pp. 1–5.
[16] T. Chen, C. Yuan, G. Liu, and R. Dai, “Graph based platform for
electricity market study, education and training,” in Proc. of 2018 IEEE
Power and Energy Society General Meeting, Portland, OR, 2018, pp.
1–5.
[17] Y. Zhao, C. Yuan, G. Liu, and I. Grinberg, “Graph-based preconditioning
conjugate gradient algorithm for ‘N-1’ contingency analysis,” in Proc. of
2018 IEEE Power and Energy Society General Meeting, Portland, OR,
2018, pp. 1–5.
[18] C. Vicknair, M. Macias, Z. Zhao, X. Nan, Y. Chen, and D. Wilkins, “A
comparison of a graph database and a relational database,” Proc. 48th
Annu. Southeast Reg. Conf. ACM SE 10, p. 1, 2010.
[19] C. Yuan, Y. Lu, K. Liu, G. Liu, R. Dai, and Z. Wang, “Exploration of
Bi-Level PageRank Algorithm for Power Flow Analysis Using Graph
Database,” in 2018 IEEE International Congress on Big Data (BigData
Congress), San Francisco, CA, 2018., 2018, pp. 1–7.
[20] Y. Saad, Iterative methods for sparse linear systems. siam, 2003.
POWERCON2018 Paper No xxx Page 8/8You can also read