Regional Temperature-Sensitive Diseases and Attributable Fractions in China - MDPI
←
→
Page content transcription
If your browser does not render page correctly, please read the page content below
International Journal of
           Environmental Research
           and Public Health

Article
Regional Temperature-Sensitive Diseases and
Attributable Fractions in China
Xuemei Su, Yibin Cheng, Yu Wang, Yue Liu, Na Li, Yonghong Li * and Xiaoyuan Yao *
 National Institute of Environmental Health, Chinese Center for Disease Control and Prevention, Beijing 100021,
 China; suxuemei0918@163.com (X.S.); ybcheng123@163.com (Y.C.); wangyu@nieh.chinacdc.cn (Y.W.);
 liuyue@nieh.chinacdc.cn (Y.L.); lina@nieh.chinacdc.cn (N.L.)
 * Correspondence: liyonghong@nieh.chinacdc.cn (Y.L.); yaoxy@chinacdc.cn (X.Y.)

 Received: 10 December 2019; Accepted: 25 December 2019; Published: 26 December 2019

 Abstract: Few studies have been carried out to systematically screen regional temperature-sensitive
 diseases. This study was aimed at systematically and comprehensively screening both high- and
 low-temperature-sensitive diseases by using mortality data from 17 study sites in China located in
 temperate and subtropical climate zones. The distributed lag nonlinear model (DLNM) was applied to
 quantify the association between extreme temperature and mortality to screen temperature-sensitive
 diseases from 18 kinds of diseases of eight disease systems. The attributable fractions (AFs) of sensitive
 diseases were calculated to assess the mortality burden attributable to high and low temperatures.
 A total of 1,380,713 records of all-cause deaths were involved. The results indicate that injuries,
 nervous, circulatory and respiratory diseases are sensitive to heat, with the attributable fraction
 accounting for 6.5%, 4.2%, 3.9% and 1.85%, respectively. Respiratory and circulatory diseases
 are sensitive to cold temperature, with the attributable fraction accounting for 13.3% and 11.8%,
 respectively. Most of the high- and low-temperature-sensitive diseases seem to have higher relative
 risk in study sites located in subtropical zones than in temperate zones. However, the attributable
 fractions for mortality of heat-related injuries were higher in temperate zones. The results of this
 research provide epidemiological evidence of the relative burden of mortality across two climate
 zones in China.

 Keywords: extreme temperature; sensitive disease; attributable fraction; multi-region study;
 regional differences

1. Introduction
     As global temperatures rise, extreme temperature events are expected to become more intense,
more frequent and longer by the end of the twenty-first century [1,2]. Extreme temperature events
have a variety of adverse effects upon human health, which have contributed to increased mortality
due to various diseases [3–6], including communicable and non-communicable diseases [7,8]. Many
previous multi-city studies have shown that both high and low temperature could increase mortality
or morbidity [9,10] and have delayed effects.
     For example, a study in the United States [11] investigated 31 common diseases in 1943 counties,
and showed that extreme heat could increase the rates of hospital admission for specific diseases, such
as influenza, electrolyte disturbance and renal failure. A study in China conducted in 272 cities [12]
showed that both high and low temperatures increased mortality, especially from circulatory and
respiratory diseases, and the burden of death varied by climatic zone. Similar studies were also
conducted in France [13], Japan [14] and Vietnam [15]. However, most of the previous studies mainly
focused on common diseases, such as cardiovascular, cerebrovascular, respiratory and infectious

Int. J. Environ. Res. Public Health 2020, 17, 184; doi:10.3390/ijerph17010184      www.mdpi.com/journal/ijerph
Int. J. Environ. Res. Public Health 2020, 17, 184 2 of 15
diseases. Few studies have paid attention to relatively rare diseases such as injuries and nervous
disease [16,17].
Studies that cover a comprehensive spectrum of diseases remain scarce, especially in China.
Therefore, our study was aimed at examining the association between extreme temperature and
a spectrum of diseases besides circulatory and respiratory diseases, in order to systematically and
comprehensively screen both high- and low-temperature-sensitive diseases in temperate and subtropical
regions, and to assess the mortality burden of sensitive diseases through a multi-city study in China.
2. Materials and Methods
2.1. Study Regions
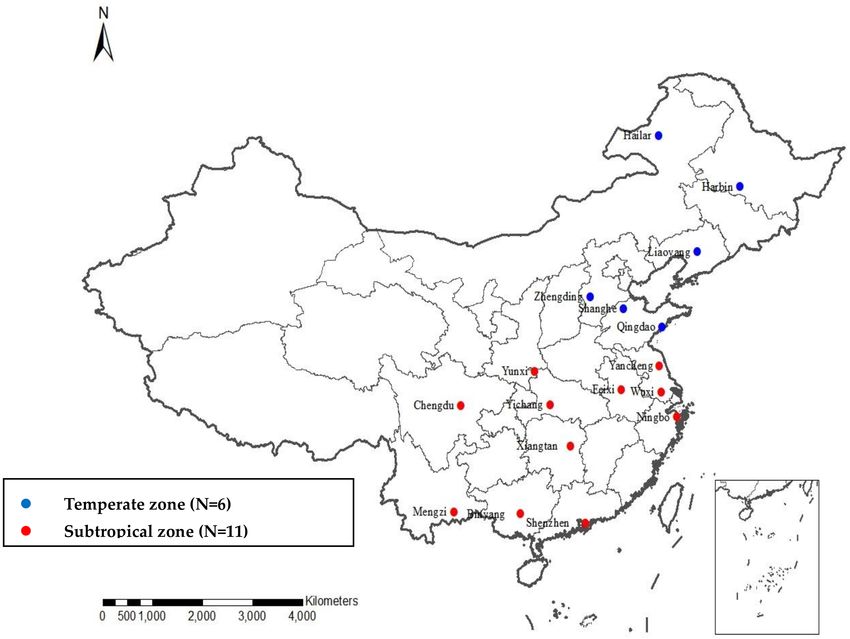
Seventeen cities or counties in 10 of 11 meteorological geographic zones in China (shown in
Figure 1) were selected as study sites to screen regional diseases sensitive to extreme temperature and
to assess the burden of mortality ascribed to extreme temperature. The study sites were divided into
two parts according to climatic zones: the subtropical zone (N = 11) and temperate zone (N = 6).
Figure 1. Geographical location of 17 study sites.
2.2. Mortality Data
Daily mortality data for 17 study sites in China during 2014–2017 were collected from the local
Centers for Disease Control and Prevention. In the analysis, the following causes of death, according to
the International Classification of Diseases, Tenth Revision (ICD-10), were used: all-cause (A00–Z99),
infectious (A00–B99), endocrine (E00–E35), diabetes (E10–E14), nervous system (G00–G99), circulatory
system (I00–I99), respiratory system (J00–J99), digestive system (K00–K93), genitourinary system
(N00–N39) and injury (S00–T98, V01–V99, W00–X59, X60–Y89). Diseases of the circulatory system
were subdivided into cardiovascular disease (I20–I25) and cerebrovascular disease (I60–I69), which
included intracerebral hemorrhage (I61), cerebral infarction (I63), stroke not specified as hemorrhage
or infarction (I64) and sequelae of cerebrovascular disease (I69).Int. J. Environ. Res. Public Health 2020, 17, 184 3 of 15
Diseases of the respiratory system were subdivided into acute infectious respiratory diseases
(J09–J18) and chronic lower respiratory diseases (J40–J47).
2.3. Meteorological and Air Pollution Data
Daily meteorological data from the national meteorological station at each study site were
provided by the China Meteorological Administration, including daily maximum, mean and minimum
temperatures (◦ C), daily mean barometric pressure (hpa) and daily mean relative humidity (RH, %).
Daily air pollution data for each site were provided by local Municipal Ecological Environment Bureaus,
including particulate matter of mass median aerodynamic diameters less than 2.5 µm (PM2.5 ; 24 h
mean in µg/m3 ) and ozone (O3 ; 8 h mean in µg/m3 ).
2.4. Statistical Analysis
2.4.1. Two-Stage Analysis
In the first stage, a distributed lag nonlinear model (DLNM) with quasi-Poisson regression was
applied to quantify the association between extreme temperature and cause-specific mortality at each
study site. The DLNM model was as follows:
log[E(Yit )] = α + cb(Tit , lag = 30) + ns(timei , df = 7/year) + ns(HR, 4)+
(1)
ns(P, 4) + ns(PM2.5 , 5) + ns(O3 , 5) + βDOWit
where Yit represents the number of deaths on day t at site i; α is the intercept; Tit is the daily maximum
temperature on day t at site i; the lag day up to 30 reflects the maximum lag day of the temperature
effect; cb refers to the cross-basis function, which specifies the exposure–lag–response relationship
simultaneously in the exposure–response and lag–response dimensions; a quadratic B spline with
two knots was used for temperature, and a natural spline with 5 df for lag; ns represents the natural
cubic spline; DOW stands for day of the week, which was entered as a categorical variable; and β is
the coefficient of DOW [18,19]. The mean relative humidity, mean barometric pressure, PM2.5 , O3 ,
long-term trend time and DOW were considered as potential confounders. A correlation analysis of
O3 , PM2.5 , temperature and relative humidity was conducted for our 17 study sites. The correlation
coefficient was between 0.01 and 0.5, thus multicollinearity was not a major concern [20], and all
three pollutants were included in the model. Long-term trends were modeled with seven degrees of
freedom (df ) per year. Mean relative humidity (HR) and mean barometric pressure (P) were modeled
as a quadratic n-spline with 4 df. O3 and PM2.5 were modeled as a quadratic n-spline with 5 df.
The minimum mortality temperature (MMT) was used as the optimum and reference temperature [12].
The 2.5th and 97.5th percentiles of daily maximum temperature in the entire year were chosen as the
extreme low and high temperatures in the model, respectively.
In the second stage, we obtained the best linear unbiased prediction (BLUP) of each site and
specific cumulative (≤30 lag days) associations between temperature and mortality at both regional
(climatic zone) and overall levels by using a recently developed multivariate meta-regression [21].
Cumulative relative risk (CRR) under specific lag days was calculated to evaluate the effects of extreme
temperature on mortality, and to screen the diseases sensitive to extreme temperature at the overall
and regional level compared to MMT. Diseases were considered as sensitive to extreme temperature if
the cumulative RR was greater than 1, and the 95% confidence interval (CI) did not contain 1.
2.4.2. Estimation of Attributable Fractions
Based on the above steps, diseases sensitive to extreme temperature was screened, and then
the AF values were calculated to estimate the mortality burden caused by the temperature of these
diseases. For each day at each study site, we calculated the cumulative RR for the spectrum of diseases
by comparing it to the MMT. The attributable deaths and AFs for the present day and 30 lagged days
were then calculated according to a backward perspective [22].Int. J. Environ. Res. Public Health 2020, 17, 184 4 of 15
We obtained the total counts of deaths attributable to non-optimum temperature by summing the
contributions from all days in the series and determined the total AF by dividing the total number
of deaths by the total number of attributable deaths. We empirically calculated the AFs associated
with cold and heat by summing the subsets of days with relevant temperature ranges according to
each region’s specific temperature threshold (that is, minimum daily maximum temperature up to the
MMT and MMT up to maximum daily maximum temperature, respectively). Finally, we calculated
the empirical confidence interval (eCI) values through Monte Carlo simulations [23] and the related
2.5th and 97.5th percentiles of multivariate normal distribution were interpreted as 95% empirical
confidence intervals [23].
2.4.3. Assessing Regional Differences
In order to assess the differences in the risk of mortality among people in the two climate zones,
we repeated the aforementioned 2-stage analysis by region. Then we performed the significance test
on the difference between effect estimates for the two subgroups using the following formula [24]:
q
Z = (E1 − E2 )/ SE(E1 )2 + SE(E2 )2 (2)
where Z is the Z-test, E1 and E2 are the effect estimates for two categories (such as temperate zone and
subtropical zone), and SE (E1 ) and SE (E2 ) are their respective standard errors.
2.5. Sensitivity Analysis
Sensitivity analysis was used to validate the stability of the model by extracting air pollutants
(PM2.5 , O3 , CO), mean relative humidity, and mean barometric pressure from the model and by using
alternative maximum lags of 7, 14 and 21. We also controlled for the 2-day average concentrations of
fine particulate matter and ozone (as an indicator of air pollution) in another analysis. The results are
shown in Supplementary Tables S1 and S2.
Data analysis was conducted using R software (version 3.5.1, R Foundation for Statistical
Computing Platform 2013). The dlnm package [25] and mvmeta package [26] were used for fitting
DLNM and meta-analysis, respectively. For all statistical tests, 2-tailed p-value < 0.05 was considered
as statistically significant.
2.6. Ethics Approval and Consent to Participate
Ethical approval for this study was granted by the National Institute of Environmental Health,
Chinese Centers for Disease Control and Prevention.
3. Results
3.1. Descriptive Statistics
Table 1 shows the descriptive statistics of daily maximum temperature, mean relative humidity,
mean barometric pressure and air pollutants at 17 study sites during 2014–2017. The mean daily
maximum temperature ranged from 5.8 ◦ C (range: −34.1–41.7 ◦ C) in Hailar to 27.1 ◦ C (range:
6.5–36.9 ◦ C) in Shenzhen. The 2.5th and 97.5th percentiles of daily maximum temperature varied across
study sites, and ranged from 32 to 38 ◦ C and from −24 to 14 ◦ C, respectively. Daily mean concentration
of PM2.5 and O3 varied across study sites and ranged from 29.1 µg/m3 to 108 µg/m3 and from 54 µg/m3
to 122 µg/m3 , respectively.Int. J. Environ. Res. Public Health 2020, 17, 184 5 of 15
Table 1. Descriptive statistics of meteorological factors and air pollutants at 17 study sites in China, 2014–2017. MMT, minimum mortality temperature.
Study Study Mean Relative Mean Barometric Pressure
Population Maximum Temperature (◦ C) Mean PM2.5 (µg/m3 ) Mean O3 (µg/m3 )
Site Period Humidity (%) (hpa)
(city/county) (million) Mean ± SD Min Max MMT 97.5th 2.5th Mean ± SD Min Max Mean ± SD Min Max Mean ± SD Min Max Mean ± SD Min Max
Harbin 2014–2016 31.7 10 ± 15.2 –21.6 36.2 26 32 –16 65 ± 15 15 97 9994 ± 95 9732 10,252 64.8 ± 61 8 653 63.6 ± 42.7 10 179
Liaoyang 2014–2015 1.89 16.1 ± 12.7 –17.1 37.1 29.5 33 –7 56 ± 16 13 98 10,123 ± 96 9840 10,359 33 ± 28 3 423 82.3 ± 32.1 17 291
Hailar 2014–2017 0.29 5.8 ± 17.9 –34.1 41.7 24 32 –24 62 ± 15 15 94 9371 ± 76 9127 9618 29.1 ± 17 5 164 74.4 ± 72.4 13 160
Zhengding 2014–2016 2.94 20.5 ± 11.1 –9.1 43.4 18 37 1 54 ± 20 12 99 10,076 ± 99 9868 10,346 108 ± 89 0 653 102 ± 67 0 322
Qingdao 2014–2016 9.39 17.3 ± 9.3 –7.7 36.9 29 32 1 69 ± 16 16 100 10,075 ± 90 9878 10,292 48 ± 34 4 298 102 ± 45 17 277
Shanghe 2014–2016 1.87 19.9 ± 10.6 –10.6 40 17 35 1 68 ± 16 23 100 10,145 ± 99 9949 10,416 79 ± 52 8 342 122 ± 48 5 314
Wuxi 2014–2016 19.6 21.4 ± 9 –3.8 40.6 25 36 6 75 ± 13 33 100 10,153 ± 92 9945 10,410 61 ± 26 11 223 103 ± 48 10 279
Yancheng 2014–2017 8.25 20.2 ± 9.1 –6.2 39 28 35 4 76 ± 13 34 100 10,159 ± 92 9945 10,406 49 ± 35 5 226 83 ± 48 3 262
Feixi 2014–2017 4.00 21.5 ± 9.1 –3.2 40.8 20.5 37 5 77 ± 12 32 99 10,133 ± 102 8586 10,424 51.8 ± 35.6 3 372 54 ± 43 12 251
Yichang 2014–2017 3.67 20.9 ± 8.8 0.4 38.3 30 36 5 76 ± 14 46 58 9852 ± 85 9692 10,126 71 ± 41 6 343 73 ± 42 10 198
Yunxi 2014–2016 1.59 21.7 ± 9.4 –0.4 41.5 30 38 5 73 ± 14 14 99 9828 ± 95 9621 10,084 45 ± 33 0 554 83 ± 48 0 183
Chengdu 2013–2017 16.3 21.5 ± 7.8 2.8 36.7 30.5 35 8 80 ± 9 42 98 9506 ± 74 9325 9770 70 ± 49 9 423 89 ± 49 7 278
Ningbo 2014–2016 8.20 21.9 ± 8.6 –2.3 39.2 30 36 6 80 ± 11 34 100 10,153 ± 88 9857 10,397 43 ± 26 7 202 94 ± 49 6 242
Xiangtan 2014–2016 2.85 23.4 ± 8.8 0.1 40 20 37 5 82 ± 12 38 100 10,071 ± 88 9911 10,368 51 ± 33 0 236 81 ± 48 0 279
Mengzi 2014–2017 1.62 25.1 ± 5.5 1.3 35.4 24 32 13 69 ± 12 26 100 8677 ± 40 8580 8813 19 ± 31 1 61 84 ± 40 12 175
Shenzhen 2016–2017 24.4 27.1 ± 5.6 6.5 36.9 25.5 34 14 75 ± 13 19 100 10,029 ± 64 9765 10,223 30 ± 17 6 110 82 ± 49 25 244
Binyang 2014–2016 3.26 25.9 ± 7.3 6.5 37.3 31.5 35 10 80 ± 11 36 100 9975 ± 74 9784 10,228 29 ± 19 4- 117 89 ± 34 24 196Int. J. Environ. Res. Public Health 2020, 17, 184 6 of 15
Table 2 shows a summary of descriptive statistics on an average number of daily cause-specific
deaths at 17 study sites in China. During 2014–2017, a total of 1,380,713 all-cause deaths were
recorded. There were 535,960 (39%) deaths due to diseases of the circulatory system, among which
hypertension, ischemic heart disease, cerebral infarction, intracerebral hemorrhage, stroke and sequelae
of cerebrovascular diseases accounted for 5%, 31%, 14%, 17%, 1% and 7%, respectively. There were
199,416 (14%) deaths due to diseases of the respiratory system, among which influenza and pneumonia
and chronic obstructive pulmonary disease accounted for 18% and 53%, respectively. Diseases of
the digestive system and genitourinary system, endocrine diseases, diseases of the nervous system,
infectious diseases and injuries accounted for 2% (30,121), 0.7% (10,311), 2.5% (34,361), 0.9% (12,128),
0.6% (7951) and 6% (88,360) of total mortality, respectively.
Table 2. Summary of descriptive statistics on average daily cause-specific mortality at 17 study sites in
China, 2014–2017.
Variables Mean ± SD Minimum Maximum
Total 63 ± 66 4 222
Diseases of circulatory system 21 ± 24 2 92
Hypertension 1.2 ± 1.6 0 6
Ischemic heart disease 8 ± 11 0 45
Cerebrovascular disease 11 ± 13 0 41
Cerebral infarction 3±5 0 17
Intracerebral hemorrhage 4±5 0 18
Stroke 1±1 0 3
Sequelae of cerebrovascular disease 2±3 0 8
Diseases of respiratory system 8 ± 13 0 53
Chronic lower respiratory disease 6 ± 10 0 40
Influenza and pneumonia 2±3 0 10
Diseases of digestive system 1±2 0 7
Diseases of genitourinary system 1±1 0 2
Endocrine diseases 2±2 0 6
Diabetes 2±2 0 6
Diseases of nervous system 1±1 0 3
Infectious diseases 1±1 0 3
Injuries 4±4 0 13
Note: Total means all-cause deaths.
3.2. Association between Extreme Temperature and Cause-Specific Mortality
We found that extreme temperature increased mortality due to multiple diseases, including
diseases of the circulatory system and respiratory system, endocrine diseases, injuries and diseases
of the nervous system, compared with MMT. However, CRR varied by region and cause of death.
Figure 2 shows the overall exposure–response relationship between daily maximum temperature and
cause-specific mortality by 30 d lag at 17 study sites in China. The optimum temperature was slightly
different for different causes of death. The optimum temperature for endocrine diseases was the highest
at an MMT of 30.6 ◦ C, followed by nervous system diseases (MMT = 26.3 ◦ C), circulatory system
diseases (MMT = 23.4 ◦ C), respiratory system diseases (MMT = 23.2 ◦ C) and injuries (MMT = 21.8 ◦ C).
The overall exposure–response relationship between daily maximum temperature and digestive,
urinary and infectious diseases by 30 d lag at 17 study sites in China were shown in Figure S1.
Table 3 shows that the highest CRR of 1.45 (95% CI: 1.27–1.65) associated with extreme heat was
observed for injuries, followed by diseases of the nervous system (CRR: 1.41; 95% CI: 1.10–1.77), diseases
of the respiratory system (CRR: 1.25; 95% CI: 1.09–1.30), diseases of the circulatory system (CRR: 1.19;
95% CI: 1.12–1.26) and endocrine diseases (CRR: 1.13; 95% CI: 1.02–1.25). The majority of circulatory
diseases are affected by extremely high temperature, among which sequelae of cerebrovascular diseases
(CRR: 1.61; 95% CI: 1.41–1.85) had the highest CRR, followed by stroke (CRR: 1.52; 95% CI: 1.12–2.09),
hypertension (CRR: 1.46; 95% CI: 1.26–1.69), cerebral infarction (CRR: 1.20; 95% CI: 1.08–1.35), ischemic
heart disease (CRR: 1.18; 95% CI: 1.07–1.31) and intracerebral hemorrhage (CRR: 1.08; 95% CI: 1.00–1.16).Int. J. Environ. Res. Public Health 2020, 17, 184 7 of 15
Both acute infectious respiratory diseases and chronic respiratory diseases are sensitive to extreme heat,
among which influenza and pneumonia had CRR of 1.28 (95% CI: 1.15–1.43), and chronic obstructive
pulmonary disease had CRR of 1.22 (95% CI: 1.12–1.32). For extreme low temperature, the highest CRR
of 1.46 (95% CI: 1.16–1.82) was observed for diseases of the circulatory system, followed by diseases of
the respiratory system (CRR: 1.34; 95% CI: 1.07–1.42) and diseases of the digestive system (CRR: 1.23;
95% CI: 1.04–1.45). Although most circulatory diseases are susceptible only to extreme heat, ischemic
heart disease and intracerebral hemorrhage are susceptible to both extreme cold and extreme heat,
with CRR of 1.75 (95% CI: 1.26–2.44) and 1.49 (95% CI: 1.13–1.96), respectively.
Table 3 also shows regional differences in the association between extreme temperature and
mortality for a spectrum of diseases. For extreme heat effects, people living in subtropical zones
are more sensitive to extreme heat than people living in temperate zones, and the difference was
statistically significant (p = 0.023). Intracerebral hemorrhage (CRR: 1.12; 95% CI: 1.00–1.25) and diseases
of the nervous system (CRR: 1.51 (1.04–2.19) are only sensitive in subtropical zones; ischemic heart
disease (CRR: 1.28; 95% CI: 1.07–1.53), chronic obstructive pulmonary disease (CRR: 1.26; 95% CI:
1.09–1.45), influenza and pneumonia (CRR: 1.28; 95% CI: 1.14–1.44) and injuries (CRR: 1.34; 95% CI:
1.16–1.56) are sensitive in both subtropical and temperate zones, and the difference was not statistically
significant (p > 0.05). For extreme cold temperature effects, intracerebral hemorrhage is sensitive in
both subtropical and temperate zones, and the difference was not statistically significant (p = 0.3).
Ischemic heart disease (CRR: 1.75; 95% CI: 1.32–2.32) and chronic obstructive pulmonary disease (CRR:
1.49; 95% CI: 1.30–1.71) are sensitive only in subtropical zones.
Figure 2. Overall exposure–response relationship between daily maximum temperature and
cause-specific mortality by 30 d lag at 17 study sites in China: (a–f) total, circulatory system diseases,
respiratory system diseases, endocrine diseases, nervous system diseases, and injuries, respectively.
3.3. Attributable Fractions of Non-Optimum Temperatures
Table 4 shows the AFs of cause-specific mortality due to non-optimum temperatures in two
regions in China. We found that non-optimum temperatures increased the mortality burden of the
population, and the overall AF in low temperatures (9.40%; 95% eCI: 2.92–15.83%) was greater than in
high temperatures (1.62%; 95% eCI: 0.76–2.43%). The highest AF of heat was observed for injuriesInt. J. Environ. Res. Public Health 2020, 17, 184 8 of 15 (6.5%; 95% eCI: 2.5–10.0%), followed by nervous system diseases (4.2%; 95% eCI: 1.0–7.03%), circulatory system diseases (3.9%; 95% eCI: 0.42–7.09%), respiratory system diseases (1.85%; 95% eCI: 0.68–2.85%) and endocrine diseases (0.90%; 95% eCI: −0.3–1.9%). Circulatory system, respiratory system, and nervous system diseases had a greater burden attributed to heat in the subtropical zone, while injuries had a greater burden in the temperate zone. The highest AF of cold temperature was observed for respiratory system diseases (13.3%; 95% eCI: 5.6–23.6%), followed by circulatory system diseases (11.8%; 95% eCI: 2.4–19.6%). Circulatory system and respiratory system diseases had a greater burden attributed to cold temperature in the subtropical zone.
Int. J. Environ. Res. Public Health 2020, 17, 184                                                                                                                                          9 of 15

                                   Table 3. Cumulative relative risks of cause-specific mortality due to extreme heat and cold in two regions in China.

                                                                             Extreme Heat                                                           Extreme Cold
                       Region
                                                         Overall           Subtropical Zone        Temperate Zone               Overall           Subtropical Zone        Temperate Zone
                      Total                          1.13 (1.09, 1.18)       1.18 (1.08, 1.25)      1.06 (1.02, 1.15)       1.30 (1.10, 1.54)       1.34 (1.11, 1.62)      1.14 (0.98, 1.32)
              Circulatory system                     1.19 (1.12, 1.26)       1.27 (1.13, 1.43)      1.14 (1.03, 1.25)       1.46 (1.16, 1.82)       1.54 (1.20, 1.97)      1.47 (0.85, 2.54)
                 Hypertension                        1.46 (1.26, 1.69)              —                      —                1.64 (0.91, 2.93)              —                      —
            Ischemic heart disease                   1.18 (1.07, 1.31)       1.28 (1.07, 1.53)      1.10 (1.00, 1.21)       1.75 (1.26, 2.44)       1.75 (1.32, 2.32)      2.16 (0.82, 5.67)
           Cerebrovascular disease                   1.19 (1.12, 1.26)       1.23 (1.14, 1.33)      1.08 (1.01, 1.16)       1.39 (1.09, 1.76)       1.71 (1.43, 2.03)      0.78 (0.56, 1.08)
              Cerebral infarction                    1.20 (1.08, 1.35)              —                      —                1.49 (0.99, 2.26)              —                      —
          Intracerebral hemorrhage                   1.08 (1.00, 1.16)       1.12 (1.00, 1.25)      0.96 (0.86, 1.07)       1.49 (1.13, 1.96)       1.32 (1.13, 1.99)      1.45 (1.15, 1.90)
                     Stroke                          1.52 (1.12, 2.09)              —                      —                1.29 (0.57, 2.93)              —                      —
     Sequelae of cerebrovascular disease             1.61 (1.41, 1.85)              —                      —                1.18 (0.75, 1.85)              —                      —
              Respiratory system                     1.25 (1.09, 1.30)       1.30 (1.17, 1.45)      1.18 (0.96, 1.45)       1.34 (1.07, 1.42)       1.33 (1.14, 1.48)      0.90 (0.68, 1.43)
          Influenza and pneumonia                    1.28 (1.15, 1.43)       1.28 (1.14, 1.44)      1.29 (1.04, 1.61)       1.36 (0.76, 2.41)       0.92 (0.70, 1.17)      1.20 (0.74, 1.96)
    Chronic obstructive pulmonary disease            1.22 (1.12, 1.32)       1.26 (1.09, 1.45)      1.41 (1.07, 1.85)       1.35 (1.10, 1.65)       1.49 (1.30, 1.71)      0.94 (0.76, 1.17)
              Endocrine diseases                     1.13 (1.02, 1.25)              —                      —                0.94 (0.51, 1.73)              —                      —
                   Diabetes                          1.13 (1.03, 1.25)              —                      —                0.95 (0.50, 1.81)              —                      —
               Digestive system                      1.22 (0.95, 1.56)              —                      —                1.23 (1.04, 1.45)              —                      —
            Genitourinary system                     1.03 (0.55, 1.92)              —                      —                1.13 (0.35, 3.63)              —                      —
               Nervous system                        1.41 (1.10, 1.77)       1.51 (1.04, 2.19)      1.28 (0.88, 1.87)       1.28 (0.64, 3.43)       1.92 (0.87, 4.22)      0.36 (0.06, 2.00)
                    Injuries                         1.45 (1.27, 1.65)       1.34 (1.16, 1.56)      1.27 (1.15, 1.36)       1.17 (0.95, 1.44)       1.21 (0.98, 1.51)      1.49 (0.83, 2.65)
              Infectious diseases                    0.43 (0.07, 2.58)              —                      —                 1.00 (0.2, 4.96)              —                      —
      Note: “—” indicates no calculation of cumulative relative risk (CRR) due to few daily mortality data. Extreme heat and cold: 97.5th and 2.5th percentiles of daily maximum temperature
      distribution, respectively. Bold data represent statistical significance, and bold fonts represent 8 major systems.
Int. J. Environ. Res. Public Health 2020, 17, 184 10 of 15
Table 4. Attributable fractions (%) of cause-specific mortality due to high and low temperatures in two regions in China.
High Temperature Low Temperature
Cause of Death AFall
Overall Subtropical Zone Temperature Zone Overall Subtropical Zone Temperature Zone
Total 11.03 1.62 (0.76, 2.43) 1.96 (0.95. 2.91) 0.99 (0.42, 1.56) 9.40 (2.92, 15.83) 9.06 (4.67, 13.53) 10.0 (−1.8, 20.1)
Circulatory system 15.7 3.9 (0.42, 7.09) 2.5 (0.8, 4.1) 6.2 (−0.13, 12.0) 11.8 (2.4, 19.6) 15.1 (4.1, 24.6) 6.5 (−0.4, 11.5)
Respiratory system 15.2 1.85 (0.68, 2.85) 2.6 (1.3, 3.8) 0.58 (−0.26, 1.26) 13.3 (5.6, 23.6) 24.2 (9.8, 36) −4.3 (−15.8, 3.54)
Endocrine 9.3 0.9 (−0.3, 1.9) — — 8.4 (−15.6, 25.0) — —
Nervous system 12.6 4.2 (1.0, 7.03) 5.03 (1.8, 7.8) 1.8 (−1.6, 4.4) 8.4 (−21.1, 32.4) 16.0 (−5.1, 29.2) −16.5 (−48.2, 56.7)
Injuries 10.1 6.5 (2.5, 10.0) 6.2 (2.2, 9.8) 7.6 (3.5, 31.1) 3.6 (−10.6, 14.1) 3.8 (−7.1, 12.0) 2.9 (−21.5, 20.5)
Note: “—” indicates no calculation of attributable fractions (AFs) due to few daily mortality data. High temperature means MMT to maximum daily maximum temperature.
Low temperature means minimum daily maximum temperature to MMT. AFall represents total attributable fractions ascribed to high and low temperatures. Bold data represent statistical
significance, and bold fonts represent 8 major systems.Int. J. Environ. Res. Public Health 2020, 17, 184 11 of 15
4. Discussion
Our study covered 17 study sites and 1,380,713 records of all-cause deaths in China.
We systematically screened overall and regional heat- and cold-sensitive diseases from 18 specific
diseases of eight disease systems according to the International Classification of Diseases (ICD-10)
and assessed the mortality burden of sensitive diseases. We found that more diseases are sensitive
to extreme heat than to extreme cold, but the mortality burden of the total population ascribed to
low temperature is larger. To the best of our knowledge, this is the first study to systematically and
comprehensively screen regional sensitive diseases associated with both extreme heat and cold and
assess the mortality burden of sensitive diseases attributable to extreme non-optimum temperatures,
especially in China.
Our findings show that extreme temperature can increase mortality due to multiple diseases,
especially those that receive less attention such as nervous system diseases and injuries. The association
between extreme non-optimum temperature and mortality from circulatory system [14,27,28],
respiratory system [29–31] and endocrine [19,32–34] diseases has been widely reported. However,
no study has assessed the association between extreme temperature and mortality due to nervous
system diseases and injuries. Our findings show that extreme heat could increase mortality due to
injury, and cold has no significant effect. Several experimental studies have shown that drivers who
experience fatigue in high-temperature environments tend to have more technical errors and are
more likely to deviate from the lane, increasing the occurrence of vehicle accidents [35–37]. In many
sites located in the subtropics in our study, high temperature tends to be accompanied by greater
chances of rain, which can increase the incidence of vehicle accidents [38]. What is more, studies
have demonstrated that intense and prolonged exposure to extreme temperature is associated with
health effects, such as dehydration, spasms and fatigue, which can increase the incidence of accidental
injuries [16,17,39]. Our study found that extreme heat can increase mortality due to nervous system
diseases. Both experimental and epidemiological studies [40] have implied that extreme heat can affect
the immune system, which plays an important role in the pathogenesis and progression of nervous
system diseases such as Parkinson’s disease [41]. Therefore, it was speculated that extreme heat could
affect the nervous system.
In addition, we further explored regional differences in the association between extreme
temperature and mortality. Our findings show that people living in subtropical zones are more
sensitive to extreme temperature. This is inconsistent with previous studies [18,42]. A possible reason
is that the division of the study area or the health outcomes was different. For example, Ma et al. [42]
divided study regions into northern, eastern and southern areas to explore the regional differences
in the impact of heat waves on mortality, and the results showed that people living in northern
regions were more sensitive to heat. Zhao et al. [18] divided study regions into northern, central and
southern areas by latitude to explore the regional differences in the influence of extreme temperature on
emergency department visits, and the results showed that people living in the northern areas were more
sensitive to heat. In any case, our findings provide a scientific basis for identifying diseases sensitive to
extreme temperature in different climate zones, and suggest that it is necessary to consider local climate
characteristics and geographic location when healthcare providers and public health authorities are
developing response plans to protect vulnerable groups from extreme temperature [43]. However, in
this study, only 17 sites were included to explore regional differences. Further investigation is needed
for multi-city and multi-regional research.
We also evaluated the mortality burden attributable to non-optimum temperatures for all 17
study sites. Our findings show that 11.03% of all-cause mortality could be attributed to non-optimum
temperatures, which was comparable to China’s estimate of 11.00% reported in the global analysis [3]
and 14.33% reported in 272 Chinese cities [12]. The mortality burden attributable to non-optimum
temperatures was different by climate zones. Cities in subtropical zones have no central heating in
the winter and high temperature is frequent in the summer, leading to a heavy mortality burden ofInt. J. Environ. Res. Public Health 2020, 17, 184 12 of 15
effects [44]. It was indicated that people who have more chances to be exposed to extreme temperatures
are probably more vulnerable to extreme temperature conditions [42,45].
Several limitations should be acknowledged. First, the daily mortality numbers for several diseases,
such as stroke, infectious diseases and nervous system diseases were small, which might underestimate
or overestimate the exposure–response relationship. Also, the small number of study sites with
intra-regional variation in weather and air pollution might have relatively poor representativeness for
regional risk analysis. Second, as with most previous epidemiological studies, we used temperature
data from outdoor monitors at a fixed location, rather than individual direct measurements, which
could lead to exposure to measurement errors. Third, the uncertainty of individual behavior was
not taken into account in our study. For example, during times of extreme temperature, people often
choose to stay indoors or take preventive measures, which might underestimate the relative risk.
However, our results warrant further research on climate-sensitive disease screening and health risk
analysis with more sites and more death cases, especially for rare diseases.
5. Conclusions
Our study comprehensively and systematically screened regional diseases sensitive to extreme
temperature and assessed regional cause-specific mortality burden ascribed to extreme temperature.
Both extreme heat and cold temperature can increase mortality in multiple regions of China, but the
strength of association varies by cause of death and region. Therefore, it is important to understand
a spectrum of diseases sensitive to extreme temperatures in different regions, which would provide
evidence to warrant taking region-specific preventive measures to reduce the mortality burden in
China, particularly in the context of rapid climate change.
Supplementary Materials: The following are available online at http://www.mdpi.com/1660-4601/17/1/184/s1,
Table S1: The overall CRR of daily total mortality associated with extreme temperatures, using alternative
maximum lags, Table S2: The overall CRR of daily total mortality associated with extreme temperatures, with and
without adjustment of air pollutants; Figure S1: Overall exposure–response relationship between daily maximum
temperature and cause-specific mortality by 30 d lag at 17 study sites in China: urinary system, digestive system
and infectious diseases.
Author Contributions: X.S. was responsible for the statistical analysis and report writing. Y.L. (Yonghong Li)
guided and revised the whole article. Y.C., Y.W., Y.L. (Yue Liu), and N.L. were involved with the methodology of
the project and supervised the statistical analysis. X.Y. oversaw the project. All authors contributed to the final
report write-up. All authors read and approved the final manuscript.
Funding: This work was supported by a Special Foundation of Basic Science and Technology Resources Survey of
the Ministry of Science and Technology of China (No. 2017FY101201).
Conflicts of Interest: The authors declare no conflict of interest.
References
1. Diffenbaugh, N.S.; Scherer, M. Observational and model evidence of global emergence of permanent,
unprecedented heat in the 20th and 21st centuries. Clim. Chang. 2011, 107, 615–624. [CrossRef] [PubMed]
2. Singh, N.; Mhawish, A.; Ghosh, S.; Banerjee, T.; Mall, R.K. Attributing mortality from temperature extremes:
A time series analysis in Varanasi, India. Sci. Total Environ. 2019, 665, 453–464. [CrossRef] [PubMed]
3. Gasparrini, A.; Guo, Y.; Hashizume, M.; Lavigne, E.; Zanobetti, A.; Schwartz, J.; Tobias, A.; Tong, S.;
Rocklöv, J.; Forsberg, B.; et al. Mortality risk attributable to high and low ambient temperature: A
multicountry observational study. Lancet 2015, 386, 369–375. [CrossRef]
4. Huang, C.; Barnett, A.G.; Wang, X.; Tong, S. Effects of extreme temperatures on years of life lost for
cardiovascular deaths: A time series study in Brisbane, Australia. Circ. Cardiovasc. Qual. Outcomes 2012, 5,
609–614. [CrossRef] [PubMed]
5. Yang, X.; Li, L.; Wang, J.; Huang, J.; Lu, S. Cardiovascular mortality associated with low and high temperatures:
Determinants of inter-region vulnerability in China. Int. J. Environ. Res. Public Health 2015, 12, 5918–5933.
[CrossRef]Int. J. Environ. Res. Public Health 2020, 17, 184 13 of 15
6. Anderson, B.G.; Bell, M.L. Weather-related mortality: How heat, cold, and heat waves affect mortality in the
United States. Epidemiology 2009, 20, 205–213. [CrossRef]
7. Xiang, J.; Hansen, A.; Liu, Q.; Liu, X.; Tong, M.X.; Sun, Y.; Cameron, S.; Hanson-Easey, S.; Han, G.S.;
Williams, C.; et al. Association between dengue fever incidence and meteorological factors in Guangzhou,
China, 2005–2014. Environ. Res. 2017, 153, 17–26. [CrossRef]
8. Nguyen, H.X.; Chu, C.; Nguyen, H.L.T.; Nguyen, H.T.; Do, C.M.; Rutherford, S.; Phung, D. Temporal and
spatial analysis of hand, foot, and mouth disease in relation to climate factors: A study in the Mekong Delta
region, Vietnam. Sci. Total Environ. 2017, 581–582, 766–772. [CrossRef]
9. Dang, T.N.; Honda, Y.; Van Do, D.; Pham, A.L.T.; Chu, C.; Huang, C.; Phung, D. Effects of Extreme
Temperatures on Mortality and Hospitalization in Ho Chi Minh City, Vietnam. Int. J. Environ. Res.
Public Health 2019, 16, 432. [CrossRef]
10. Rodrigues, M.; Santana, P.; Rocha, A. Effects of extreme temperatures on cerebrovascular mortality in Lisbon:
A distributed lag non-linear model. Int. J. Biometeorol. 2019, 63, 549–559. [CrossRef]
11. Bobb, J.F.; Obermeyer, Z.; Wang, Y.; Dominici, F. Cause-specific risk of hospital admission related to extreme
heat in older adults. JAMA 2014, 312, 2659–2667. [CrossRef] [PubMed]
12. Chen, R.; Yin, P.; Wang, L.; Liu, C.; Niu, Y.; Wang, W.; Jiang, Y.; Liu, Y.; Liu, J.; Qi, J.; et al. Association between
ambient temperature and mortality risk and burden: Time series study in 272 main Chinese cities. BMJ 2018,
363, k4306. [CrossRef] [PubMed]
13. Pascal, M.; Wagner, V.; Corso, M.; Laaidi, K.; Ung, A.; Beaudeau, P. Heat and cold related-mortality in 18
French cities. Environ. Int. 2018, 121, 189–198. [CrossRef] [PubMed]
14. Fukuda, T.; Ohashi, N.; Doi, K.; Matsubara, T.; Kitsuta, Y.; Nakajima, S.; Yahagi, N. Impact of seasonal
temperature environment on the neurologic prognosis of out-of-hospital cardiac arrest: A nationwide,
population-based cohort study. J. Crit. Care 2014, 29, 840–847. [CrossRef]
15. Ponjoan, A.; Blanch, J.; Alves-Cabratosa, L.; Marti-Lluch, R.; Comas-Cufi, M.; Parramon, D.; del Mar
Garcia-Gil, M.; Ramos, R.; Petersen, I. Effects of extreme temperatures on cardiovascular emergency
hospitalizations in a Mediterranean region: A self-controlled case series study. Environ. Health 2017, 16, 32.
[CrossRef]
16. Binazzi, A.; Bonafede, M.; Levi, M.; Bugani, M.; Messeri, A.; Morabito, M.; Marinaccio, A.; Baldasseroni, A.
Evaluation of the impact of heat stress on the occurrence of occupational injuries: Meta-analysis of
observational studies. Am. J. Ind. Med. 2019, 62, 233–243. [CrossRef]
17. Varghese, B.M.; Barnett, A.G.; Hansen, A.L.; Bi, P.; Heyworth, J.S.; Sim, M.R.; Hanson-Easey, S.; Nitschke, M.;
Rowett, S.; Pisaniello, D.L. Geographical variation in risk of work-related injuries and illnesses associated
with ambient temperatures: A multi-city case-crossover study in Australia, 2005–2016. Sci Total Environ.
2019, 687, 898–906. [CrossRef]
18. Zhao, Q.; Zhang, Y.; Zhang, W.; Li, S.; Chen, G.; Wu, Y.; Qiu, C.; Ying, K.; Tang, H.; Huang, J.A.; et al. Ambient
temperature and emergency department visits: Time-series analysis in 12 Chinese cities. Environ. Pollut.
2017, 224, 310–316. [CrossRef]
19. Li, Y.; Cheng, Y.; Cui, G.; Peng, C.; Xu, Y.; Wang, Y.; Liu, Y.; Liu, J.; Li, C.; Wu, Z.; et al. Association between
high temperature and mortality in metropolitan areas of four cities in various climatic zones in China: A
time-series study. Environ. Health 2014, 13, 65. [CrossRef]
20. Williams, S.; Nitschke, M.; Weinstein, P.; Pisaniello, D.L.; Parton, K.A.; Bi, P. The impact of summer
temperatures and heatwaves on mortality and morbidity in Perth, Australia 1994–2008. Environ. Int. 2012,
40, 33–38. [CrossRef]
21. Gasparrini, A.; Armstrong, B.; Kenward, M.G. Multivariate meta-analysis for non-linear and other
multi-parameter associations. Stat. Med. 2012, 31, 3821–3839. [CrossRef] [PubMed]
22. Gasparrini, A.; Leone, M. Attributable risk from distributed lag models. BMC Med. Res. Methodol. 2014, 14,
55. [CrossRef] [PubMed]
23. Greenland, S. Interval estimation by simulation as an alternative to and extension of confidence.
Int. J. Epidemiol. 2004, 33, 1389–1397. [CrossRef] [PubMed]
24. Yang, J.; Yin, P.; Sun, J.; Wang, B.; Zhou, M.; Li, M.; Tong, S.; Meng, B.; Guo, Y.; Liu, Q. Heatwave and
mortality in 31 major Chinese cities: Definition, vulnerability and implications. Sci. Total Environ. 2019, 649,
695–702. [CrossRef]Int. J. Environ. Res. Public Health 2020, 17, 184 14 of 15
25. Gasparrini, A. Distributed Lag Linear and Non-Linear Models in R: The Package dlnm. J. Stat. Softw. 2011,
43, 1–20. [CrossRef]
26. Gasparrini, A.; Armstrong, B. Reducing and meta-analysing estimates from distributed lag non-linear models.
BMC Med. Res. Methodol. 2013, 13, 1. [CrossRef]
27. Liu, X.; Kong, D.; Fu, J.; Zhang, Y.; Liu, Y.; Zhao, Y.; Lian, H.; Zhao, X.; Yang, J.; Fan, Z. Association between
extreme temperature and acute myocardial infarction hospital admissions in Beijing, China: 2013–2016.
PLoS ONE 2018, 13, e0204706. [CrossRef]
28. Zhang, Y.Q.; Yu, C.H.; Bao, J.Z. Acute effect of daily mean temperature on ischemic heart disease mortality:
A multivariable meta-analysis from 12 counties across Hubei Province, China. Zhonghua Yu Fang Yi Xue
Za Zhi 2016, 50, 990–995.
29. Green, D.; Bambrick, H.; Tait, P.; Goldie, J.; Schultz, R.; Webb, L.; Alexander, L.; Pitman, A. Differential
Effects of Temperature Extremes on Hospital Admission Rates for Respiratory Disease between Indigenous
and Non-Indigenous Australians in the Northern Territory. Int. J. Environ. Res. Public Health 2015, 12,
15352–15365. [CrossRef]
30. Zhao, Q.; Zhao, Y.; Li, S.; Zhang, Y.; Wang, Q.; Zhang, H.; Qiao, H.; Li, W.; Huxley, R.; Williams, G.; et al.
Impact of ambient temperature on clinical visits for cardio-respiratory diseases in rural villages in northwest
China. Sci. Total Environ. 2018, 612, 379–385. [CrossRef]
31. Miao, Y.; Shen, Y.-M.; Lu, C.; Zeng, J.; Deng, Q. Maternal exposure to ambient air temperature during
pregnancy and early childhood pneumonia. J. Therm. Biol. 2017, 69, 288–293. [CrossRef] [PubMed]
32. Li, Y.; Lan, L.; Wang, Y.; Yang, C.; Tang, W.; Cui, G.; Luo, S.; Cheng, Y.; Liu, Y.; Liu, J.; et al. Extremely cold
and hot temperatures increase the risk of diabetes mortality in metropolitan areas of two Chinese cities.
Environ. Res. 2014, 134, 91–97. [CrossRef] [PubMed]
33. Li, Y.H.; Luo, S.Q.; Lan, L.; Jin, M.G.; Yang, C.; He, J.Y.; Li, H.B.; Li, C.C.; Cheng, Y.B.; Jin, Y.L. Influence of
extreme weather on years of life lost due to diabetes death in Chongqing and Harbin, China. Zhonghua Liu
Xing Bing Xue Za Zhi 2017, 38, 303–308. [PubMed]
34. Waernbaum, I.; Dahlquist, G. Low mean temperature rather than few sunshine hours are associated with an
increased incidence of type 1 diabetes in children. Eur. J. Epidemiol. 2016, 31, 61–65. [CrossRef] [PubMed]
35. Walker, S.M.; Ackland, T.R.; Dawson, B. The combined effect of heat and carbon monoxide on the performance
of motorsport athletes. Comp. Biochem. Physiol. A Mol. Integr. Physiol. 2001, 128, 709–718. [CrossRef]
36. Daanen, H.A.M.; Van De Vliert, E.; Huang, X. Driving performance in cold, warm, and thermoneutral
environments. Appl. Ergon. 2003, 34, 597–602. [CrossRef]
37. Wyon, D.P.; Wyon, I.; Norin, F. Effects of moderate heat stress on driver vigilance in a moving vehicle.
Ergonomics 1996, 39, 61–75. [CrossRef]
38. Liu, A.; Soneja, S.I.; Jiang, C.; Huang, C.; Kerns, T.; Beck, K.; Mitchell, C.; Sapkota, A. Frequency of extreme
weather events and increased risk of motor vehicle collision in Maryland. Sci. Total Environ. 2017, 580,
550–555. [CrossRef]
39. Schifano, P.; Asta, F.; Marinaccio, A.; Bonafede, M.; Davoli, M.; Michelozzi, P. Do exposure to outdoor
temperatures, NO2 and PM10 affect the work-related injuries risk? A case-crossover study in three Italian
cities, 2001–2010. BMJ Open 2019, 9, e023119. [CrossRef]
40. Labaude, S.; Moret, Y.; Cezilly, F.; Reuland, C.; Rigaud, T. Variation in the immune state of Gammarus pulex
(Crustacea, Amphipoda) according to temperature: Are extreme temperatures a stress? Dev. Comp. Immunol.
2017, 76, 25–33. [CrossRef]
41. Kox, M.; Stoffels, M.; Smeekens, S.P.; van Alfen, N.; Gomes, M.; Eijsvogels, T.M.H.; Hopman, M.T.; van der
Hoeven, J.G.; Netea, M.G.; Pickkers, P. The influence of concentration/meditation on autonomic nervous
system activity and the innate immune response: A case study. Psychosom. Med. 2012, 74, 489–494. [CrossRef]
[PubMed]
42. Ma, W.; Zeng, W.; Zhou, M.; Wang, L.; Rutherford, S.; Lin, H.; Liu, T.; Zhang, Y.; Xiao, J.; Zhan, Y.; et al.
The short-term effect of heat waves on mortality and its modi fi ers in China: An analysis from 66 communities.
Environ. Int. 2015, 75, 103–109. [CrossRef] [PubMed]
43. Guo, Y.; Li, S.; Zhang, Y.; Armstrong, B.; Jaakkola, J.J.K.; Tong, S.; Pan, X. Extremely cold and hot temperatures
increase the risk of ischaemic heart disease mortality: Epidemiological evidence from China. Heart 2013, 99,
195–203. [CrossRef] [PubMed]Int. J. Environ. Res. Public Health 2020, 17, 184 15 of 15
44. Yang, J.; Yin, P.; Zhou, M.; Ou, C.; Guo, Y.; Gasparrini, A.; Liu, Y.; Yue, Y.; Gu, S.; Sang, S.; et al. Cardiovascular
mortality risk attributable to ambient temperature in China. Heart 2015, 101, 1966–1972. [CrossRef]
45. Ma, W.; Xu, X.; Peng, L.; Kan, H. Impact of extreme temperature on hospital admission in Shanghai, China.
Sci. Total Environ. 2011, 409, 3634–3637. [CrossRef]
© 2019 by the authors. Licensee MDPI, Basel, Switzerland. This article is an open access
article distributed under the terms and conditions of the Creative Commons Attribution
(CC BY) license (http://creativecommons.org/licenses/by/4.0/).You can also read