Finite Element Method Investigation and Loss Estimation of a Permanent Magnet Synchronous Generator Feeding a Non-Linear Load - MDPI
←
→
Page content transcription
If your browser does not render page correctly, please read the page content below
Article

Finite Element Method Investigation and Loss
Estimation of a Permanent Magnet Synchronous
Generator Feeding a Non-Linear Load
Alexandra C. Barmpatza * and Joya C. Kappatou
 Department of Electrical and Computer Engineering, University of Patras, Patras 26504, Greece;
 joya@ece.upatras.gr
 * Correspondence: abarmpatza@upatras.gr; Tel.: +30-694-24779943

 Received: 24 October 2018; Accepted: 2 December 2018; Published: 4 December 2018

 Abstract: The purpose of this paper is the performance investigation of a Permanent Magnet
 Synchronous Generator (PMSG) system, suitable for wind power applications and the comparison
 of the machine electromagnetic characteristics under open and closed control loop implementations.
 The copper and iron losses are estimated and compared for the above control systems with the use
 of the Steinmetz-Bertotti loss separation equation. In addition, the effect of the rotating magnetic
 field on the total losses is studied. The generator is simulated using Finite Element Analysis (FEA),
 while the rest of the components are connected to the machine model using a drawing window of
 the FEA software and suitable command files. The close loop control used in the present study
 results to less losses and greater machine efficiency. The main novelty of the paper is the simulation
 of the PMSG coupled with a converter and control schemes using FEA, which ensures more accurate
 results of the whole system and allows the detailed machine electromagnetic study, while the
 majority of existing papers on this topic uses simulation tools that usually simulate in detail the
 electric circuits but not the machine. The FEM model is validated by experimental results.

 Keywords: finite element analysis; pulse width modulation; permanent magnet synchronous
 generator; wind generator

1. Introduction
     The utilization of wind energy for electrical energy production is becoming more and more
attractive nowadays. In [1,2], various wind turbine concepts have been studied in order to achieve
the most efficient system. As the cost of rare-earth materials has come down, PMSGs have become
more and more popular due to their tolerable air-gap depth, high efficiency, high power factors,
stability and the absence of any additional DC supply and slip rings.
     The majority of existing papers referring to the analysis of wind energy systems [3–8], use
simulation tools that are more focused on the detailed simulation of the control system rather than
the machine. Consequently, in most of the cases Matlab/Simulink is used as a simulation tool. In [3],
a wind generator system, simulated in a general-purpose circuit simulator, is presented. For the
simulation, a magnetic circuit model of a permanent magnet reluctance generator (PMRG) is
introduced and the simulation results are compared with experimental data. In [4,5], a multi-physics
system for wind turbines with permanent magnets and full conversion power electronics is
presented. The study uses two models, an analytical model and a FEA model, in order to simulate
the generator while both the power electronics and the DC link voltage control are simulated by
Simplorer. However, as stated in [5], although this co-simulation enables the researchers to
investigate the full wind system, there is a waste of simulation speed due to the communication and

Energies 2018, 11, 3404; doi:10.3390/en11123404                                www.mdpi.com/journal/energies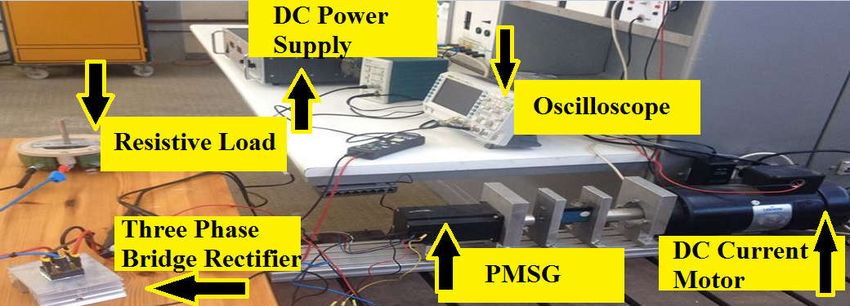
Energies 2018, 11, 3404                                                                               2

synchronization subroutines, additional effort required to couple the simulation tools that come from
different vendors and additional effort needed to develop models for different simulation and user
interface environments. In [6], a variable speed wind generator system using a PI controller has been
investigated too. The system is simulated in Matlab software which gives no opportunity for a
detailed analysis of the system. In [7], a variable speed wind energy conversion system, which uses
a PMRG is investigated. The whole system is simulated via a Simplorer-Simulink interface. In [8], a
SRG coupled with an OULTON converter for a WECS is studied, using experimental results and
Matlab/Simulink. In [9] a DC-bus grid connected hybrid wind/photovoltaic/fuel cell for supplying
power to a low voltage distribution system is presented and simulated using PSIM software. In [10]
a PMSG that feeds a diode rectifier load is simulated using FEM and the influence of gap
consideration on load identification under various Halbach-array-based topologies is investigated.
      In this study the performance and the loss estimation of a PMSG system [11,12], suitable for
wind power applications, consisting of a PMSG, a three-phase single switch boost rectifier and the
controller are investigated. The generator is simulated using FEA, while the rest of the components
are connected to the machine model using a drawing window (circuit editor) of the FEA software
and suitable command files. The FEA approach uses a RM analysis solver. A time-stepping solution
to the transient electromagnetic equation is obtained allowing the rotor to rotate by the appropriate
angle at each time-step. In the present study, the non-linear BH characteristic of ferromagnetic
material is taken into account, which is time consuming, but it can provide more accurate results.
Furthermore, the machine and the winding configuration can be captured with more detail using
FEA. Therefore, the detailed simulation adopted to the present paper ensures better accuracy and
reliability of the results concerning all the system components and the ability to study the machine
electromagnetic behavior. In other words, a more detailed analysis has been conducted, which
enables to obtain more accurate waveforms and more precise information about the harmonic
components that stress the machine and distort the output voltage and current waveforms producing
overheating. To the authors knowledge, the existence of similar system studies, in which a detailed
simulation of all components is conducted, using modern simulation software tools, like in the
present paper, is very limited in the international literature and this fact can be considered as the
originality of this particular article. In addition, the FEM model is validated by experimental results
which ensure its accuracy.
      The simulated system is investigated for three different cases. At first, the generator feeds a
resistive load without a converter connection. Two generator models are used and compared. The
first one has magnets mounted on the rotor in an asymmetrical way, while the second has a
symmetric magnet topology. The real machine used in the present study has an asymmetrical
topology, but the symmetrical topology is simulated too, because the authors want to emphasize the
accuracy of FEM which gives the opportunity to simulate the machines in detail. A comparison in
the cogging torque and the stator current harmonic components of the two models has been made,
that could not be achieved using machine models from a Simulink software library. Secondly the
generator, with the asymmetric magnet topology, coupled with the converter and an open loop
control, where the duty cycle remains constant, has been investigated. Comparisons of the
electromagnetic characteristics and generator losses for various duty cycles and rotor speeds have
been made. Then a close loop control, that varies the duty cycle with the use of a PI controller, has
been applied and the simulation results are compared with those of the previous case. Finally, the
losses due to the rotating magnetic field have been investigated and estimated also.

2. The Wind Power System
      Generally, wind power generation systems consist of a generator, a rectifier, a boost DC-DC
converter and an inverter. The terminal voltage of the machine is rectified and then boosted by the
DC-DC converter. The inverter converts the DC voltage to the appropriate voltage for the AC grid
connection [3–8]. The simulated system consists of the PMSG, the three-phase single switch boost
rectifier and the control system. Figure 1 depicts the schematic diagram of the system. In other words,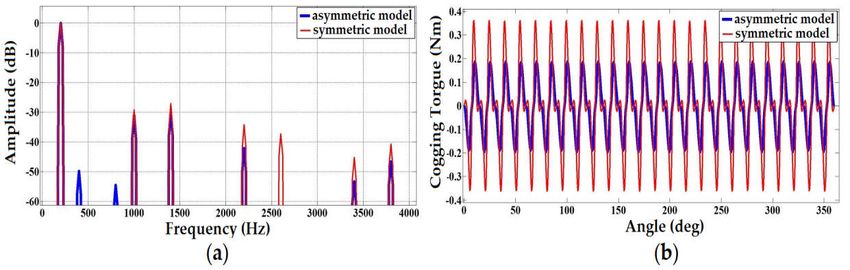
Energies 2018, 11, 3404 3
this paper focuses mainly on the first stage of the conversion, i.e., in the AC-DC converter, while the
connection of the inverter, as well as the synchronization to the grid will be studied in the future.
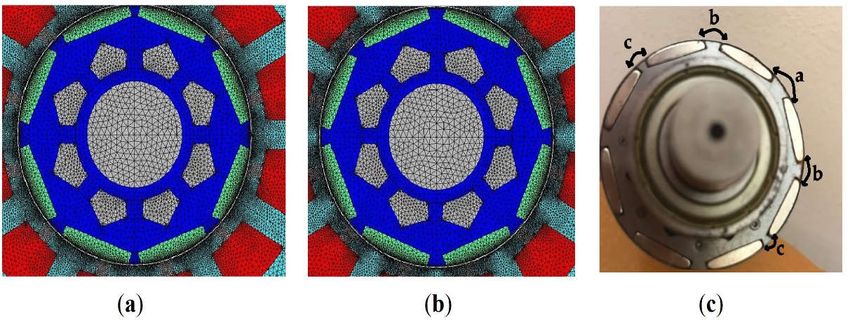
The investigated generator, that is a real commercial machine [11,12] with 12 slots, four pole
pairs, 200 Hz nominal frequency, 660 W rated power, 48 V nominal voltage and 3000 rpm nominal
speed, has been simulated. The stator winding is star connected, single layer, concentrated and non-
overlapping, while the magnets are mounted on the rotor in an asymmetrical way, that is different
distances between the magnets, in order a more sinusoidal voltage waveform to be induced [13]. For
comparison purposes both the asymmetric and the symmetric model were simulated. Figure 2
presents the meshed cross sections of the FEM machine models and a photo of the rotor of the
machine with the asymmetrically placed magnets with three different distances (a, b, c) between
them. The machine has been modeled using Opera mesher and the model consists of approximately
45,000 linear elements. On a modern PC (Intel i7-4770 with 8 GB RAM) the finite element analysis
required 4 min in order to reach the steady state condition when the generator feeds a resistive load
without a converter connection, 48 min when the generator is coupled with a rectifier and an open
loop voltage control is implemented, while 140 min for the close loop system.
Figure 1. The complete interconnected close loop system.
Figure 2. (a) The meshed cross section of the PMSG with asymmetrically placed rotor magnets, (b)
the meshed cross section of the PMSG with symmetrically placed rotor magnets, (c) a photo of the
rotor of the machine with the asymmetrically placed magnets (a > b > c).
The three-phase single switch boost rectifier, whose principle of operation is analyzed in [14,15],
has been chosen to be connected to the generator terminals. By using the circuit editor of the FEA
software the model of the converter was connected to the FEA model of the PMSG. However, in this
particular study, we have omitted the boost inductors, in order to investigate the system dynamic
behavior exclusively due to the inductances of the machine [16]. The machine inductances act as the
boost inductors for the voltage source rectifier. Consequently, the FEA model of the PMSG can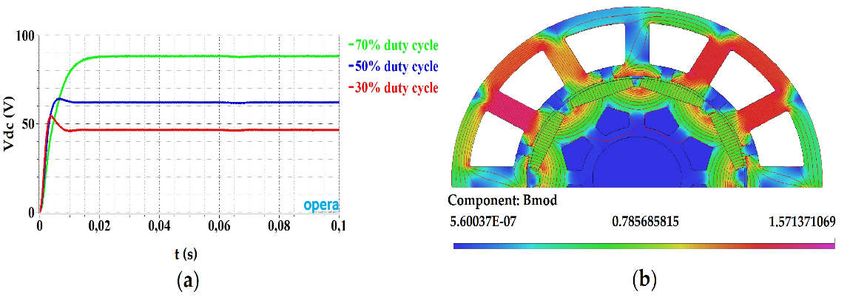
Energies 2018, 11, 3404                                                                                    4

provide not only an electromagnetic insight of the machine but also a more precise sizing of the boost
inductors, if there are essential for the operation of the converter.
      Open and close loop control systems are implemented (Figure 1) by inserting suitable command
files. The simulation results correspond to a specific operation at 3000 rpm, with the output load (R0)
10 Ω and the DC-link capacitor (C1) 2 mF. In the open loop control the duty cycle remains invariable,
while in the close loop control the duty cycle changes, with the use a PI controller. The PI compensator
input is the difference of the DC reference voltage and the output voltage Vdc, Figure 1.

3. Loss Terms

3.1. Copper Losses
      The investigated machine is a PMSM and therefore only the stator has copper losses. It is known
that the stator copper losses consist of two components: a DC and an AC owing to skin and proximity
effects. In this study, for the copper losses per phase calculation, only the DC component is taken into
consideration, as the main interest is on the iron losses:
                                                    Pcu = I2R,                                           (1)
where I is the stator current rms value and R the stator winding resistance that is considered constant.

3.2. Iron Losses
     The iron losses have an important effect on the machine efficiency and performance and could
provoke machine overheating, reduction of the rated torque and the efficiency. One of the most
widespread of the literature methods for iron loss estimation is based on the Steinmetz-Bertotti
equation. According to this equation the total iron losses can be separated into hysteresis and eddy
current losses. The generator eddy-current losses are created due to three main reasons. The first
reason is the MMF distribution, especially when the machine has fractional slot concentrated
windings. In this case the amount of magneto-motive force (MMF) harmonics is large, which results
in increased eddy-current losses. Secondly the eddy current losses could be created due to the
permeance variation, while the third reason is the existence of PWM harmonics. The converter
provokes time harmonics in the stator current waveform and consequently losses are created on the
generator [14,15,17–21]. Moreover, the eddy current losses are separated into classical losses, that are
the eddy currents induced in materials by an external alternating magnetic field, and excess losses
that are result of the internal movement of domain walls between different magnetic domains [22–
25]. Taking into account the above consideration, the total iron losses are the sum of hysteresis,
classical eddy current and excess losses [22,26,27]:
                              Pfe= Ph+ Pe+ Pa = ρfekhfBα + ρfekef2Β2 + ρfekaf1.5B1.5,                    (2)
where ρfe is the iron density in Kg/m3, α is the constant of Steinmetz, kh is the hysteresis loss
coefficient, ke is the eddy current loss coefficient, ka is the excess loss coefficient, f is the electrical
frequency in Hz and B is the peak value of the magnetic flux density in T. The coefficients α, kh, ke,
and ka, are determined by fitting based on Epstein frame measurements and for the specific analysis
they have the values α=2, kh = 0.0061 W/kg/Hz/Tα, ke = 0.00013334 W/kg/Hz2/T2, and ka = 0.00027221
W/kg/Hz1.5/T1.5. For the FEM simulations, the right choice of the material parameters and the power
supply conditions is the most critical factor.
     Equation (2) is sufficiently accurate to predict the iron losses for an alternating magnetic field.
Nevertheless, for a rotating magnetic field, Equation (2) is not appropriate for the iron losses
estimation. In that case the magnetic field vector, except from the space rotation, creates rotating
magnetic fields in some regions of the electrical machine core which results in differentiated losses.
The above losses due to the rotating magnetic field are calculated in Section 6.

4. FEM Model Validation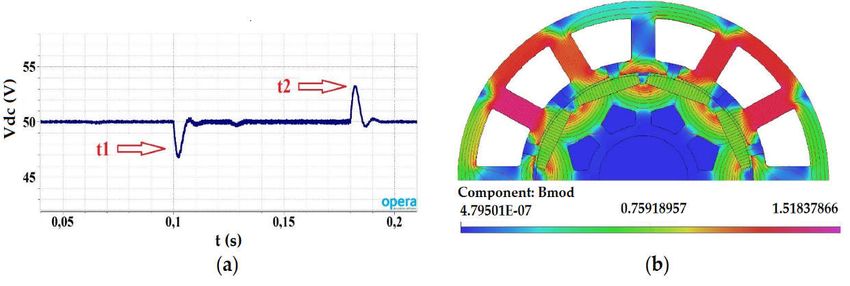
Energies 2018, 11, 3404                                                                                  5

     In order to validate the FEM model of the machine, essential experiments have been conducted
in the laboratory and the experimental results are compared with the corresponding simulation
results. The experiments were performed for the no load condition and when the generator is feeding
a 10 ohm resistive load through a three-phase diode bridge rectifier. The experimental system is
depicted in Figure 3. It consists of the PMSG coupled with a permanent magnet DC motor, the DC
power supply that feeds the permanent magnet DC motor, the three-phase diode bridge and a
variable resistive load. The current, voltage probes and the oscilloscope are used for the experimental
procedure.

           Figure 3. The experimental system in the Electromechanical Energy Conversion Laboratory.

    At first experiments were conducted for the no load condition at 2000 rpm and the results are
compared with the corresponding FEA simulation results. In Figure 4a the line voltage waveform is
depicted, while in Figure 4b it can be seen the line voltage waveform that was exported for the
simulation. The rms value of the line voltage waveform resulted from experiment is 18.8 V, while the
same rms value resulted from simulation is 18.6 V. The difference is approximately 1%.

      Figure 4. The waveforms of line voltage for the no load condition and 2000 rpm: (a) experimental
      results, (b) FEA simulation results.

     Experimental results are also exported when the generator is coupled with a three-phase diode
bridge rectifier and a resistive load. In Figure 5 the experimental and simulation results for 1500 rpm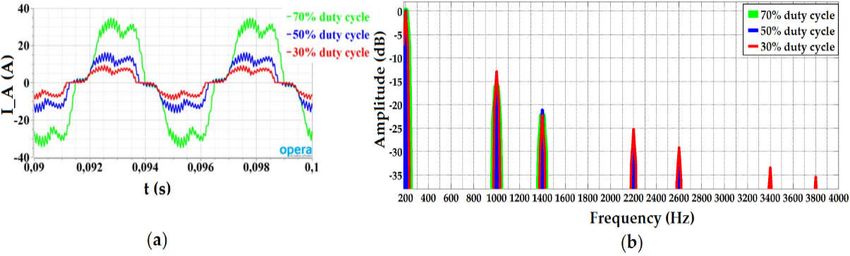
Energies 2018, 11, 3404                                                                                     6

are presented, while in Figure 6 the same results are depicted for 2000 rpm. The experimental results
agree very well qualitative as well as quantitative with the simulation results. When the generator
speed is 1500 rpm, the experimental rms line voltage is 13.5 V and the rms phase current 1.49 A, while
the corresponding simulation values are 13.9 V and 1.32 A, respectively. For 2000 rpm, the rms line
voltage is 18.9 V and 18.6 V considering the experimental and simulation results, respectively, while
the rms phase current is 2.11 A for the experimental and 1.80 A for the simulation case. The
differences between the experimental and simulation results are very small and thus the FEM model
is considered valid.

      Figure 5. The waveforms of line voltage and phase current when the generator is coupled with a
      three-phase diode bridge and a resistive load of 10 ohm for 1500 rpm: (a) experimental results, (b)
      FEA simulation results.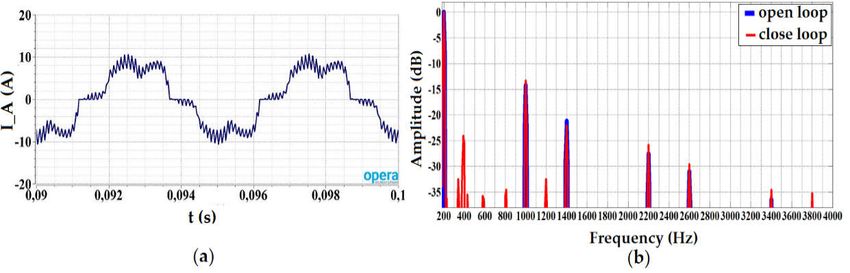
Energies 2018, 11, 3404                                                                                       7

      Figure 6. The waveforms of line voltage and phase current when the generator is coupled with a
      three-phase diode bridge and a resistive load of 10 ohm for 2000 rpm: (a) experimental results, (b)
      FEA simulation results.

5. Simulation Results

5.1. Symmetric and Asymmetric Model of the Generator with a Resistive Load
     At first, the generator feeding directly a resistive load of 10 Ω, without the power electronic
converter, is investigated. In Figure 7a the phase current spectra for the two models, the asymmetric
and the symmetric, are compared. In both cases, the stator current contains higher harmonics caused
by the configuration of the stator winding and the rotor topology. In other words, the stator current
does not form a pure sinusoidal waveform, due to higher harmonics caused by the spatial non-
sinusoidal magnetic field distribution of the machine. The configuration of the stator winding and
the rotor topology strongly influences the harmonic content of the air gap magnetic field and thus
the voltage and the stator current. From the simulation, it can be verified that the generator with the
asymmetric configuration induces a more sinusoidal current. Indeed, the amplitude of the higher
harmonic components of the current is lower when magnets are placed asymmetrically, Figure 7a.
According to [13,28,29], when the magnets are placed asymmetrically on the rotor there is a reduction
in the cogging torque and also an EMF with lower harmonic distortion is induced. The cogging torque
is the result of the interaction between the stator slot openings with the PMs on the rotor, so the
period of the cogging torque is linked with the number of slots, Q, and poles, 2p. The period of the
cogging torque, Tc, can be expressed by the following relationship [29]:

                                                  Tc =     { ,   }
                                                                     ,                                       (3)

where the LCM is the least common multiple. As far as the studied generator concerned, the period
of the cogging torque is Tc = π/12 s which can be verified by Figure 7b where the cogging torque
appearing in the two models is compared. From the same Figure it can be seen also that the amplitude
of the cogging toque is almost doubled in the case of the symmetric model of the machine.
      As the machine used for the experiment has asymmetrically placed magnets, the simulated
machine should have also the same rotor topology in order the results to be accurate. Therefore, in
all the simulations bellow the FEM model of the machine with asymmetrically placed magnets is used.

      Figure 7. (a) The phase current spectrum for the model for 3000 rpm rotor speed and a resistive load
      10 Ω, (b) The machine’s cogging torque versus angle. (asymmetric model: blue line, symmetric model:
      red line).

5.2. Open Loop Control of the System
     The three-phase single switch boost rectifier is connected to the generator terminals and an open
loop PWM control is applied to the switch. In Figure 8a the output open loop DC voltages for three
different duty cycles when the machine supplies a resistive load of 10 Ω, are depicted and compared.
When the duty cycle increases, the output open loop DC voltage increases too. In Figure 8b the
distribution of the absolute value of the magnetic flux density (Bmod) is depicted for the case of the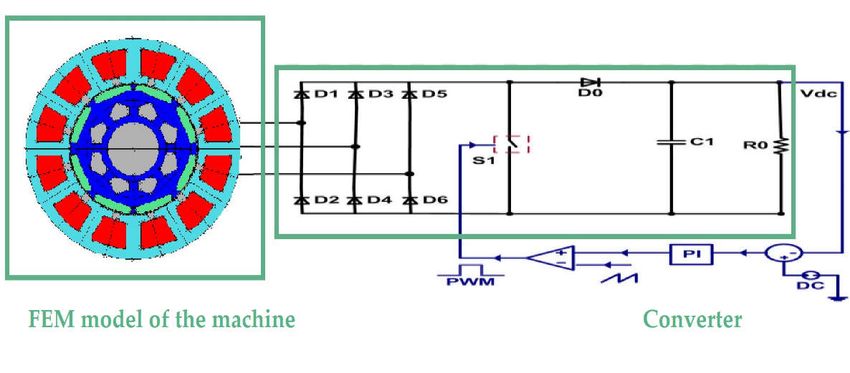
Energies 2018, 11, 3404                                                                                        8

open loop control with 50% duty cycle. The switching period is equal to Ts = 10−4 s. The duty cycle
does not change and the conducting time interval of the switch is equal to ton = 5 × 10⁻⁵ s. In Figure 9a
the waveforms of the phase current for three different duty cycles are presented, while in Figure 9b
the FFT analysis in the machine phase current is shown. The ripples appearing in the waveforms of
Figure 9a result from the machine inductances and the switching frequency of the PWM technique
[30,31]. As the machine operates at 200 Hz and the switching frequency equals to 10 kHz, it can be
seen 50 ripples in the current waveform for one electrical period, Figure 9a. The aforementioned
analysis reveals that, this converter increases the amplitude of already existing harmonic components
with order numbers μ = 5, 7, 11, 13, … in the machine phase currents. Especially the fifth and the
seventh harmonic of the stator current are increased, Figures 7a and 9b [14,15,19,20]. The relation
between the boost rectifier duty cycle and the voltage ratio is given by the equation below:

                                                      = 1− ,                                                  (4)

where, Vi is the input voltage, Vdc is the DC output voltage and d the duty cycle. By (4), it is revealed
that the voltage ratio and the duty cycle are inversely proportional variables. Thus, when the voltage
ratio presents a reduction, the duty cycle presents increment. As is it referred in [21], when the ratio
of Vi/Vdc is small, the stator current waveform has a shape closer to sinusoidal which means smaller
harmonic content. Figure 9b depicts that the PWM current harmonics amplitude raises with the
decrease of PWM duty cycle [32]. The increased harmonic amplitudes increase the stress of the
machine and the deformation of the output voltage and current waveforms. So, a precise estimation,
using proper simulation tools, is needed.

      Figure 8. Waveforms of: (a) the output open loop DC voltage for a resistive load equal to 10 Ω and
      various duty cycles: (green line—70%, blue line—50%, red line—30%), (b) The distribution of Bmod for
      the nominal speed and 50% duty cycle.

      Figure 9. Waveforms for various duty cycles of: (a) the stator current of phase A versus time for the
      open loop system, (b) the phase current spectrum of the phase currents of the machine. (green line—
      70%, blue line—50%, red line—30%).

    As it is seen above, when a PMSG supplies a rectifier, like in wind generation systems, the
generator operation is influenced by the induced in the stator windings voltage and current
harmonics [19]. The time harmonics, which are introduced, not only distort the current waveform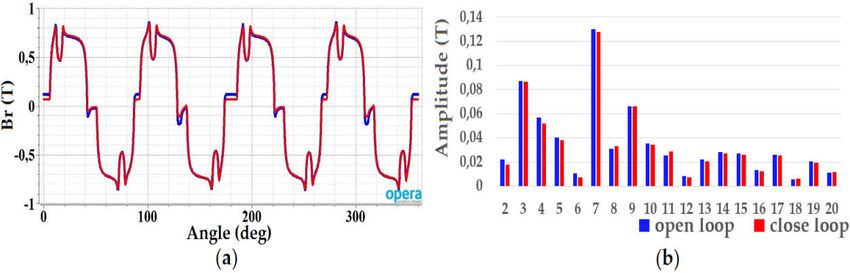
Energies 2018, 11, 3404                                                                                       9

[14,15,19–21], but also lead to the increment of the losses [19,33,34]. The losses of the machine due to
the converter operation overheat the PMSM and affect its operation degrading the generator
reliability and efficiency. In Table 1 the copper losses, the iron losses and the generator efficiency are
quantified when the duty cycle changes. In all cases both the rotor speed and the switching frequency,
fs, remain invariable with values 3000 rpm and 10 kHz respectively. Observing the Table 1 values, it
emerges that the increment of the duty cycle provokes the increment of the copper losses. On the
contrary the iron losses present decrement [11,32]. If a comparison between the iron losses reduction
and the corresponding increment of the copper losses is made, it will be observed that the first
variation is much smaller. Actually the change of the duty cycle has greater influence on the copper
losses. Finally, it can be observed that the generator has the best efficiency for duty cycle equal to 50%.

      Table 1. Copper, Iron Losses and Efficiency for the Open Loop System for Different Duty Cycles and
      Constant Rotor Speed.

                          Duty Cycle (%)   Copper Losses (W)    Iron Losses (W)    η (%)
                                70              143.77                4.90         70.14
                                50              23.73                 5.17         86.23
                                30               8.89                 5.23         77.42

    Figure 10a presents the iron losses versus harmonic order for the three selected duty cycles,
while in Figure 10b the basic harmonic is omitted in order to focus on the behavior of the higher
harmonic components when the duty cycle changes. It can be observed that the basic harmonic
reduces when the duty cycle increases, while the higher order harmonics increase.

      Figure 10. Total iron losses versus harmonic order for different duty cycles (green line—70%, blue
      line—50%, red line—30%): (a) the full spectrum from the first to the tenth harmonic, (b) the spectrum
      without the basic harmonic for better clarity, focusing on higher order harmonics.

     Figure 11 depicts the values of the three iron loss components resulting by using the loss
separation equation of Steinmetz-Bertotti. The implementation of the above theorem in the FEM
software is made by inserting the essential command files. All the iron loss components present
reduction with the increment of the duty cycle. If the three iron loss components are compared, it can
be observed that the eddy current losses have the greatest value, while the excess losses have the
minimum value.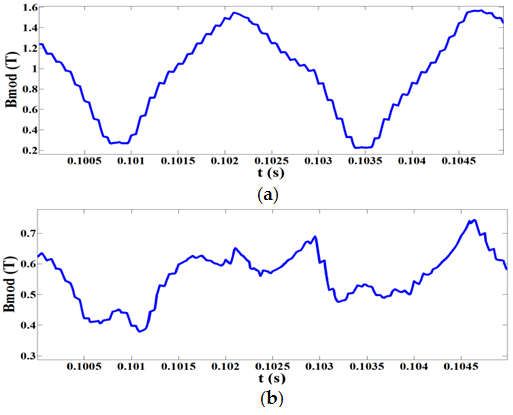
Energies 2018, 11, 3404                                                                                        10

     In Table 2 the copper losses, the iron losses and the efficiency are presented for three different
rotor speeds when the duty cycle is 50% and the output load is invariable. The increment of the rotor
speed leads to increment on both loss terms [35]. The best efficiency is achieved when the rotor rotates
with the nominal speed.

      Figure 11. Total iron losses versus duty cycle for 3000 rpm rotor speed (blue line—hysteresis losses,
      red line—eddy current losses, green line—excess losses).

      Table 2. Copper, Iron Losses and Efficiency for the Open Loop System for Different Rotor Speeds and
      Constant Duty Cycle.

                            n (rpm)   Copper Losses (W)      Iron Losses (W)    η (%)
                             2000          10.27                   2.57         83.25
                             2500          15.58                   3.77         85.70
                             3000          23.73                   5.17         86.23

     Figure 12a presents the iron losses versus harmonic order for the three above rotor speeds, while
in Figure 12b the basic harmonic is omitted in order to focus on the behavior of the higher harmonic
components when the rotor speed changes. It can be seen that when the speed increases all the
harmonic iron loss components increase also.

      Figure 12. Total iron losses versus harmonic order for different rotor speeds (blue line—3000 rpm, red
      line—2500 rpm, green line—2000 rpm): (a) the full spectrum from the first to the tenth harmonic, (b)
      the spectrum without the basic harmonic for better clarity, focusing on higher order harmonics.

     Observing Figure 13 it can be seen that the eddy current losses have the greatest contribution to
the total iron losses, while the excess losses have the minimum contribution. When the speed rises,
the eddy current losses present greatest variation compared to the hysteresis losses. This is logical
Energies 2018, 11, 3404 11
because according to Equation (2) the hysteresis losses have proportional relationship with the
frequency, while the eddy current losses have proportional relationship with the frequency square.
Consequently, when the operating frequency increases, the eddy current losses increase more than
the hysteresis losses [36].
Figure 13. Total iron losses versus rotor speed for 50% duty cycle (blue line—hysteresis losses, red
line—eddy current losses, green line—excess losses).
5.3. Close Loop Control of the System
In this section a close loop control has been applied, as it is seen in Figure 1. In this control
scheme the duty cycle is not constant, but it is modulated by the PI controller, as described previously.
The switching period Ts remains constant, while the conducting time interval of the switch, ton,
changes as it is determined by the close loop control. The electromagnetic variables of the machine in
the steady state of the close loop operation and the waveform of the output close loop DC voltage,
when the load varies, are studied. In order to study the operation of the control scheme a variation
of the load was imposed. At time t1 the load decreases from 10 Ω to 5 Ω and at time t2 the load is
reestablished in 10 Ω. Using the aforementioned close loop control, the DC output voltage of 50 V
with small fluctuations, independent from the load changes, is achieved as Figure 14a presents. The
rise time is small enough, so that the system is driven fairly quickly in steady state. Figure 14b
presents the distribution of the absolute value of the magnetic flux density (Bmod) for the close loop
system. The comparison between Figures 8b and 14b, reveals that in the case of the open loop control
the machine is more saturated.
Figure 14. Waveforms of: (a) the output closed loop voltage for a resistive load equal to 10 Ω and
nominal speed where there is a change in load from 10 Ω to 5 Ω during the time period 0.1–0.18 s, (b)
The distribution of Bmod for the close loop system.
In Figure 15a the machine phase current is depicted, while in Figure 15b the corresponding phase
current spectrum is shown. Both stator current waveform and spectrum for the close loop system
compared with the ones of open loop system with 50% duty cycle. In both simulations the speed is
constant at 3000 rpm. The rectifier input current exhibits a large fifth-order harmonic, although the
seventh-order harmonic presents a slight reduction compared with the open loop control system, asEnergies 2018, 11, 3404 12
shown in Figure 15b. Additionally, the second order harmonic component is missing when open loop
voltage control is used, while it is significantly increased in the case of the close loop control. Table 3
compares the efficiency for the different output resistive loads when an open and a close loop is
implemented respectively. From the simulation results it emerges that the efficiency is increased with
the close loop control. This is an advantage of the close loop control implementation, as the losses
that cause fatigue and overheating to the machine reducing its lifetime are reduced. For all the
resistive load values, the increment of efficiency, in close loop control, is in the range of 3 to 5%
comparing with the corresponding ones in the open loop control.
Figure 15. Waveforms of: (a) the stator current of phase A versus time for the close loop system, (b)
the phase current spectrum (blue line—open loop system, red line—close loop system).
Table 3. Efficiency Comparison for Open and Close Loop System for Different Loads.
R0 (Ω) ηOL (%) ηCL (%)
4 80.33 83.24
6 83.61 86.45
8 85.61 87.98
10 86.23 90.94
In Figure 16a the waveforms of the radial component of the magnetic field flux density in the
middle of the airgap for both open and close loop control schemes are compared. In Figure 16b the
corresponding harmonic spectra are depicted. The first harmonic is neglected in Figure 16b for clarity
purposes. Comparing the spectra one concludes that the amplitude of most magnetic field harmonics
is minimally reduced when the close loop control is applied.
Figure 16. Comparison of the open and close loop system: (blue line—open loop system, red line—
close loop system) (a) The radial component of the magnetic field flux density in the middle of the
airgap, (b) The corresponding harmonic spectrums.
The copper, iron losses and the efficiency are presented in Table 4 for the close loop system.
These values compared with the ones of the open loop system (Table 2—3000 rpm), reveal that in the
case of closed loop the copper losses are reduced significantly, the iron losses seem to remain almost
invariable, while the generator efficiency increases.Energies 2018, 11, 3404 13
Table 4. Copper, Iron Losses and Efficiency for Close Loop System.
Copper Losses (W) Iron Losses (W) η (%)
8.75 5.24 90.94
Figure 17 compares the iron losses harmonic spectra for the cases of open loop system with 50%
duty cycle and the close loop system. In both simulations the speed is constant at 3000 rpm. The first
harmonic is missed out in Figure 17 for better clarity. It can be observed that although the iron losses
are almost invariable when the close loop control is implemented, in comparison with the open loop
control, the amplitude of some harmonic components changes. More specifically, the variation is
evident in odd harmonics (3th, 5th, 7th) that present reduction on the case of the close loop control.
Figure 17. Total iron losses versus harmonic order (blue line—open loop, red line—close loop).
In Figure 18 the total iron losses divided into the three components are presented. Likewise with
the results in the open loop control section, the eddy current losses have the major contribution on
the total losses, the excess losses have the smallest part and the hysteresis losses are located in the
middle.
Figure 18. The three losses terms that create the total iron losses for the close loop system.
6. Losses Due to the Rotating Magnetic Field
In order the issue of the rotating magnetic field to be addressed, two alternating fields have to
be considered. One field with maximum value the maximum value of the rotational field (Bmax) and
a second field with maximum value the minimum value (Bmin) of the rotational field. Figure 19 depicts
the expected form of the geometrical locus in the machine. In this section, two regions of the stator
core are selected, as it can be seen from Figure 20 and both the magnetic induction waveforms and
the geometrical locus of the vector Bt versus Br are investigated for these regions. The rotating
magnetic field appears as the geometrical locus of the Bt versus Br and it will have the shape of a circle
or an ellipsis.
When the Bmin has zero value, it means that in this region the magnetic field is not rotating but
only alternating and the geometrical locus is a straight line. The locus becomes a circle, in the caseEnergies 2018, 11, 3404 14
that the two fields are equal. The changes of the shape of the geometrical locus are quite important,
since additional core losses are created by the rotational magnetic field which cannot be estimated
using Equation (2). Indeed, keeping Bmax unchanged, Bmin can vary on the range [0, Bmax], the locus
changes from a line to a circle, and the iron losses increase in relation with the change of Bmin [25].
Figure 19. Elliptical locus in the rotating machine [25].
Figure 20. The two regions (1, 2) of the stator in which the magnetic induction and the geometrical
locus are computed.
In Figure 21 the absolute value of the magnetic induction versus time is depicted for the two
different regions, while in Figure 22 the corresponding variation of Bt versus Br over one electrical
period is presented. The study is referred to open loop system with 50% duty cycle and nominal rotor
speed 3000 rpm. By Figure 22, it can be observed that the rotational vector of the magnetic induction
creates extra iron losses in the generator. Indeed, the losses in the machine region where the machine
induction value falls to zero periodically are not the same with the ones of a region where the machine
induction has the same maximum value but it doesn’t fall to zero. Consequently in the region 1 the
geometrical locus is an ellipsis and the magnetic induction presents space rotation. In the case of the
region 2 the ellipsis increases and the locus shape looks like to a circle. Obviously, in both cases the
vector of the magnetic induction has no zero value, while concurrently it presents space rotation.Energies 2018, 11, 3404 15
Figure 21. The absolute value of the magnetic induction versus time for an open loop control with
50% duty cycle and rotor speed 3000 rpm: (a) Region 1, (b) Region 2.
Figure 22. Magnetic induction geometrical locus for an open loop control with 50% duty cycle and
rotor speed 3000 rpm: (a) Region 1, (b) Region 2.
Therefore, in order to compute the total iron losses, one major direction in the geometrical locus
that will be the dominant should be taken into account and one minor direction also. The total iron
losses are the sum of the iron losses in the major and the minor direction. Thus, the classical equation
of Steinmetz-Bertotti should be rewritten by taking into account the two fields:
Pfe= Ph+ Pe+ Pa= ρfekhfBmaxα+ρfekhfBminα+ρfekef2Βmax2+ρfekef2Βmin2+ρfekaf1.5Bmax1.5+ ρfekaf1.5Bmin1.5, (5)
The total iron losses resulting from the addition of the rotating magnetic field losses are
presented in Table 5. The results of Table 5 have been exported using Equation (5) in which the
existence of one major and one minor field is considered. The losses resulting from the rotating
magnetic field are small, as it was expected.
Table 5. Total Iron Losses When the Losses Due to Rotating Magnetic Field Taken into Account.
Hysteresis Losses (W) Eddy Current Losses (W) Excess Losses (W)
Without Rotating Magnetic Field 1.18 3.45 0.54
Rotating Magnetic Field 0.09 0.40 0.06
Total Losses 1.27 3.85 0.60Energies 2018, 11, 3404 16
7. Conclusions
In this paper, the performance of a PMSG system, appropriate for wind power applications is
studied. Furthermore, the copper and iron losses are estimated. The iron losses are estimated with
the use of the Steimetz-Bertotti loss separation equation. Moreover, the iron losses due to the rotating
magnetic field are also taken in to account. The PMSG is simulated using FEA, thus the results are
more accurate and an electromagnetic insight of the machine can be determined. The validation of
this FEM model has been done by setting up in the laboratory an experimental system and comparing
the simulation with experimental results. Firstly, the PMSG without a converter connection is
investigated. Two models, with asymmetric and symmetric magnets mounted on rotor, are
compared. The emphasis is given on the ability of the FEM analysis to obtain qualitatively and
quantitatively more accurate results. These results cannot be obtained using Simulink machine
models, because this kind of software cannot simulate the machine in detail. From the comparison
between the asymmetric and the symmetric model of the generator it is shown that the asymmetric
model has more sinusoidal input currents with smaller harmonic component and smaller cogging
torque. Secondly, the PMSG coupled with the three-phase single switch boost rectifier is investigated.
An open loop control has been implemented to the converter switch which keeps the duty cycle
constant. The rectifier increases the harmonics in the machine phase currents which have been
estimated and discussed. Especially the fifth and the seventh harmonic are increased when the
generator is connected to the rectifier and an open loop control scheme is applied. Moreover, the
reduction of the PWM duty cycle leads to current harmonics increment and copper losses reduction.
In opposition the iron losses are increased when the duty cycle reduces, but the increment is small
compared to the copper losses reduction. Regarding the generator efficiency the greatest value is
achieved for 50% duty cycle and rotor speed at its nominal value. The increment of the speed leads
to both copper and iron losses increment. Then, a close loop control has been applied to the converter
switch. The close loop control scheme leads to a slight reduction of the seventh-order harmonic,
although the fifth harmonic of the machine phase current remains high. Furthermore, the efficiency
presents increment in the case of close loop control. The waveforms of the radial component of the
magnetic field flux density in the middle of the airgap and the corresponding harmonic spectrums
for both open and close loop control schemes are compared. The comparison shows that the
amplitude of most magnetic field harmonics is slightly reduced when the close loop control is
applied. The copper losses present remarkably reduction. The iron losses maintained almost
invariable, but the amplitude of the iron losses associated with odd harmonics (3th, 5th, 7th) present
reduction in the case of the close loop control. Moreover, the existence of the rotating magnetic fields
leads to extra machine losses. To conclude, in both open and close control simulations, the eddy
current losses have the major contribution on the total iron losses, and the excess losses have the
minor contribution.
The significance of this work lies in the fact that by using a detailed analysis of the machine,
using FEM, at the design stage, the electromagnetic results can be accurately obtained in order to
choose the most essential configuration for the whole system. An important outcome is that by using
the close loop control it is possible to achieve less losses and greater efficiency of the machine, while
the research in the field of control techniques can be expanded. In a next step the losses on the
magnets can be added in order to have the full impact of the losses in machines efficiency, as the early
estimation of the losses can prevent generator overheating and damaging. In addition, this study can
be expanded using the full grid connection system. Other future investigation can be the optimization
of the control of the boost rectifier in order to increase further the efficiency or the application of other
control methods and the comparison of these methods and their influence on the machine
electromagnetic behavior. The full grid system will be investigated exclusively using the FEM
software for the machine, unlike most papers on this topic which use simulation tools that simulate
in detail the electric circuits but not the machine.
Author Contributions: The presented work was carried out through the cooperation of all authors. A.C.B.
conducted the research and wrote the paper and J.C.K. supervised the whole study and edited the manuscript.Energies 2018, 11, 3404 17
Funding: This research received no external funding.
Conflicts of Interest: The authors declare no conflict of interest.
References
1. Boldea, I.; Tutelea, L.; Blaabjerg, F. High power wind generator designs with less or no PMs: An overview.
In Proceedings of the 2014 17th International Conference on Electrical Machines and Systems (ICEMS),
Hangzhou, China, 22–25 October 2014.
2. Polinder, H.; Ferreira, J.A.; Jensen, B.B.; Abrahamsen, A.B.; Atallah, K.; McMahon, R.A. Trends in wind
turbine generator systems. IEEE J. Emerg. Sel. Top. Power Electron. 2013, 1, 174–185,
doi:10.1109/JESTPE.2013.2280428.
3. Goto, H.; Guo, H.J.; Inchinokura, O. A micro wind power generation system using permanent magnet
reluctance generator. In Proceedings of the 2009 13th European Conference on Power Electronics and
Applications (ECPEA), Barcelona, Spain, 8–10 September 2009.
4. Novakovic, B.; Duan, Y.; Solveson, M.; Nasiri, A.; Ionel, D.M. Multi-physics system simulation for wind
turbines with permanent magnet generator and full conversion power electronics. In Proceedings of the
2013 13th IEEE International Conference on Electrical Machines and Drives (IEMDC), Chicago, IL, USA,
12–15 May 2013.
5. Novakovic, B.; Duan, Y.; Solveson, M.; Nasiri, A.; Ionel, D.M. Comprehensive modeling of turbine systems
from wind to electric grid. In Proceedings of the 2013 5th Annual IEEE Energy Conversion Congress and
Exposition (ECCE), Denver, CO, USA, 15–19 September 2013.
6. Uma, S.P.; Manikandan, S. Control technique for variable speed wind turbine using PI controller. In
Proceedings of the 2013 1th IEEE International Conference on Emerging Trends in Computing,
Communications and Nanotechnology (ICETCCN), Tirunelveli, India, 25–26 March 2013.
7. Raza, K.S.M.; Goto, H.; Guo, H.J.; Inchinokura, O. Maximum power point tracking control and voltage
regulation of a DC grid-tied wind energy conversion system based on a novel permanent magnet
reluctance generator. In Proceedings of the 2007 10th International Conference on Electrical Machines and
Systems (ICEMS), Seoul, South Korea, 8–10 October 2007.
8. Koreboina, V.B.; Venkatesha, L. Modelling and simulation of switched reluctance generator control for
variable speed wind energy conversion systems. In Proceedings of the 2012 4th IEEE International
Conference on Power Electronics, Drives and Energy Systems (ICPEDES), Bengaluru, India, 16–19
December 2012.
9. Ahmed, N.A.; Al-Othman, A.K.; AlRashidi, M.R. Development of an efficient utility interactive combined
wind/photovoltaic/fuel cell power system with MPPT and DC bus voltage regulation. Electr. Power Syst.
Res. 2011, 81, 1096–1106, doi:10.1016/j.epsr.2010.12.015.
10. Asefa, P.; Bargallo Perpina, R.; Barzegaran, M.R.; Lapthorn, A.; Mewes, D. Load identification of different
Halbach-array topologies on permanent magnet synchronous generators using the coupled field-circuit FE
methodology. Electr. Power Syst. Res. 2018, 154, 484–492, doi:10.1016/j.epsr.2017.08.041.
11. Barmpatza, A.; Pallis, I.K.; Kappatou, J. FEM modeling and study of a permanent magnet synchronous
generator with DC-link voltage control for wind power systems. In Proceedings of the 2015 17th
International Symposium on Electromagnetic Fields in Mechatronics, Electrical and Electronic Engineering
(ISEF), Valencia, Spain, 10–12 September 2015.
12. Barmpatza, A.C.; Kappatou, J.C. PWM influence on the losses of a PMSG supplying a boost rectifier. In
Proceedings of the 2016 22th International Conference on Electrical Machines (ICEM), Lausanne,
Switzerland, 4–7 September 2016.
13. Tudorache, T.; Melcescu, L.; Popescu, M. Methods for cogging torque reduction of directly driven PM Wind
generators. In Proceedings of the 2010 12th International Conference on Optimization of Electrical and
Electronic Equipment (ICOEEE), Basov, Romania, 20–22 May 2010.
14. Kolar, J.W.; Ertl, H.; Zach, F.C. Space vector-based analytical analysis of the input current distortion of a
three-phase discontinuous-mode boost rectifier system. IEEE Trans. Power Electron. 1995, 10, 733–745,
doi:10.1109/63.471293.
15. Jangand, Y.; Jovanonic, M. A novel robust harmonic injection method for single-switch three phase
discontinuous-conduction-mode boost rectifiers. IEEE Trans. Power Electron. 1998, 5, 824–834,
doi:10.1109/63.712283.Energies 2018, 11, 3404 18
16. Xu, Z.; Zhang, D.; Wang, F.; Boroyevich, D. Unified control for the permanent magnet generator and
rectifier system. In Proceedings of the 2011 26th Annual IEEE Applied Power Electronic Conference and
Exposition (APEC), Fort Worth, TX, USA, 6–11 March 2011.
17. Li, J.; Choi, D.W.; Son, D.-H.; Cho, Y.-H. Effects of MMF harmonics on rotor eddy-current losses for inner-
rotor fractional slot axial flux permanent magnet synchronous machines. IEEE Trans. Magn. 2012, 48, 839–
842, doi:10.1109/TMAG.2011.2173923.
18. Pfingsten, G.; Steentjes, S.; Hombitzer, M.; Franck, D.; Hameyer, K. Influence of winding scheme on the
iron-loss distribution in permanent magnet synchronous machines. IEEE Trans. Magn. 2014, 50,
doi:10.1109/TMAG.2013.2288433.
19. Stiebler, M. Sub-transients in PM synchronous generator with diode rectifier load. In Proceedings of the
2014 21th International Conference on Electrical Machines (ICEM), Berlin, Germany, 2–5 September 2014.
20. Jang, Y.; Jovanonic, M. A Comparative study of single-switch, three-phase, high-power-factor rectifiers.
IEEE Trans. Ind. Appl. 1998, 34, 1327–1334, doi:10.1109/APEC.1998.654033.
21. Yao, K.; Ruan, X.; Mao, X.; Ye, Z. Variable-duty-cycle control to achieve high input power factor for DCM
boost PFC converter. IEEE Trans. Ind. Appl. 2010, 58, 1856–1865, doi:10.1109/TIE.2010.2052538.
22. Krings, A.; Soulard, J.; Wallmark, O. pwm influence on the iron losses and characteristics of a slotless
permanent-magnet motor with SiFe and NiFe stator cores. IEEE Trans. Ind. Appl. 2015, 51, 1457–1484,
doi:10.1109/TIA.2014.2354735.
23. Juergens, J.; Ponick, B.; Winter, O.; Fricassè, A. Influences of iron loss coefficients estimation on the
prediction of iron losses for variable speed motors. In Proceedings of the 2015 14th IEEE International
Conference on Electrical Machines and Drives (IEMDC), Coeur d’ Alene, ID, USA, 10–13 May 2015.
24. Ibrahim, M.; Pillay, P. Core loss prediction in electrical machine laminations considering skin effect and
minor hysteresis loops. IEEE Trans. Ind. Appl. 2014, 49, 2061–2068, doi:10.1109/TIA.2013.2260852.
25. Huang, Y.; Dong, J.; Zhu, J.; Guo, Y. Core loss modeling for permanent-magnet motor based on flux
variation locus and finite-element method. IEEE Trans. Magn. 2012, 48, 1023–1026,
doi:10.1109/TMAG.2011.2174201.
26. Kim, W.; Kim, J.M.; Seo, S.W.; Ahn, J.H.; Hong, K.; Choi, J.Y. core loss analysis of permanent magnet linear
synchronous generator considering the 3-D flux path. IEEE Trans. Magn. 2018, 54,
doi:10.1109/TMAG.2017.2751076.
27. Hwang, S.W.; Lim, M.S.; Hong, J.P. Hysteresis torque estimation method based on iron-loss analysis for
permanent magnet synchronous motor. IEEE Trans. Magn. 2016, 52, doi:10.1109/TMAG.2016.2528998.
28. Tudorache, T.; Trifu, I. Permanent-magnet synchronous machine cogging torque reduction using a hybrid
model. IEEE Trans. Magn. 2012, 48, 2627–2632, doi:10.1109/TMAG.2012.2198485.
29. Bianchini, C.; Immovilli, F.; Lorenzani, E.; Bellini, A.; Davoli, M. Review of design solutions for internal
permanent-magnet machines cogging torque reduction. IEEE Trans. Magn. 2012, 48, 2685–2693,
doi:10.1109/TMAG.2012.2199509.
30. Tsotoulidis, S.; Safacas, A. A sensorless commutation technique of a brushless DC motor drive system using
two terminal voltages in respect to a virtual neutral potential. In Proceedings of the 2012 20th International
Conference on Electrical Machines (ICEM), Marseille, France, 2–5 September 2012.
31. Tsotoulidis, S.; Safacas, A.; Mitronikas, E. A Sensorless Commutation strategy for a brushless DC motor
drive system based on detection of back electromagnetic force. In Proceedings of the 2011 International
Aegean Conference on Electrical Machines and Power Electronics and Electromotion, Joint Conference
(ACEMP), Istanbul, Turkey, 8–10 September 2011.
32. Zhao, N.; Zhu, Z.Q.; Liu, W. Rotor eddy current loss calculation and thermal analysis of permanent magnet
motor and generator. IEEE Trans. Magn. 2011, 47, 4199–4202, doi:10.1109/TMAG.2011.2155042.
33. Ruderman, A.; Reznikov, B.; Busquets-Monge, S. Asymptotic time domain evaluation of a multilevel
multiphase PWM converter voltage quality. IEEE Trans. Ind. Electron. 2013, 60, 1999–2009,
doi:10.1109/TIE.2012.2226413.
34. Ruderman, A. Discussion on effect of multilevel inverter supply on core losses in magnetic materials and
electrical machines. IEEE Trans. Energy Convers. 2015, 30, 1604–1604, doi:10.1109/TEC.2015.2494640 .
35. Boubakera, N.; Matta, D.; Enricia, P.; Nierlichb, F.; Durandb, G.; Orlandinic, F.; Longèrec, X.; Aïgba, J.S.
Study of eddy-current loss in the sleeves and Sm–Co magnets of a high-performance SMPM synchronous
machine (10 kRPM, 60 kW). Electr. Power Syst. Res. 2017, 142, 20–28, doi:10.1016/j.epsr.2016.08.045.Energies 2018, 11, 3404 19
36. Chen, P.; Tang, R.; Tong, W.; Han, X.; Jia, J.; Zhu, X. Analysis of losses of permanent magnet synchronous
motor with PWM supply. In Proceedings of the 2014 17th International Conference on Electrical Machines
and Systems (ICEMS), Hangzhou, China, 22–25 October 2014.
© 2018 by the authors; licensee MDPI, Basel, Switzerland. This article is an open access
article distributed under the terms and conditions of the Creative Commons
Attribution (CC BY) license (http://creativecommons.org/licenses/by/4.0/).You can also read