Impacts of Atmospheric Rivers in Extreme Precipitation on the European Macaronesian Islands
←
→
Page content transcription
If your browser does not render page correctly, please read the page content below
atmosphere
Article
Impacts of Atmospheric Rivers in Extreme
Precipitation on the European Macaronesian Islands
Alexandre M. Ramos 1, * ID , Ricardo M. Trigo 1     ID
                                                         , Ricardo Tomé 1 and
Margarida L. R. Liberato 1,2 ID
 1   Instituto Dom Luiz (IDL), Faculdade de Ciências, Universidade de Lisboa, 1749-016 Lisboa, Portugal;
     rmtrigo@fc.ul.pt (R.M.T.); rftome@gmail.com (R.T.); mlr@utad.pt (M.L.R.L.)
 2   Escola de Ciências e Tecnologia, Universidade de Trás-os-Montes e Alto Douro, 5001-801 Vila Real, Portugal
 *   Correspondence: amramos@fc.ul.pt; Tel.: +351-217-500863

 Received: 27 July 2018; Accepted: 14 August 2018; Published: 20 August 2018

 Abstract: The European Macaronesia Archipelagos (Azores, Madeira and Canary Islands) are struck
 frequently by extreme precipitation events. Here we present a comprehensive assessment on the
 relationship between atmospheric rivers and extreme precipitation events in these three Atlantic
 Archipelagos. The relationship between the daily precipitation from the various weather stations
 located in the different Macaronesia islands and the occurrence of atmospheric rivers (obtained from
 four different reanalyses datasets) are analysed. It is shown that the atmospheric rivers’ influence
 over extreme precipitation (above the 90th percentile) is higher in the Azores islands when compared
 to Madeira or Canary Islands. In Azores, for the most extreme precipitation days, the presence of
 atmospheric rivers is particularly significant (up to 50%), while for Madeira, the importance of the
 atmospheric rivers is reduced (between 30% and 40%). For the Canary Islands, the occurrence of
 atmospheric rivers on extreme precipitation is even lower.

 Keywords: macaronesian archipelagos; extreme precipitation; atmospheric rivers; extended
 winter months

1. Introduction
     Extreme precipitation events (EPEs) occurring in the western Atlantic coast of the Iberian
Peninsula (IP) during the winter months have been historically linked to major socio-economic impacts
such as flooding, landslides, extensive property damage and human casualties. These events are
usually associated to the presence of low pressure systems of Atlantic origin [1–3].
     The analysis of the contribution of atmospheric rivers (ARs) to EPEs has been restricted to a few
areas of the world, with a strong focus on the eastern North Pacific and their associated impacts on the
contiguous North American west coast [4–6]. ARs are characterized for being shallow (1–2.5 km in
height) and narrow (~300–500 km in width) plumes with high water vapour content, stretching over
distances of at least 2000 km, and are often associated with the pre-cold-frontal region of extratropical
cyclones in the region of the warm conveyor belt [7]. In addition, for the North Pacific, it was
shown the role of the East Asian jet stream which exhibits a strong linkage with the total frequency
of ARs that make landfall on the western United States [8]. Over Europe, the large amount of
water vapour (WV) that is usually transported by these ARs can also lead to EPEs and flooding as
described for a few specific extreme events [3,9]. Likewise, ARs also play an important role in a
climatological context [10,11], showing, in particular, that there is a strong relationship between ARs
and the occurrence of annual maxima precipitation days in Western Europe [12]. This relationship is
especially strong along the Western European seaboard, with some areas having eight of their top 10
annual maxima precipitation days related to the occurrence of ARs.

Atmosphere 2018, 9, 325; doi:10.3390/atmos9080325                            www.mdpi.com/journal/atmosphere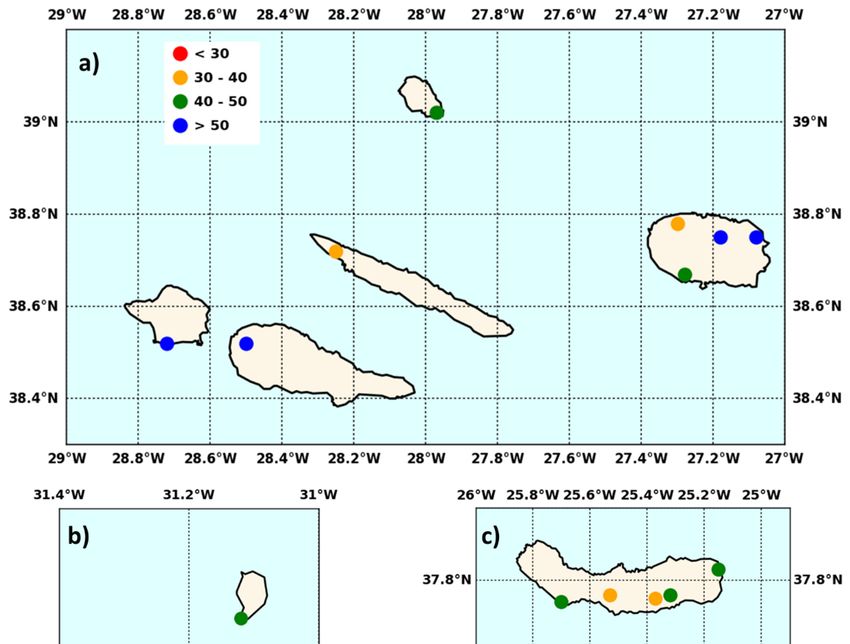
Atmosphere 2018, 9, 325 2 of 15
Atmosphere 2018, 9, x FOR PEER REVIEW 2 of 15
A close look at the work by [13], shows that the frequency of ARs in the North Atlantic basin
is one of Atheclose
highest
look atinthethework
globeby(>12% percent
[13], shows that of
thetime steps)ofwith
frequency a mean
ARs in duration
the North Atlantic ranging
basin is from
14 h (in the mid to high latitudes of North Atlantic) to 20 h (in the tropical part of the North14
one of the highest in the globe (>12% percent of time steps) with a mean duration ranging from h
Atlantic
(in the mid to high latitudes of North Atlantic) to 20 h (in the tropical part of
Ocean). Therefore, it is expected that the ARs have a measurable impact in the European Macaronesian the North Atlantic
Ocean). Therefore,
Archipelagos EPEs. it is expected that the ARs have a measurable impact in the European
Macaronesian Archipelagos EPEs.
The European Macaronesian region consists of the Portuguese Archipelagos of Azores and
The European Macaronesian region consists of the Portuguese Archipelagos of Azores and
Madeira and the Spanish Archipelago of Canary (Figure 1). The three Archipelagos share regional
Madeira and the Spanish Archipelago of Canary (Figure 1). The three Archipelagos share regional
features: a volcanic
features: origin,
a volcanic a contrasting
origin, a contrastinglandscape
landscape andandaagentle
gentleclimate.
climate.
TheThe Azores
Azores Islands
Islands consist
consist
of nine islands located in the middle of the North Atlantic Ocean between 31.5 ◦ W and 25◦ W and
of nine islands located in the middle of the North Atlantic Ocean between 31.5° W and 25° W and
39.2◦39.2°
N and ◦ N, while the Madeira Islands are located further south-east (near 17◦ W and 32.5◦
36.836.8°
N and N, while the Madeira Islands are located further south-east (near 17° W and 32.5°
N). The
N). Canary
The CanaryArchipelago,
Archipelago, in the south-eastern
in the south-easternEuropean
European Macaronesian region,are
Macaronesian region, arelocated
located close to
close
to the African
the African coast between
coast between 18◦ W18°and
W and13.5 ◦ WW
13.5° and29.5
and ◦ N and
29.5° 27.5◦N.N.
and27.5° There
Thereareare
veryvery
few few
studies
studies
looking
looking simultaneously
simultaneously into into several
several of these
of these Macaronesian
Macaronesian Archipelagos,
Archipelagos, although
although it isitworth
is worth
noticing
noticingthat
the studies the do
studies that do [14,15].
[14,15].
Figure 1. Map
Figure of the
1. Map Macaronesian
of the MacaronesianEuropean
European Islands, illustrating
Islands, illustrating their
their location
location within
within the North
the North
Atlantic Ocean.
Atlantic Ocean.
Despite the possible impact of the ARs in EPEs in the European Macaronesian Archipelagos, as
Despite the possible impact of the ARs in EPEs in the European Macaronesian Archipelagos, as far
far as we are aware, there is only one study that systematically analysed the association between EPEs
as we are aware, there is only one study that systematically analysed the association between EPEs
and ARs in the Madeira Islands [16] for a 10 year period derived from satellite imagery. However,
and ARs in studies
several the Madeira Islands
have looked [16] for
in depth intoathe
10 atmospheric
year periodcirculation
derived from satellite
conditions, imagery.
including ARs,However,
that
several studies have looked in depth into the atmospheric circulation conditions, including
led to the 20 February 2010 flash flood in the Madeira Islands, with a death toll of near 50 (e.g., [17]). ARs, that
led to theTherefore,
20 February it is2010 flash flood
of paramount in thetoMadeira
interest Islands, with
have a long-term a death
systematic toll of
study ofthenear 50 (e.g.,of[17]).
influence
Therefore, it is of
ARs in the EPEs inparamount interestMacaronesian
the three European to have a long-term systematic
Archipelagos. To dostudy
so, weof usethe influence of ARs
a precipitation
in thedataset
EPEs incovering
the threeseveral stationsMacaronesian
European located in various islands of each
Archipelagos. Archipelago.
To do so, we useInaaddition, a global
precipitation dataset
AR database using different reanalyses is used in order to access the days of
covering several stations located in various islands of each Archipelago. In addition, a global ARoccurrence of the ARs
in each
database Archipelago.
using The main objectives
different reanalyses is used in of order
this work are tothe
to access evaluate
days the occurrence of
of occurrence and impact
the of each
ARs in
ARs in EPEs on the European Macaronesian Archipelagos for a 30 year period and to evaluate its
Archipelago. The main objectives of this work are to evaluate the occurrence and impact of ARs in
sensitivity to the AR tracking algorithm when using different reanalyses datasets with different
EPEs on the European Macaronesian Archipelagos for a 30 year period and to evaluate its sensitivity to
spatial resolutions.
the AR tracking algorithm when using different reanalyses datasets with different spatial resolutions.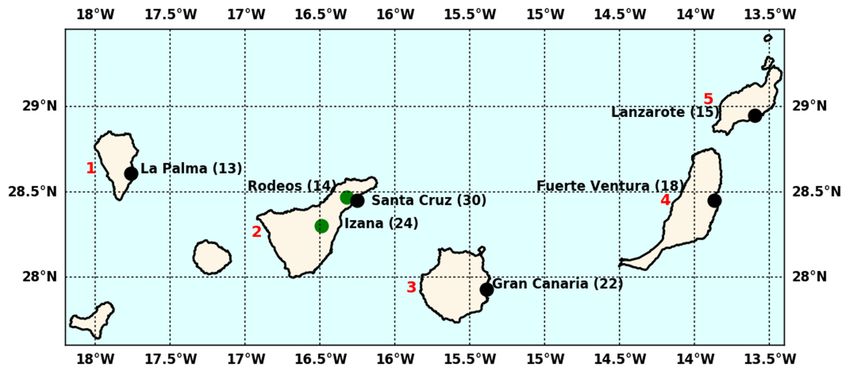
Atmosphere 2018, 9, 325 3 of 15
Atmosphere 2018, 9, x FOR PEER REVIEW 3 of 15
2. Materials and Methods
2. Materials and Methods
2.1. Precipitation Dataset
2.1.
The Precipitation Dataset
precipitation dataset includes daily accumulated data from 31 climatological weather stations
representative of the three
The precipitation European
dataset Macaronesian
includes Archipelagos
daily accumulated data from(Azores, Madeira and
31 climatological Canary)
weather
stations
covering therepresentative
1980 and 2010ofperiod
the three
(for European
the extended Macaronesian Archipelagos
winter months, October (Azores, Madeira
to March). and
The extended
winter of a certain year n corresponds to October–November–December (OND) of year n −The
Canary) covering the 1980 and 2010 period (for the extended winter months, October to March). 1 and
extended winter of a certain
January–February–March (JFM)year n corresponds
of year n. Overall,tothe
October–November–December
chosen stations were based(OND) of year n − of
on a combination
tests1 for
anddata
January–February–March
length, completeness,(JFM)qualityof and
yearhomogeneity,
n. Overall, the
as chosen stations
in [18,19]. were based
Concerning on a
the Madeira
combination of tests for data length, completeness, quality and homogeneity,
and Azores Islands, the datasets were retrieved from the Portuguese Met Office (IPMA), while the as in [18,19].
Concerning the Madeira and Azores Islands, the datasets were retrieved from the Portuguese Met
Canary dataset was retrieved from the Spanish Met Office (AEMET).
Office (IPMA), while the Canary dataset was retrieved from the Spanish Met Office (AEMET).
For each weather station, we have calculated the deciles of the available data (disregarding values
For each weather station, we have calculated the deciles of the available data (disregarding
below 1 mm/day). These deciles are divided into ten equally spaced bins for later comparison with
values below 1 mm/day). These deciles are divided into ten equally spaced bins for later comparison
the with
ARs the
datasets.
ARs datasets.
2.1.1. Azores
2.1.1. Archipelago
Azores Archipelago
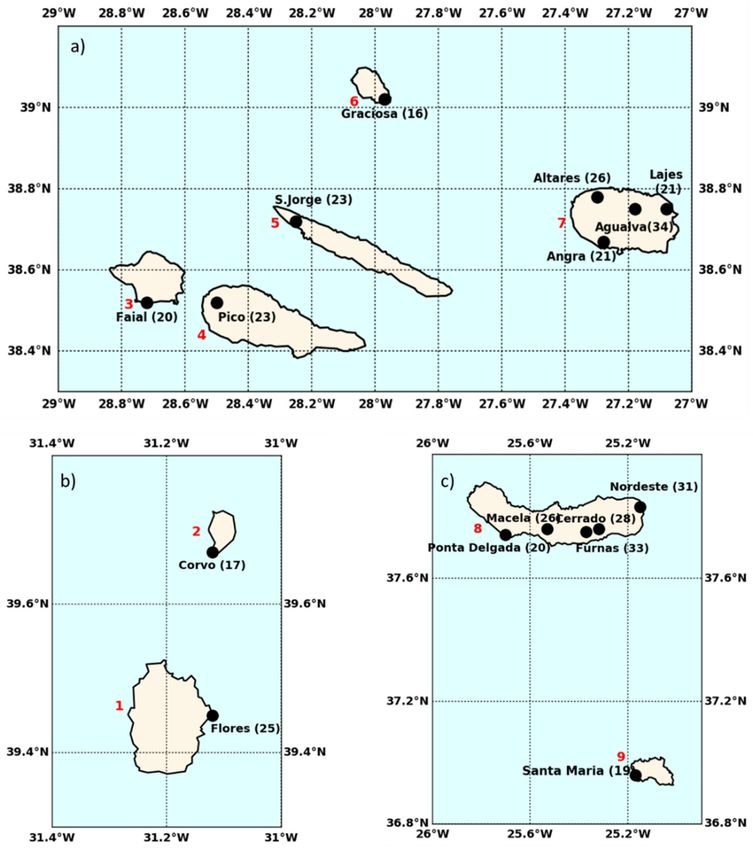
Regarding
RegardingthetheAzores
Azores(Figure
(Figure2,2, Supplementary Table S1),
Supplementary Table S1),1616weather
weatherstations
stations
werewere
usedused
embracing all nine islands. From the central group, including the islands Faial, Pico,
embracing all nine islands. From the central group, including the islands Faial, Pico, São Jorge,São Jorge,
Graciosa andand
Graciosa Terceira, wewe
Terceira, managed
managedtotoretrieve
retrieveeight
eight weather stations(Figure
weather stations (Figure2a).
2a).
Figure
Figure 2. 2. Locationofofthe
Location the weather
weather stations
stationsininthethe
Azores
AzoresArchipelago
Archipelagofor each groupgroup
for each of islands: (a)
of islands:
central group; (b) western group and (c) eastern group. In addition, for each station, the information
(a) central group; (b) western group and (c) eastern group. In addition, for each station, the information
regarding
regarding thethe 90th
90th percentile
percentile (mm)ofofthe
(mm) thedaily
daily precipitation
precipitation isisalso
alsoshown
shownbetween
betweenbrackets. TheThe
brackets. ninenine
Azores Islands are highlighted in red numbers: 1. Flores, 2. Corvo, 3. Faial, 4. Pico, 5. São Jorge, 6.
Azores Islands are highlighted in red numbers: 1. Flores, 2. Corvo, 3. Faial, 4. Pico, 5. São Jorge,
Graciosa, 7. Terceira, 8. São Miguel and 9. Santa Maria.
6. Graciosa, 7. Terceira, 8. São Miguel and 9. Santa Maria.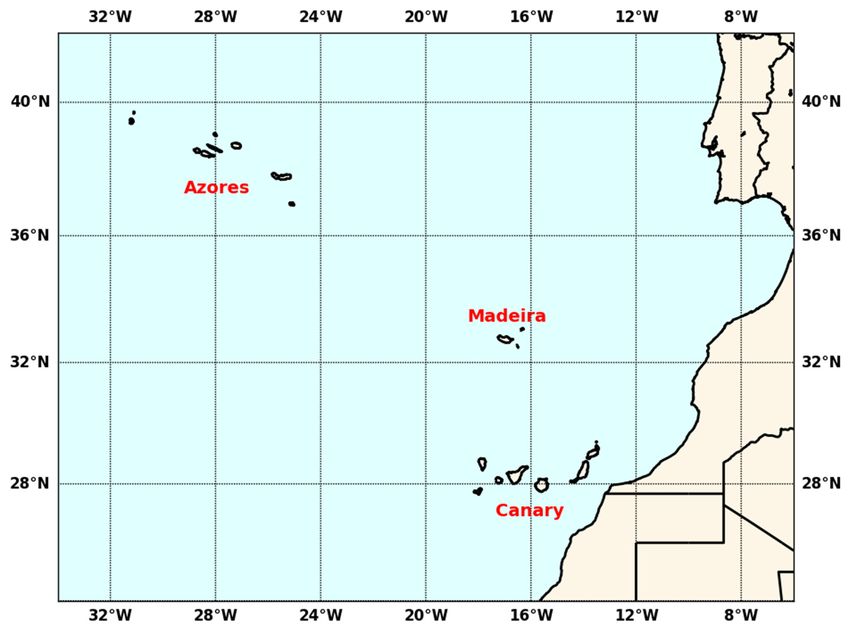
Atmosphere 2018, 9, x FOR PEER REVIEW 4 of 15
Atmosphere 2018, 9, 325 4 of 15
From the western group of the Azores, with two islands (Flores and Corvo), the weather stations
located at each
From airport group
the western were used
of the(Figure
Azores,2b), while
with twofrom the(Flores
islands easternand
group of the
Corvo), theAzores,
weatherincluding
stations
the islands of São Miguel and Santa Maria, six weather stations were analysed (Figure 2c).
located at each airport were used (Figure 2b), while from the eastern group of the Azores, including Despite its
important
the islandsorographic
of São Miguelfeatures, noneMaria,
and Santa of the six
weather stations
weather analysed
stations in the different
were analysed (Figureislands were
2c). Despite
located above 600 m, due to the lack of data with sufficient long-term series.
its important orographic features, none of the weather stations analysed in the different islands were
located above 600 m, due to the lack of data with sufficient long-term series.
2.1.2. Madeira Archipelago
2.1.2.For
Madeira Archipelago
the Madeira Archipelago (Figure 3, Supplementary Table S2) we have used eight weather
stations
For (seven in Madeira
the Madeira Island and
Archipelago one 3,
(Figure in Supplementary
Porto Santo). In Table
the case
S2) of
wethe Madeira
have Islands,
used eight three
weather
weather stations are placed above 600 m—Bico da Cana (1582 m), Poiso (1360 m) and Santo
stations (seven in Madeira Island and one in Porto Santo). In the case of the Madeira Islands, three da Serra
(668 m), which
weather stationsarearelocated
placedinabove
the centre of Madeira
600 m—Bico Island(1582
da Cana and m),
the highest peakm)
Poiso (1360 at and
1862Santo
m. Thedaisland
Serra
has am),
(668 mean
which altitude of 1220
are located m centre
in the with aofcomplex
Madeira orography withhighest
Island and the steep peak
terrain, and m.
at 1862 therefore the
The island
inclusion of stations at higher altitudes is particularly important to better characterise the
has a mean altitude of 1220 m with a complex orography with steep terrain, and therefore the inclusion impact of
ARs.
of stations at higher altitudes is particularly important to better characterise the impact of ARs.
Figure 3. Similar to Figure 2 for
for the
the Madeira
Madeira Archipelago.
Archipelago. The two Madeira Islands are highlighted
in red numbers: 1. Madeira
numbers: Madeira and 2. Porto Santo. In addition,
Porto Santo. In addition, the
the locations
locations that
that are
are above
above 600 m are
highlighted in green dots
2.1.3. Canary Archipelago
Finally,the
Finally, theCanary
Canarydataset
dataset(Figure
(Figure
4, 4, Supplementary
Supplementary Table
Table S3) S3) consists
consists of sixofweather
six weather stations
stations from
from
the thelargest
five five largest
islands islands (La Tenerife;
(La Palma; Palma; Tenerife; GranFuerte
Gran Canaria; Canaria; Fuerte
Ventura andVentura and Similarly
Lanzarote). Lanzarote).to
Similarly
the Azores, tomost
the Azores, most ofstations
of the weather the weather stations
are located atare
the located
airports,atnamely
the airports, namelyGran
in La Palma, in LaCanaria,
Palma,
Gran Canaria,
Fuerte VenturaFuerte Ventura and
and Lanzarote. Lanzarote.
However, However,
the Island the Island
of Tenerife of Tenerife is by
is characterized characterized by a
a large volcano
large volcano
mountain mountain
(Teide) (Teide) with
with maximum maximum
height of 3718 m,height
and of
we3718
hadm, and to
access wethree
had access
weather tostations
three weather
(Santa
stations
Cruz, (Santa
Izanã andCruz, Izanãwhere
Rodeos), and Rodeos), whereare
two of them two of them
located are located
above 600 m: above
Izaña 600
(2367m:m)
Izaña
and(2367
Rodeosm)
and Rodeos
(617 m). (617 m).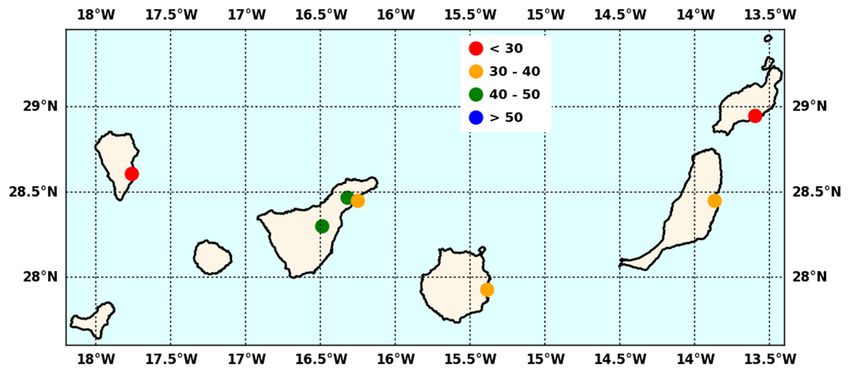
Atmosphere 2018, 9, 325 5 of 15
Atmosphere 2018, 9, x FOR PEER REVIEW 5 of 15
Figure 4. Similar to Figure 2 for the
4. Similar the Canary
Canary Archipelago. The five Canary Islands where data is
Archipelago. The
available are highlighted in red
red numbers:
numbers: 1. La Palma, 2. Tenerife, 3. Gran Canaria, 4. Fuerte Ventura
and 5. Lanzarote. In addition, the locations that are above 600 m are
are highlighted
highlighted in
in green
green dots.
dots.
2.2. Atmospheric Rivers Dataset
The ARs detection scheme developed at the global scale by [13] is used here. For this method,
there is no no need
need for
for aa reference
reference starting
starting point
point toto search
search for for the
the ARs;
ARs; instead,
instead, thethe method
method isolates
isolates
contiguous regions
contiguous regionsofof thethe world
world withwithenhancedenhanced vertically
vertically integrated integrated
horizontal horizontal
water vapour watertransport
vapour
transport
(IVT) (IVT) exceeding
exceeding a certain IVTa certain
thresholdIVT (>85th
threshold (>85th percentile
percentile or 100 kg m − 1
or 100− 1
s kg m s , whichever
−1 −1
, whichever is
is greater).
greater).
Each Eachregions
of these of these areregions are subsequently
subsequently analysed toanalysed to verify
verify if they if they
fulfil the fulfil the
geometry geometry
requirements
requirements
of length >2000 of km,
length >2000 km, length/width
length/width ratio >2 andratio other>2considerations
and other considerations
indicative ofindicative of AR
AR conditions.
conditions.
For additionalForinformation
additional information
regarding the regarding the methodology,
methodology, please referpleaseto [13].refer
Thetodatabases
[13]. The used
databases
here
used kindly
were here were kindlyby
provided provided by these authors.
these authors.
The global
globalARs ARsdatabase
database consists of four
consists of different sets, each
four different oneeach
sets, corresponding to the application
one corresponding to the
of the method
application of [13]
of the to four
method different
of [13] to fourreanalyses: (ERA-Interim
different reanalyses: with 1.5° ×with
(ERA-Interim 1.5° 1.5 ◦ × 1.5
spatial ◦ spatial
resolution;
Climate Forecast
resolution; System System
Climate Forecast Reanalysis (CFSR)(CFSR)
Reanalysis with with
0.5° 0.5× ◦0.5° ◦ spatialresolution;
× 0.5spatial resolution; Modern-Era
Retrospective analysis
Retrospective analysis forfor Research
Researchand andApplications,
Applications,VersionVersion22(MERRA-2)
(MERRA-2)with with0.625
0.625°◦ ×× 0.5
0.5°◦ spatial
resolution and
resolution and NCEP/NCAR
NCEP/NCAR with 2.5 ◦
2.5° ×× 2.5° ◦
2.5 spatial
spatialresolution)
resolution)between
between 19801980 and
and 2010
2010 for the winter
extended months (October to March) at a six-hourly temporal
extended months (October to March) at a six-hourly temporal resolution. The use of multiple resolution. The use ofreanalyses
multiple
reanalyses
is advisable,isinstead
advisable, instead of
of recurring to recurring to a single
a single reanalysis, in reanalysis,
order to ensure in order
moretorobust
ensure more In
results. robust
fact,
results.the
unlike In large
fact, Mediterranean
unlike the large Mediterranean
Islands, the European Islands, the European
Macaronesian Macaronesian
Islands are relativelyIslands are
small and
relatively small and therefore changes in the resolution of the reanalyses datasets,
therefore changes in the resolution of the reanalyses datasets, among others, could influence the results. among others,
could
It influence
is also important thetoresults.
highlightIt is also
that important
despite using totwohighlight that despite
high resolution using(MERRA2
reanalyses two high and resolution
CFSR),
reanalyses
most of the (MERRA2
islands in theanddifferent
CFSR), most of the islands
Archipelagos are notin resolved
the differentby theArchipelagos
four reanalyses,are not resolved
limiting the
by the fourregarding
discussion reanalyses, thelimiting
impactsthe discussion
at higher regarding
altitudes [11,20]the impacts
or even the ARat higher altitudes [11,20]
axis orientation [21]. or
even the AR axis orientation [21].
2.3. Relationship between Atmospheric Rivers and Precipitation
2.3. Relationship
In order to between Atmospheric
extract the ARs that Rivers and each
influence Precipitation
island, we have located the nearest grid point of
the different
In orderreanalyses datasets
to extract the relative
ARs that to the each
influence centre of each
island, weisland. Afterwards,
have located for each
the nearest six-hourly
grid point of
time step between 1980 and 2010, we check if that grid point was classified as an AR, obtaining
the different reanalyses datasets relative to the centre of each island. Afterwards, for each six-hourly a list of
days for each
time step island1980
between thatand
was2010,
under wethe influence
check if thatof ARs.
grid point was classified as an AR, obtaining a list
Regarding
of days for eachthe precipitation
island days, as
that was under thementioned
influence of in ARs.
Section 2.1, we have divided the precipitation
distribution
Regardingfor the
each weather station
precipitation days,inasdeciles (ten equally
mentioned in Sectionspaced percentile
2.1, we bins, the
have divided ignoring values
precipitation
below 1 mm/day).
distribution for each Soweather
the first station
decile bin would include
in deciles the days
(ten equally thatpercentile
spaced have precipitation between
bins, ignoring the
values
0below
percentile and 9 percentile,
1 mm/day). So the firstwhile
decilethe
binsecond
wouldbin would
include theinclude precipitation
days that days falling
have precipitation between
between the
0 percentile and 9 percentile, while the second bin would include precipitation days falling between
10th percentile and 19th percentile, until the last decile bin which will include the most extreme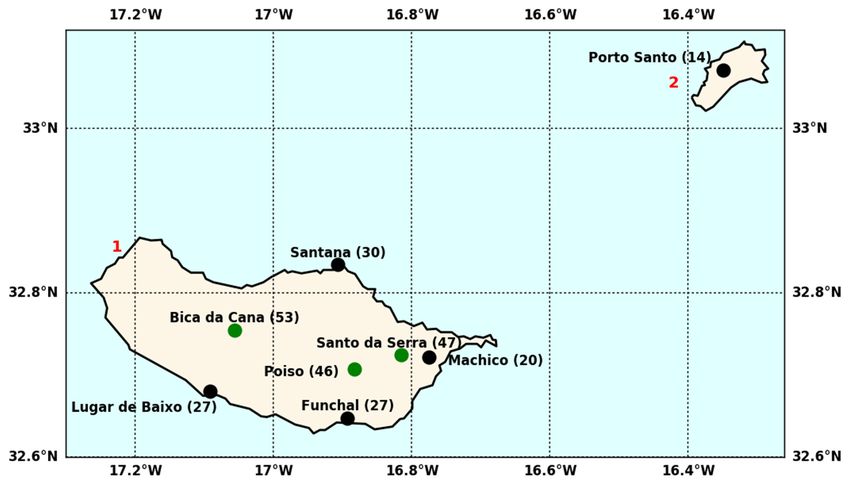
Atmosphere 2018, 9, 325                                                                                            6 of 15
Atmosphere 2018, 9, x FOR PEER REVIEW                                                                              6 of 15

10th percentile
precipitation      and i.e.,
                days,    19thdays
                                percentile, until the last
                                    with precipitation      decile
                                                          ≥90th    bin which
                                                                percentile. Forwill
                                                                                eachinclude
                                                                                       weatherthestation,
                                                                                                   most extreme
                                                                                                           and for
precipitation          i.e., days  with  precipitation   ≥
each decile bin, we cross-check the dates between the precipitation dates within each bin, andand
                days,                                      90th percentile. For each   weather   station,       for
                                                                                                            if they
each decile bin,towe
are associated      ancross-check
                        AR day forthe     dates
                                       each      between
                                            of the         the precipitation dates within each bin, and if they
                                                    four reanalyses.
are associated   to an  AR    day for each  of the four reanalyses.
     Finally, and due to the large amount of results, we have also computed the mean and the
     Finally,
standard      and dueoftothe
          deviation          thefour
                                 largereanalyses
                                       amount offorresults, we have
                                                      the most       also computed
                                                                extreme   days in thethe mean
                                                                                       ≥90th   and the standard
                                                                                             percentile   in order
deviation of  the four  reanalyses   for
to summarise the most important results. the most  extreme  days in the ≥ 90th percentile in order  to summarise
the most important results.
3. Results and Discussion
3. Results and Discussion
     This section is organized into three main sub-sections. Section 3.1 provides a brief overview
     This section is organized into three main sub-sections. Section 3.1 provides a brief overview
regarding the EPEs in the Macaronesian Archipelagos, while Section 3.2 focuses on the extended
regarding the EPEs in the Macaronesian Archipelagos, while Section 3.2 focuses on the extended winter
winter ARs frequency between 1980 and 2010. Finally, Section 3.3 summarises the relationship
ARs frequency between 1980 and 2010. Finally, Section 3.3 summarises the relationship between ARs
between ARs and EPEs, especially for the most extreme precipitation days (≥90th percentile).
and EPEs, especially for the most extreme precipitation days (≥90th percentile).
3.1. Precipitation Extremes
3.1. Precipitation Extremes
      In order to give a sense of the magnitude of the EPEs in each of the weather stations, we have
      In order to give a sense of the magnitude of the EPEs in each of the weather stations, we have
computed the deciles of the distribution, being divided into ten equally spaced bins. An example of
computed the deciles of the distribution, being divided into ten equally spaced bins. An example of
the daily precipitation (mm) distribution of the 50th, 60th, 70th, 80th and 90th percentiles
the daily precipitation (mm) distribution of the 50th, 60th, 70th, 80th and 90th percentiles (respectively
(respectively 5th, 6th, 7th, 8th and 9th decile) for three selected locations in each Archipelago (Ponta
5th, 6th, 7th, 8th and 9th decile) for three selected locations in each Archipelago (Ponta Delgada in
Delgada in Azores, Funchal in Madeira and Santa Cruz in Canary) are shown in Figure 5. One can
Azores, Funchal in Madeira and Santa Cruz in Canary) are shown in Figure 5. One can see that for the
see that for the extended winter (October to March), the 50th percentile (5th decile), which
extended winter (October to March), the 50th percentile (5th decile), which corresponds to the median
corresponds to the median of the distribution, is just short of 5 mm in Ponta Delgada, and slightly
of the distribution, is just short of 5 mm in Ponta Delgada, and slightly above 5 mm in Funchal and
above 5 mm in Funchal and Santa Cruz.
Santa Cruz.

      Figure  5. Distribution
      Figure 5.  Distributionofofdaily
                                   dailyprecipitation
                                         precipitation(mm)
                                                       (mm)forfor
                                                                thethe
                                                                     50th, 60th,
                                                                       50th,     70th,
                                                                             60th,     80th
                                                                                    70th,   andand
                                                                                          80th  90th90th
                                                                                                     percentiles for
                                                                                                         percentiles
      three selected
      for three       locations
                 selected       in each
                           locations  in Archipelago:  PontaPonta
                                         each Archipelago:    Delgada    (Azores,
                                                                      Delgada      blue), Funchal
                                                                                (Azores,          (Madeira,
                                                                                          blue), Funchal     green)
                                                                                                          (Madeira,
      and Santa
      green)  andCruz
                   Santa(Canary,  yellow).yellow).
                          Cruz (Canary,

     As expected,
     As  expected, when
                    when higher
                          higher deciles
                                  deciles are
                                          are evaluated,
                                              evaluated, it
                                                         it is
                                                            is possible
                                                               possible to
                                                                        to observe
                                                                            observe aa substantial
                                                                                       substantial increase
                                                                                                    increase
in the value of the precipitation. When   analysing the 90th   percentile (9th decile) there is a difference
in the value of the precipitation. When analysing the 90th percentile (9th decile) there is a difference
of more than 10 mm between Ponta Delgada (near 19 mm) and Santa Cruz (near 30 mm), probably
due to the different nature of the EPEs occurring in each region [15]. While the Azores is located in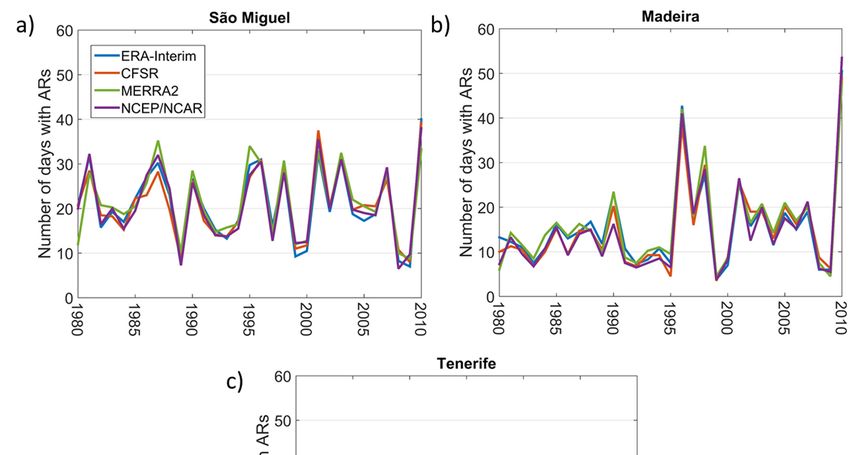
Atmosphere 2018, 9, 325                                                                               7 of 15

of more than 10 mm between Ponta Delgada (near 19 mm) and Santa Cruz (near 30 mm), probably
due to the different nature of the EPEs occurring in each region [15]. While the Azores is located in
the middle of the North Atlantic Ocean, and therefore its precipitation is associated with the main
storm track [22,23], the location of the Canary, on the tropical region, is more prone to convective
precipitation even in winter [24].
      In order to synthesize the EPE information, we have included in Figures 2–4 the information
regarding the 90th percentile (in mm) of each weather station in brackets in its location. Regarding the
Azores Islands (Figure 2), the 90th percentile of the precipitation distribution ranges from 16 mm in
Graciosa airport (10 m) to 33 mm in Furnas, São Miguel (290 m). Regarding São Miguel and Terceira
Island (where we have several stations), it is important to mention the orographic effect due to the
volcano cones usually located in the centre of the island. These orographic features lead to generally
higher values of the 90th percentile in locations with higher altitudes.
      When analysing the Madeira Archipelago (Figure 3), a similar picture emerges with the orographic
effect also playing a role on the 90th percentile of the precipitation distribution. While the higher
altitude locations have values for this percentile that vary between 46 mm and 53 mm, the locations
near the coast reveal lower values between 27 mm in the southern coast and 30 mm in the northern
coast, with the lowest value being found in Machico (20 mm).
      Once again, the vast majority of the weather stations in the Canary (Figure 4) are located near
sea level, with the exception of Izaña and Rodeus (>600 m), located in the Tenerife Island. In this case,
the 90th percentile of the precipitation distribution is relatively low in La Palma, Lanzarote and Fuerte
Ventura with values below 20 mm. Regarding Tenerife, the direct effect of orography seems not to play
a role when analysing the 90th percentile at higher altitude locations of Izaña (14 mm) and Rodeus
(24 mm) when compared with Santa Cruz (30 mm), probably due to Izaña and Rodeus being located
downstream of the Vulcano Teide, and therefore in the shadow and protected from the warm and
humid winds from the west and north-west.

3.2. Atmospheric River Frequency
     For each island, we have extracted the number of AR time steps relative to each reanalysis, taking
into account the closest point of each gridded dataset to the corresponding island (see Section 2.3).
In order to evaluate the number of days under the influence of ARs, the number of AR time steps was
divided by four (corresponding to six-hourly time steps). For the sake of simplicity, the time evolution
of the results from the winter months is summarised in Figure 6 for the islands of São Miguel, Madeira
and Tenerife. On average, São Miguel presents a higher frequency of AR days compared to both
Madeira and Tenerife.
     It is possible to observe strong inter-annual variability on the occurrence of ARs for all three
islands, with a maximum/minimum spanning between circa 10 and 40 AR days for the extended
winter months (180 days) in São Miguel Island, corresponding approximately to 5.5% to 22% of the
winter days. For the eastern Archipelagos (e.g., Madeira and Tenerife), the inter-annual variability is
also noticeable, with a clear ARs maximum activity in the 2010 extended winter peaking to near 45 in
Madeira (25% of the winter days) and near 40 AR days in Tenerife (40% of the winter days).
     Moreover, when analysing the results of Figure 6 and Table S4, it is possible to state that the distinct
spatial resolution of the four different reanalyses (ERA-Interim (blue line); CFSR (red line); MERRA2
(green line) and NCEP/NCAR (purple line)) may influence the frequency of the AR frequencies,
not only in the example given in Figure 6, but also at the different islands of the Archipelagos (Table
S4). A closer look at Table S4 shows that for the Azores Archipelago, the ARs mean frequency using
the NCEP/NCAR reanalysis is in the same range as for the other three reanalyses. However, in the
Madeira and Canary Archipelagos, the ARs mean frequency is lower than the results obtained with
the other three reanalyses. Therefore, the coarsest grid resolution of the NCEP/NCAR seems to have
more impact in the ARs frequency at the southern Archipelagos (Madeira and Canary) than in the
northern Archipelago (Azores).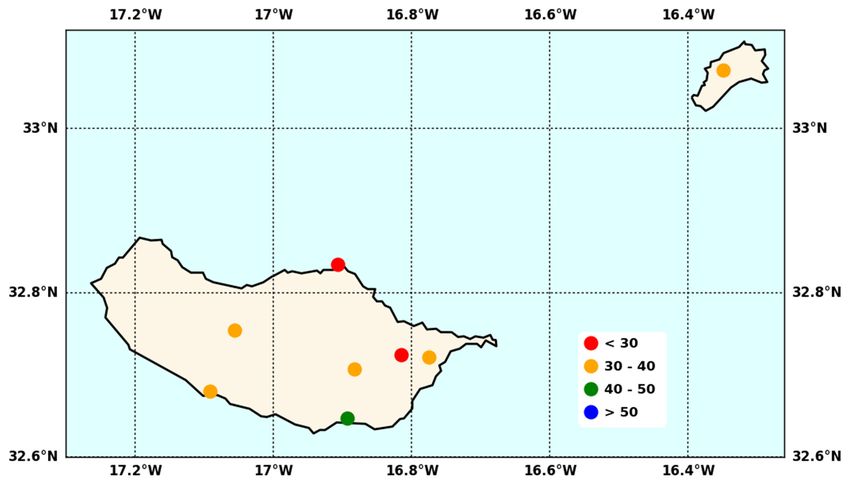
Atmosphere 2018, 9, 325 8 of 15
The influence of large scale teleconnections and other climate variability factors on the frequency of
ARs over the Macaronesian Islands have not been studied in detail. However, over southern (northern)
Atmosphere 2018, 9, x FOR PEER REVIEW 8 of 15
Europe during the negative (positive) phase of the North Atlantic Oscillation (NAO), there is an
increase in the number of ARs [9,10]. In contrast, Ramos et al. [11] showed that the NAO pattern is not
is not correlated with the number of ARs over the Iberian Peninsula but, instead, it is significantly
correlated with the number of ARs over the Iberian Peninsula but, instead, it is significantly associated
associated with the East Atlantic (EA) pattern. Regarding the precipitation in the European
with the East Atlantic (EA) pattern. Regarding the precipitation in the European Macaronesian Islands,
Macaronesian Islands, Cropper and Hanna [15] show that the winter NAO correlates negatively with
Cropper and Hanna [15] show that the winter NAO correlates negatively with precipitation across the
precipitation across the Azores, Madeira and western and central Canary Islands. In addition,
Azores, Madeira and western and central Canary Islands. In addition, Cropper [14] show that not only
Cropper [14] show that not only do the teleconnection patterns play a role in the climate of the
do the teleconnection patterns play a role in the climate of the European Macaronesian Islands, but also
European Macaronesian Islands, but also the semi-permanent Azores subtropical high-pressure
the semi-permanent Azores subtropical high-pressure system, trade winds and also (extra-/sub-)
system, trade winds and also (extra-/sub-) tropical storms.
tropical storms.
Time
Figure6.6.Time
Figure evolution
evolution of yearly
of yearly ARsper
ARs days days per extended
extended winter
winter for fortheeach
each of of the
different different
reanalyses
reanalyses (ERA-Interim (blue line); Climate Forecast System Reanalysis (CFSR) (red
(ERA-Interim (blue line); Climate Forecast System Reanalysis (CFSR) (red line); Modern-Era line); Modern-Era
Retrospective analysis
Retrospective analysis for
for Research
Research andand Applications,
Applications, Version
Version 22 (MERRA-2)
(MERRA-2) (green(green line)
line) and
and
NCEP/NCAR (purple line)) for (a) São Miguel Island (Azores), (b) Madeira
NCEP/NCAR (purple line)) for (a) São Miguel Island (Azores), (b) Madeira Island (Madeira Island (Madeira
Archipelago)and
Archipelago) and(c)
(c)Tenerife
Tenerife Island
Island (Canary).
(Canary).
3.3.Influence
3.3. InfluenceofofAtmospheric
AtmosphericRivers
Riverson
onExtreme
ExtremePrecipitation
Precipitation
Therelationship
The relationshipbetween
betweenARsARsand
andEPEs
EPEsisisanalysed
analysedfor
foreach
eachindividual
individualweather
weatherstation,
station,taking
taking
intoaccount
into accountthe
theclosest
closestgrid
gridpoint
pointof
ofeach
eachreanalysis
reanalysisand
andapplying
applyingaasimilar
similaranalysis
analysistotothe
theprevious
previous
worksdeveloped
works developedbybysome
someof ofus
usfor
forIberia
Iberia[11]
[11]and
andSouth
SouthAfrica
Africa[25].
[25].To
Todo
doso,
so,we
weassociate
associatethe
theARs
ARs
occurrence and the precipitation in the 31 weather stations of the three Archipelagos (see Section
occurrence and the precipitation in the 31 weather stations of the three Archipelagos (see Section 2.3) 2.3)
forthe
for thetop
topdecile
decileprecipitation
precipitationbins,
bins,starting
startingon
onthe
the6th
6thdecile
decile(50th–59th
(50th–59thpercentiles)
percentiles)and
andconcluding
concluding
inthe
in the most
most extreme
extreme precipitation
precipitation days
daysininthe
thelast decile(≥
lastdecile 90th percentile).
(≥90th percentile).Due
Duetotothe
thehuge
hugeamount
amount of
of results obtained using the many different datasets (31 weather stations times four reanalyses), we
made an effort to synthesize without compromising the main results. Therefore, we focus on a
representative example for three selected weather stations located in the three different Archipelagos
(Figure 7): Ponta Delgada in São Miguel (Azores); Funchal in Madeira Island and Santa Cruz in
Tenerife (Canary).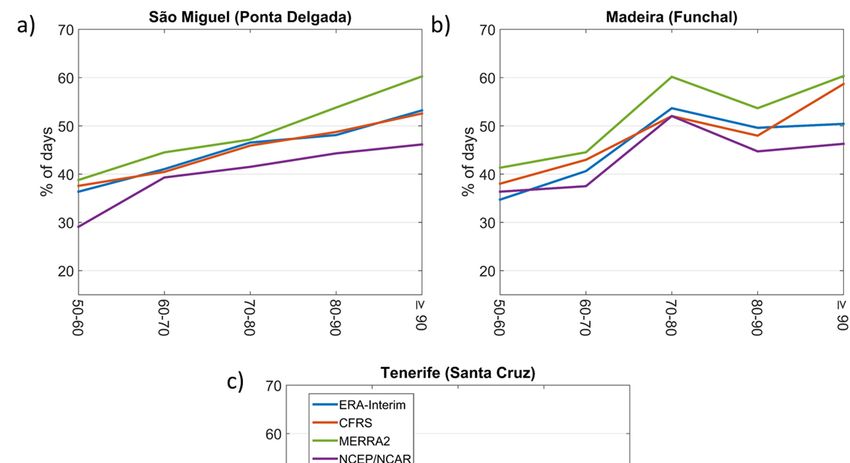
Atmosphere 9, 325
2018,2018,
Atmosphere 9, x FOR PEER REVIEW 9 of 15 9 of 15
For Ponta Delgada in São Miguel Island (Azores, Figure 7a), the analysis shows that in the 6th
results obtained
decile using
bin, the the many
percentage different datasets
of precipitation (31 weather
days associated stations
with times four
ARs occurrence reanalyses),
falls we made
between circa
an effort to synthesize without
30% (NCEP/NCAR) and 40%compromising the main
(ERA-Interim, CFRS results. Therefore,
and MERRA2). we focus
These values increaseon steadily
a representative
for
the higher decile (≥90th percentile) bin of precipitation, reaching values ranging from
example for three selected weather stations located in the three different Archipelagos (Figure 7): Ponta 45%
(NCEP/NCAR)
Delgada to 60%
in São Miguel (MERRA2)
(Azores); of the most
Funchal extremeIsland
in Madeira precipitation days Cruz
and Santa being associated
in Tenerifewith ARs.
(Canary).
Figure
Figure 7. Percentage
7. Percentage of of daysinineach
days eachdaily
daily precipitation
precipitation percentile
percentilebinbin
(from 50th50th
(from to 60th to the
to 60th to≥90th
the ≥90th
percentile) associated with atmospheric rivers (ARs) for each of the four reanalyses (ERA-Interim
percentile) associated with atmospheric rivers (ARs) for each of the four reanalyses (ERA-Interim (blue
(blue line); CFSR (red line); MERRA2 (green line) and NCEP/NCAR (purple line) for (a) Ponta
line); CFSR (red line); MERRA2 (green line) and NCEP/NCAR (purple line) for (a) Ponta Delgada
Delgada (São Miguel, Azores), (b) Funchal (Madeira) and (c) Santa Cruz (Tenerife, Canary).
(São Miguel, Azores), (b) Funchal (Madeira) and (c) Santa Cruz (Tenerife, Canary).
A similar analysis performed for the Funchal station (Madeira, Figure 7b) depicts a similar level
of
Forimpact
Pontaof Delgada
ARs on extreme
in Sãoprecipitation
Miguel Island to the Ponta Delgada
(Azores, Figurein7a),Sãothe
Miguel, with shows
analysis values up to in
that 60% the 6th
in bin,
decile the last decile (≥90thofpercentile).
the percentage precipitationAs for
daysPonta Delgada,
associated it must
with ARs be stressed that
occurrence fallsthe results circa
between for 30%
Funchal are partially
(NCEP/NCAR) and 40% dependent on the CFRS
(ERA-Interim, use of and
different reanalyses,
MERRA2). especially
These valuesinincrease
the last steadily
decile bin,for the
with values ranging from 45% in the NCEP/NCAR to 60% in the MERRA2.
higher decile (≥90th percentile) bin of precipitation, reaching values ranging from 45% (NCEP/NCAR)
In the case of Santa Cruz in Tenerife (Canary Archipelago, Figure 7c), the relationship between
to 60% (MERRA2) of the most extreme precipitation days being associated with ARs.
ARs and precipitation is lower than that found for both Ponta Delgada and Funchal. However, an
A similar
overall analysis
similar performed
increasing for theofFunchal
dependence stationfor(Madeira,
precipitation Figure
higher deciles is 7b)
alsodepicts
observed.a similar
A weak level of
impact
relationship between ARs and precipitation is found for the lower deciles, and a stronger relationship60% in
of ARs on extreme precipitation to the Ponta Delgada in São Miguel, with values up to
the last
is found for(≥
decile 90th
the percentile).
higher As forvary
deciles. Values Ponta Delgada,
between 30% init must be stressed
the lower decile bins that
and the
canresults for Funchal
reach values
are partially
over 50%dependent on the
in the bins with theuse of different
highest reanalyses,
precipitation especially
days in the in (≥90th
last decile the last decile bin, with values
percentile).
ranging fromFrom 45%
the analysis of Figure 7 andto
in the NCEP/NCAR from
60%thein results of the remaining islands (not shown), it is
the MERRA2.
apparent
In the casethatofthe NCEP/NCAR
Santa reanalysis
Cruz in Tenerife have, in
(Canary general, a slightly
Archipelago, Figurelower correspondence
7c), the relationshipbetween
between ARs
and precipitation is lower than that found for both Ponta Delgada and Funchal. reanalysis
EPEs and AR days. This can be related to the coarser resolution of the NCEP/NCAR However,when an overall
comparing to the other three reanalyses. On one hand, we have a lower frequency of AR days in the
similar increasing dependence of precipitation for higher deciles is also observed. A weak relationship
between ARs and precipitation is found for the lower deciles, and a stronger relationship is found for
the higher deciles. Values vary between 30% in the lower decile bins and can reach values over 50% in
the bins with the highest precipitation days in the last decile (≥90th percentile).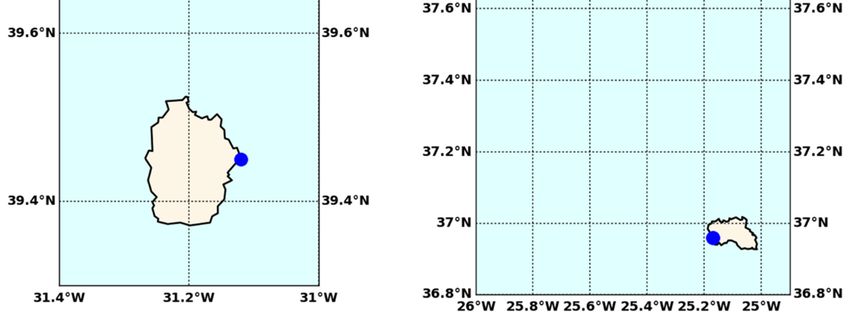
Atmosphere 2018, 9, 325 10 of 15
From the analysis of Figure 7 and from the results of the remaining islands (not shown), it is
apparent that the NCEP/NCAR reanalysis have, in general, a slightly lower correspondence between
EPEs and AR days. This can be related to the coarser resolution of the NCEP/NCAR reanalysis
whenAtmosphere
comparing to the other three reanalyses. On one hand, we have a lower frequency of
2018, 9, x FOR PEER REVIEW
AR days
10 of 15
in the NCEP/NCAR reanalysis, especially on the Madeira and Canary Archipelagos as discussed
in Section 3.2. On
NCEP/NCAR the other
reanalysis, hand, the
especially finer
on the resolution
Madeira reanalyses
and Canary allow as
Archipelagos for grid points
discussed closer to
in Section
3.2. On the islands.
the respective other hand, themean
The finer resolution
distance reanalyses allowgrid
of the closest for grid
pointpoints closer
to the to theshows
island respective
that the
islands. The mean distance of the closest grid point to the island shows that
NCEP/NCAR presents the highest distance between them (~116 km), while the CFSR (~17.4 km) the NCEP/NCAR presents
the MERRA2
and the highest distance
(~18.5between them (~116
km) presents km), while
the lowest the CFSR
distance. (~17.4 km)
Therefore, theand
usethe
of MERRA2
a coarse (~18.5
resolution
km) presents the lowest distance. Therefore, the use of a coarse resolution reanalysis like
reanalysis like NCEP/NCAR may influence the results both in terms AR frequency (lower frequencies),
NCEP/NCAR may influence the results both in terms AR frequency (lower frequencies), as well as a
as well as a worse representation of the ARs that strike each island, since the closest grid point analysed
worse representation of the ARs that strike each island, since the closest grid point analysed is located
is located
furtherfurther
from thefrom thewhen
island islandcompared
when compared with
with higher higher reanalysis.
resolution resolution reanalysis.
In order to summarise the main results, we have
In order to summarise the main results, we have computed forcomputed for each
each weather
weather station
station the mean
the mean
percentage of days
percentage of days(Figures 8–10)
(Figures 8–10)and
andthetherespective standarddeviations
respective standard deviations (Supplementary
(Supplementary Figures
Figures
S1–S3) associated
S1–S3) with
associated ARs
with using
ARs usingthe
theall
allreanalyses
reanalyses for the
the most
mostextreme
extreme precipitation
precipitation daysdays (≥90th
(≥90th
percentile), allowing us to synthesize without compromising
percentile), allowing us to synthesize without compromising the main results. the main results.
Figure 8. Mean
Figure percentage
8. Mean of days,
percentage associated
of days, withwith
associated ARsARs
for the
for most extreme
the most precipitation
extreme days
precipitation (≥90th
days
(≥90th percentile)
percentile) in the
in the Azores Azores Archipelago:
Archipelago: (a) central
(a) central group,group, (b) western
(b) western groupgroup
andand
(c) (c) eastern
eastern group.
group.percentage
The mean The mean percentage was obtained
was obtained after averaging
after averaging thereanalyses
the four four reanalyses
used.used.group (Figure 8a), for Faial, Pico and a couple of locations in Terceira, more than 50% of extreme
precipitation days are associated with ARs. However, for all other locations, the impact of ARs
remains below 40%. On the western group (Figure 8b), the values attained in Corvo and Flores are in
line with the ones found for the central group. Regarding the eastern group (Figure 8c), the
importance
Atmosphere of the ARs in the EPEs seems to be higher in Santa Maria (>50%) but somewhat lower in
2018, 9, 325 11 of 15
the main island of São Miguel, with values always below 50% of the days. Focusing on the central
The main goal of this work was to evaluate the impacts of ARs in EPEs on the European
group (Figure 8a), for Faial, Pico and a couple of locations in Terceira, more than 50% of extreme
Macaronesian Archipelagos between 1980 and 2010 for the extended winter months (October to
precipitation days are associated with ARs. However, for all other locations, the impact of ARs remains
March). To achieve this objective, we have used daily precipitation series covering most of the islands
below 40%. On the western group (Figure 8b), the values attained in Corvo and Flores are in line with
of the three Archipelagos in order to access the dates where EPEs occurred, taking into account the
the ones found for the central group. Regarding the eastern group (Figure 8c), the importance of the
decile bins. Moreover, four AR global databases [13] corresponding to the different reanalyses were
ARs in the EPEs seems to be higher in Santa Maria (>50%) but somewhat lower in the main island of
used: ERA-Interim; CFSR; MERRA2 and NCEP/NCAR between 1980 and 2010 at a six-hourly
São Miguel, with values always belowAtmosphere 2018, 9, 325 12 of 15
altitude stations of Bico da Cana and Poiso have their values ranging between 30% and 40%, while the
northern locations present values below 30% on the days associated with ARs.
Finally, the results for the Canary Islands are shown in Figure 10, where the range of results is
similar to those obtained for Madeira. For both islands of La Palma and Lanzarote, results show that
the ARs importance reduces to less than 30% of extreme precipitation days, while for Gran Canaria
and Fuerte Ventura, this value stays between 30% and 40% on those days. Focusing on Tenerife Island,
where three datasets from three stations are available, results show that the higher altitude locations of
Rodeus and Izana present the highest values in terms of importance of ARs in EPEs (between 40% to
50%) not only in Tenerife, but also when compared with the other locations in the Canary Archipelago.
In this case, it seems that the effect of orography plays a relevant role since Rodeus (617 m) and Santa
Cruz (36 m) are only a few km apart.
4. Conclusions
The main goal of this work was to evaluate the impacts of ARs in EPEs on the European
Macaronesian Archipelagos between 1980 and 2010 for the extended winter months (October to
March). To achieve this objective, we have used daily precipitation series covering most of the islands
of the three Archipelagos in order to access the dates where EPEs occurred, taking into account
the decile bins. Moreover, four AR global databases [13] corresponding to the different reanalyses
were used: ERA-Interim; CFSR; MERRA2 and NCEP/NCAR between 1980 and 2010 at a six-hourly
temporal resolution.
The number of ARs that strike each Archipelago is different, with higher frequencies in the Azores
and lower frequencies in the Madeira and Canary Islands. The Azores are located in the middle of the
North Atlantic basin, being often affected by the passage of cold fronts associated with the storm track
in the North Atlantic [26]. Since the ARs are usually associated with the low-level jet stream ahead of
the cold front of an extratropical cyclone [5], they can therefore be highly relevant when explaining
most EPEs.
Regarding the Madeira and Canary Archipelagos, the frequency of ARs is relatively lower when
compared with the Azores due to the fact that the storm track is weaker than the one found in the
Azores sector whatever the storm track climatology used [27]. In addition, given its southern location,
both Archipelagos are also under the influence of other synoptic systems that can be responsible for
intense precipitation, including mesoscale convective systems or cut off low systems [28]. Nevertheless,
it was shown by [16] that for a 10 year period (September 2002 to November 2012) in the Madeira
Islands, the ARs sometimes contribute to the occurrence of EPEs with high socio-economic impact
(e.g., [29]).
EPEs in Western Europe during the extended winter months have major socio-economic impacts
such as floods, landslides, extensive property damage, and loss of lives (e.g., [1,3,9–12,30,31]).
Regarding the European Macaronesian Archipelagos, no comprehensive characterisation studies
have been done until now between ARs and EPEs.
We then investigated the relationship between ARs and EPEs between 1980 and 2010 on the
European Macaronesian Islands. Regarding the Azores, our results are novel and clearly indicate that
the presence of ARs plays a major role in explaining the occurrence of EPEs, particularly in the central
and western groups.
Regarding Madeira, our results confirm those found by [16], namely that the island is sometimes
struck by an AR capable of producing EPEs, especially for the capital city of the island (Funchal).
The inter-annual variability of AR frequency also shows that the winter of 2010 was highly unusual for
the Madeira, with many more ARs than the usual range of variability. In addition, the 2010 winter
was also one of the wettest in Madeira, culminating with the ARs event in February 2010 that was
responsible for numerous landslides and flash flood events in the urban area of Funchal, provoking a
death toll of near 50 [16,29].Atmosphere 2018, 9, 325 13 of 15
In the case of the Canary Archipelago, the results obtained are in line with those found for
Madeira. However, when analysing the different locations on Tenerife Island, the importance of the
ARs in explaining the EPEs is clearly stronger in stations located at higher altitudes (Rodeos and Izana)
then in Santa Cruz, probably due to the orography effect associated with these stations.
To conclude, we have developed here the first systematic assessment of the influence of the ARs
in the EPEs in the European Macaronesian Islands between 1980 and 2010. This study intends to shed
light on quantifying to what extent EPEs observed in these Islands are associated with ARs. This is
relevant when analysing past and present EPEs with wide socio-economic impacts in the European
Macaronesian Islands, such as the case of February 2010 in Madeira. Likewise, it is also important
to take into account when considering the foreseen increment of the occurrence of ARs in the North
Atlantic basin under most likely representative climate change scenarios [32].
Supplementary Materials: The following are available online at http://www.mdpi.com/2073-4433/9/8/325/s1,
Figure S1. Standard deviation of the mean percentage of days, using the four reanalyses, associated with
atmospheric rivers for the most extreme precipitation days (≥90th percentile) in the Azores Archipelago: (a) central
group, (b) western group and (c) eastern group; Figure S2. Standard deviation of the mean percentage of days,
using the four reanalyses, associated with atmospheric rivers for the most extreme precipitation days (≥90th
percentile) in the Madeira Archipelago; Figure S3. Standard deviation of the mean percentage of days, using the
four reanalyses, associated with atmospheric rivers for the most extreme precipitation days (≥90th percentile) in
the Canary Archipelago; Table S1. Information regarding the location and altitude of the weather stations in the
Azores Archipelago; Table S2. Same as Table S1 for the Madeira Archipelago; Table S3. Same as Table S1 for the
Canary Archipelago. Table S4. Atmospheric rivers mean frequency (days) considering the nearest grid point of
each island taking into account the four reanalysis: ERA-Interim; Climate Forecast System Reanalysis (CFSR);
Modern-Era Retrospective analysis for Research and Applications, Version 2 (MERRA-2) and NCEP/NCAR.
Author Contributions: A.M.R. conceived and designed the experiments; A.M.R. and R.T. performed the
experiments. A.M.R., R.M.T., R.T., M.L.R.L. analysed the data and wrote the paper.
Funding: This work was supported by the project “Weather Extremes in the Euro Atlantic Region: Assessment and
Impacts—WEx-Atlantic” (PTDC/CTA-MET/29233/2017) and by Instituto Dom Luiz (IDL, UID/GEO/50019/
2013) funded by Fundação para a Ciência e a Tecnologia, Portugal (FCT) and Portugal Horizon2020. Alexandre.
M. Ramos was also supported by a FCT postdoctoral grant (FCT/DFRH/SFRH/BPD/84328/2012).
Acknowledgments: Alexandre M. Ramos would like to thank Bin Guan for kindly sharing the atmospheric rivers
databases. Finally we would like to thank the reviewers for their thoughtful comments and efforts towards
improving the manuscript.
Conflicts of Interest: The authors declare no conflict of interest.
References
1. Fragoso, M.; Trigo, R.M.; Zêzere, J.; Valente, M.A. The exceptional rainfall event in Lisbon on 18 February
2008. Weather 2010, 65, 31–35. [CrossRef]
2. Zêzere, J.; Pereira, S.; Tavares, A.; Bateira, C.; Trigo, R.M.; Quaresma, I.; Santos, P.; Santos, M.; Verde, J.
DISASTER: A GIS database on hydro-geomorphologic disasters in Portugal. Nat. Hazards 2014, 72, 503–532.
[CrossRef]
3. Liberato, M.L.R.; Ramos, A.M.; Trigo, R.M.; Trigo, I.F.; Durán-Quesada, A.M.; Nieto, R.; Gimeno, L. Moisture
Sources and Large-Scale Dynamics Associated with a Flash Flood Event. In Lagrangian Modeling of the
Atmosphere; Lin, J., Brunner, D., Gerbig, S.C., Luhar, A.A., Webley, P., Eds.; American Geophysical Union:
Washington, DC, USA, 2012.
4. Neiman, P.J.; Ralph, F.M.; Wick, G.A.; Lundquist, J.D.; Dettinger, M.D. Meteorological characteristics and
overland precipitation impacts of atmospheric rivers affecting the West Coast of North America based on
eight years of SSM/I satellite observations. J. Hydrometeorol. 2008, 9, 22–47. [CrossRef]
5. Ralph, F.M.; Dettinger, M.D. Storms, floods, and the science of atmospheric rivers. Eos Trans. Am. Geophys. Union
2011, 92, 265–266. [CrossRef]
6. Barth, N.A.; Villarini, G.; Nayak, M.A.; White, K. Mixed populations and annual flood frequency estimates
in the western United States: The role of atmospheric rivers. Water Resour. Res. 2017, 53, 257–269. [CrossRef]
7. Ralph, F.M.; Dettinger, M.D.; Lavers, D.; Gorodetskaya, I.V.; Martin, A.; Viale, M.; White, A.B.; Oakley, N.;
Rutz, J.; Spackman, J.R.; et al. Atmospheric Rivers Emerge as a Global Science and Applications Focus.
Bull. Am. Meteorol. Soc. 2017, 98, 1969–1973. [CrossRef]Atmosphere 2018, 9, 325 14 of 15
8. Zhang, W.; Villarini, G. Uncovering the role of the East Asian jet stream and heterogeneities in atmospheric
rivers affecting the western United States. Proc. Natl. Acad. Sci. USA 2018, 115, 891–896. [CrossRef] [PubMed]
9. Stohl, A.; Forster, C.; Sodemann, H. Remote sources of water vapor forming precipitation on the Norwegian
west coast at 60◦ N—A tale of hurricanes and an atmospheric river. J. Geophys. Res. 2008, 113. [CrossRef]
10. Lavers, D.A.; Villarini, G.; Allan, R.P.; Wood, E.F.; Wade, A.J. The detection of atmospheric rivers in
atmospheric reanalyses and their links to British winter floods and the large-scale climatic circulation.
J. Geophys. Res. Atmos. 2012, 117. [CrossRef]
11. Ramos, A.M.; Trigo, R.M.; Liberato, M.L.R.; Tomé, R. Daily Precipitation Extreme Events in the Iberian
Peninsula and Its Association with Atmospheric Rivers. J. Hydrometeorol. 2015, 16, 579–597. [CrossRef]
12. Lavers, D.A.; Villarini, G. The nexus between atmospheric rivers and extreme precipitation across Europe.
Geophys. Res. Lett. 2013, 40, 3259–3264. [CrossRef]
13. Guan, B.; Waliser, D.E. Detection of atmospheric rivers: Evaluation and application of an algorithm for
global studies. J. Geophys. Res. Atmos. 2015, 120, 12514–12535. [CrossRef]
14. Cropper, T. The weather and climate of Macaronesia: Past, present and future. Weather 2013, 68, 300–307.
[CrossRef]
15. Cropper, T.E.; Hanna, E. An analysis of the climate of Macaronesia, 1865–2012. Int. J. Climatol. 2014, 34,
604–622. [CrossRef]
16. Couto, F.T.; Salgado, R.; Costa, M.J.; Prior, V. Precipitation in the Madeira Island over a 10-year period and the
meridional water vapour transport during the winter seasons. Int. J. Climatol. 2015, 35, 3748–3759. [CrossRef]
17. Fragoso, M.; Trigo, R.M.; Pinto, J.G.; Lopes, S.; Lopes, A.; Ulbrich, S.; Magro, C. The 20 February 2010
Madeira flash-floods: Synoptic analysis and extreme rainfall assessment. Nat. Hazards Earth Syst. Sci. 2012,
12, 715–730. [CrossRef]
18. Ramos, A.M.; Trigo, R.M.; Santo, F.E. Evolution of extreme temperatures over Portugal: Recent changes and
future scenarios. Clim. Res. 2011, 48, 177–192. [CrossRef]
19. Espírito Santo, F.; de Lima, M.I.; Ramos, A.M.; Trigo, R.M. Trends in seasonal surface air temperature in
mainland Portugal, since 1941. Int. J. Climatol. 2014, 34, 1814–1837. [CrossRef]
20. Pereira, S.; Ramos, A.M.; Zêzere, J.L.; Trigo, R.M.; Vaquero, J.M. Spatial impact and triggering conditions of
the exceptional hydro-geomorphological event of December 1909 in Iberia. Nat. Hazards Earth Syst. Sci. 2016,
16, 371–390. [CrossRef]
21. Hecht, C.W.; Cordeira, J.M. Characterizing the influence of atmospheric river orientation and intensity on
precipitation distributions over North Coastal California. Geophys. Res. Lett. 2017, 44, 9048–9058. [CrossRef]
22. Hernández, A.; Haim, K.; Trigo, R.M.; Valente, M.A.; Sigró, J.; Cropper, T.; Santo, F.E. New Azores archipelago
daily precipitation dataset and its links with large-scale modes of climate variability. Int. J. Climatol. 2016, 36,
4439–4454. [CrossRef]
23. Hénin, R.; Ramos, A.M.; Schemm, S.; Gouveia, C.; Liberato, M.L.R. Assigning precipitation to mid-latitudes
fronts on sub-daily scales in the North Atlantic and European sector: Climatology and trends. Int. J. Climatol.
2018, accepted.
24. García-Herrera, R.; Gallego, D.; Hernández, E.; Gimeno, L.; Ribera, P.; Calvo, N. Precipitation trends in the
Canary Islands. Int. J. Climatol. 2003, 23, 235–241. [CrossRef]
25. Blamey, R.C.; Ramos, A.M.; Trigo, R.M.; Tomé, R.; Reason, C.J. The Influence of Atmospheric Rivers over the
South Atlantic on Winter Rainfall in South Africa. J. Hydrometeorol. 2018, 19, 127–142. [CrossRef]
26. Trigo, I.F. Climatology and interannual variability of stormtrack in the Euro-Atlantic sector: A comparison
between ERA-40 and NCEP/NCAR reanalyses. Clim. Dyn. 2006, 26, 127–143. [CrossRef]
27. Neu, U.; Akperov, M.G.; Bellenbaum, N.; Rasmus, B.; Richard, B.; Rodrigo, C.; Angela, C.; Helen, F.D.;
Yang, F.; Klaus, F.; et al. IMILAST: A Community Effort to Intercompare Extratropical Cyclone Detection and
Tracking Algorithms. Bull. Am. Meteorol. Soc. 2013, 94, 529–547. [CrossRef]
28. Nieto, R.; Gimeno, L.; De la Torre, L.; Ribera, P.; Barriopedro, D.; García-Herrera, R.; Serrano, A.; Gordillo, A.;
Redaño, A.; Lorente, J. Interannual variability of cut-off low systems over the European sector: The role of
blocking and the Northern Hemisphere circulation modes. Meteorol. Atmos. Phys. 2007, 96, 85–101. [CrossRef]
29. Couto, F.T.; Salgado, R.; Costa, M.J. Analysis of intense rainfall events on Madeira Island during the
2009/2010 winter. Nat. Hazards Earth Syst. Sci. 2012, 12, 2225–2240. [CrossRef]You can also read