Magma Fracking Beneath Active Volcanoes Based on Seismic Data and Hydrothermal Activity Observations - MDPI
←
→
Page content transcription
If your browser does not render page correctly, please read the page content below
geosciences
Article
Magma Fracking Beneath Active Volcanoes Based on
Seismic Data and Hydrothermal
Activity Observations
Alexey Kiryukhin *, Evgenia Chernykh, Andrey Polyakov            and Alexey Solomatin
 Institute of Volcanology & Seismology FEB RAS, Petropavlovsk-Kamchatsky 683006, Russia;
 jenia.chev@yandex.ru (E.C.); pol@kscnet.ru (A.P.); alf110111@gmail.com (A.S.)
 * Correspondence: avkiryukhin2@mail.ru

 Received: 28 November 2019; Accepted: 26 January 2020; Published: 29 January 2020

 Abstract: Active volcanoes are associated with microearthquake (MEQ) hypocenters that form
 plane-oriented cluster distributions. These are faults delineating a magma injection system of dykes
 and sills. The Frac-Digger program was used to track fracking faults in the Kamchatka active volcanic
 belt and fore-arc region of Russia. In the case of magma laterally injected from volcanoes into
 adjacent structures, high-temperature hydrothermal systems arise, for example at Mutnovsky and
 Koryaksky volcanoes. Thermal features adjacent to these active volcanoes respond to magma injection
 events by degassing CO2 and by transient temperature changes. Geysers created by CO2 -gaslift
 activity in silicic volcanism areas also flag magma and CO2 recharge and redistributions, for example
 at the Uzon-Geyserny, Kamchatka, Russia and Yellowstone, USA magma hydrothermal systems.
 Seismogenic faults in the Kamchatka fore-arc region are indicators of geofluid fracking; those faults can
 be traced down to 250 km depth, which is within the subduction slab below primary magma sources.

 Keywords: magma; hydrothermal; fracking; volcanoes; Kamchatka

1. Introduction
     Volcanoes and crustal magma chambers are the products of magma injection from primary magma
chambers at depths of 150–200 km below the Kuril-Kamchatka volcanic zone (Figure 1). These magma
injections create new hydraulic fractures and reactivate existing faults. The formation of shear cracks
in adjacent to the main aseismic opening triggers microseismicity [1]. Earthquake magnitudes (M) for
shear deformations with amplitudes of 0.1 mm–1 cm and fracture lengths of a few hundred meters are
estimated to range from 1 to 2 (Ks from 3.5 to 5.5), corresponding to the sensitivity of local seismic
networks operating in the areas of the Klyuchevskoy, Koryaksky-Avachinsky, and Mutnovsky-Gorely
volcano groups. We propose that the planes defined by clusters of microearthquakes correspond
to magmatic intrusions. For a search of plane-oriented clusters of earthquakes, we use our original
programs Frac-Digger (RU reg. ## 2016616880), and for production feed-zones, we use Frac-Digger2
(RU reg. ## 2017618050) (these applications discrete fracture systems using seismic and geological
data). In these programs, the following criteria are used to select clusters of earthquake hypocenters or
production feed zones: (1) proximity in time δt (Frac-Digger only); (2) proximity within the horizontal
plane δR; (3) proximity to plane orientation δZ (distance between the object and plane); and (4)
minimum number of elements in cluster N. This method has already been tested on the example of the
2012 eruption of Tolbachik volcano [2], the 2000–2016 MEQ data of Koryaksky-Avachinsky volcanic
cluster [3–5], Paratunsky graben (adjacent to Vilyuchinsky volcano) [6], the Mutnovsky-Gorely volcanic
cluster [7], and the Klyuchevkoy group of volcanoes [8]. Note that the methodology of dyke tracking
using the Frac-Digger program is presented in detail in Section 3.2.1, “Seismic Data and Method of
Plane-Oriented Clusters Identification” [5].

Geosciences 2020, 10, 52; doi:10.3390/geosciences10020052                  www.mdpi.com/journal/geosciences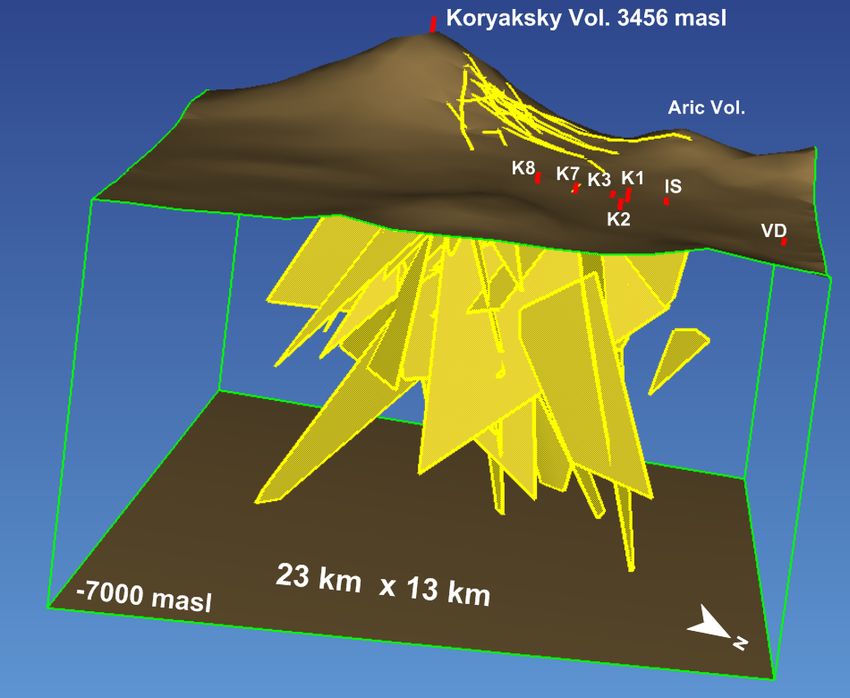
explain the mechanisms of the anomalous hydrothermal perturbations. A recently revealed
mechanism [9] of geysers activity due to cyclic magmatic CO2-gaslift pointed to the possibility of
understanding the mechanisms of relationship between anomalous hydrothermal perturbations,
volcano activity, and strong earthquakes. Continuous measurements of CO2 partial pressures in the
Koryaksky Narzan thermal mineral springs (northern sector of Koryaksky volcano, 2017–2019) and
Geosciences 2020, 10, 52                                                                     2 of 16
in the Mutnovsky geothermal Power Plant condenser (2019) provide evidence of this process.

    Figure 1. Location map of the volcanoes and hydrothermal systems of Kamchatka. 1—Active
    Figure 1. Location map of the volcanoes and hydrothermal systems of Kamchatka. 1—Active
    volcanoes (1, Kambalny; 2, Koshelevsky; 3, Diky Greben; 4, Ilynsky; 5, Zheltovsky; 6, Ksudach; 7,
    volcanoes (1, Kambalny; 2, Koshelevsky; 3, Diky Greben; 4, Ilynsky; 5, Zheltovsky; 6, Ksudach; 7,
    Asachinsky; 8, Mutnovsky; 9, Opala; 10, Gorely; 11, Avachinsky; 12, Koryaksky; 13, Zhupanovsky;
    Asachinsky; 8, Mutnovsky; 9, Opala; 10, Gorely; 11, Avachinsky; 12, Koryaksky; 13, Zhupanovsky;
    14, Karymsky; 15, Maly Semyachik; 16, Bolshoy Semyachik; 17, Kihpinych; 18, Taunshits; 19,
    14, Karymsky; 15, Maly Semyachik; 16, Bolshoy Semyachik; 17, Kihpinych; 18, Taunshits; 19,
    Krasheninnikova; 20, Kronotsky; 21, Komarova; 22, Gamchen; 23, Kizimen; 24, Pl. Tolbachik;
    Krasheninnikova; 20, Kronotsky; 21, Komarova; 22, Gamchen; 23, Kizimen; 24, Pl. Tolbachik; 25,
    25, Bezymyanny; 26, Kluchevskoy; 27, Ushkovsky; 28, Shiveluch; 29, Khangar; 30, Ichinsky);
    Bezymyanny; 26, Kluchevskoy; 27, Ushkovsky; 28, Shiveluch; 29, Khangar; 30, Ichinsky); 2—High-
    2—High-temperature hydrothermal systems (1, Koshelevsky; 2, Pauzhetsky; 3, Hodutkinky; 4,
    temperature hydrothermal systems (1, Koshelevsky; 2, Pauzhetsky; 3, Hodutkinky; 4, Mutnovsky; 5,
    Mutnovsky; 5, B-Banny; 6, Karymsky; 7, Semyachiksky; 8, Geyserny; 9, Uzonsky; 10, Apapelsky;
    B-Banny; 6, Karymsky; 7, Semyachiksky; 8, Geyserny; 9, Uzonsky; 10, Apapelsky; 11, Kireunsky; 12,
    11, Kireunsky; 12, North-Koryaksky); 3—Hydrothermal systems with temperatures below 150 ◦ C;
    North-Koryaksky); 3—Hydrothermal systems with temperatures◦ below 150 °C; 4—Groups of thermal
    4—Groups of thermal springs: (a) temperature from 50 to 100 C, (b) temperature from 20 to 50 ◦ C.
    springs: (a) temperature from 50 to 100 °C, (b) temperature from 20 to 50 °C. Notes: The AB and CD
    Notes: The AB and CD lines delineates the cross-sections shown below.
    lines delineates the cross-sections shown below.
     By coupling magma fracking observations beneath volcanoes with the monitoring of thermal
features in adjacent hydrothermal systems, we can develop appropriate geofiltrational and
thermal–hydrodynamic TOUGH2-models that allow an assessment of recoverable geothermal resources
and explain the mechanisms of the anomalous hydrothermal perturbations. A recently revealed
mechanism [9] of geysers activity due to cyclic magmatic CO2 -gaslift pointed to the possibility of
understanding the mechanisms of relationship between anomalous hydrothermal perturbations,
volcano activity, and strong earthquakes. Continuous measurements of CO2 partial pressures in the
Koryaksky Narzan thermal mineral springs (northern sector of Koryaksky volcano, 2017–2019) and in
the Mutnovsky geothermal Power Plant condenser (2019) provide evidence of this process.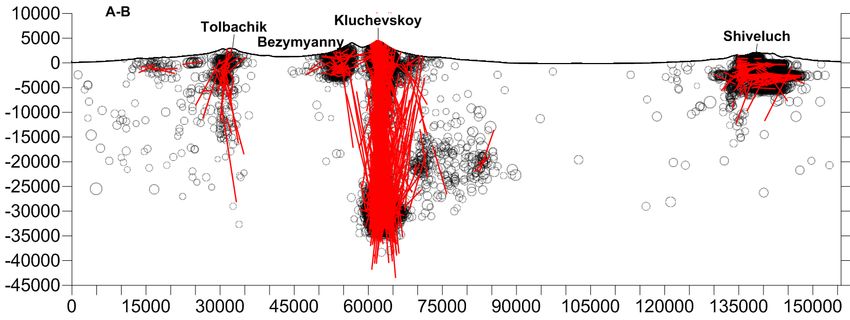
Geosciences 2020, 10, 52 3 of 16
2. Active Faults and Magma Fracks Based on Seismic Data Analysis
2.1. Koryaksky-Avachinsky Volcanoes
Plane-oriented clusters of 5160 seismic events from data of the Kamchatka Branch Federal Research
Center United Geophysical Survey Russia Academy of Sciences (KB FRC UGS RAS) of 01.2000–07.2016)
below Koryaksky and Avachinsky volcanoes were used to identify magma injection zones [4,5]. Cluster
identification was carried out using our Frac-Digger program. The previously defined criteria were
used to include a new event in the cluster: δt ≤ 1 day, δR ≤ 6 km, δZ ≤ 0.2 km, N ≥ 6.
It was found that 30% of the total number of 5160 earthquakes formed 204 plane-oriented clusters.
A careful analysis of the orientations of dykes and sills (using stereograms and histograms) showed
the following: (1) the dykes beneath Koryaksky Volcano were mostly emplaced in the depth range
from −5000 to 0 m masl; they mostly strike north–south (75% of dykes have strike azimuths between
320◦ and 40◦ ) and have dip angles over 50◦ (70% of the dykes), and (2) the dykes beneath Avacha
Volcano were mostly in the depth range 1000–2000 m masl. Their strikes are distributed over all
possible directions, but there is a local maximum of dykes striking nearly north–south with 25% of
dykes having azimuths between 350◦ and 10◦ . Steeply dipping dykes are not obviously dominant
(61% have dip angles over 45◦ ).
Additionally: (1) A shallow crustal magma chamber, likely as a combination of sills and dykes,
lies below the southwestern base of Koryaksky Volcano at depths ranging from −2 to −5 km masl and
a width of 2.5 km; (2) dyke accumulation in a nearly north–south zone (7.5 by 2.5 km, with absolute
depths ranging from −2 to −5 km occurs beneath the northern sector of Koryaksky Volcano; and (3) a
shallow magma chamber in the cone of Avachinsky Volcano lies at absolute depths ranging from 1 to 2
km and has a width of 1 km.
Thus, we propose the geomechanical state according to [10]: (1) extension is recorded beneath
Koryaksky Volcano producing normal faulting (NF conditions), the vertical stress Sv is the maximum
stress, the horizontal principal stresses are coincident with the north–south (SHmax) and the east–west
(Shmin) directions, (2) the cone of Avacha Volcano is found to be under conditions of radial extension.
The relationship M = 0.67 log (V) − 0.82 between the upper bound of the induced seismic event M
and magmatic injection volume V, suggested by [11], may be used for recorded dykes volume estimates
beneath Koryaksky in a range from 220 m3 to 1.988 × 10⁶ m3 , and the total recorded volume of the
injected magma is estimated at 5.862 × 10⁶ m3 during 2008–2011. Avachinsky volcano characterized
by a range from 111 m3 to 0.064 × 10⁶ m3 , and the total recorded volume of the injected magma is
estimated at 0.169 × 10⁶ m3 during 2008–2011.
It is also worth noting that seismogenic planes and microearthquake (MEQ) mechanisms planes
(19 mechanisms estimated were used) are intersected with the angle of 51◦ (on average) [12]. This may
have the following geomechanical interpretation: seismogenic planes mark opening mode fractures
(hydrofracking-type fractures) formed orthogonal to the least effective stress during magma injection,
whereas MEQ mechanisms planes are mark shear faults, which initiated from the main opening mode
fault (dyke) using pre-existing fractures systems.
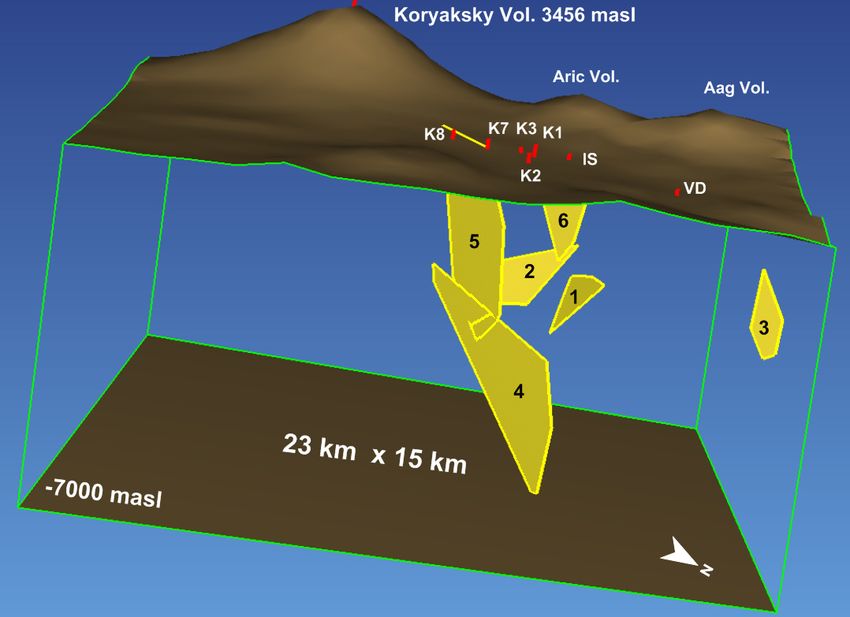
There were six magma injections below the northern foothills of Koryaksky volcano detected in
2011–2019 based on MEQ analysis data using Frac-Digger criteria (δt = 1 day, δR = 6 km, δZ = 0.2
km, N = 6): one dyke on 02.08.2011, one dyke on 28.02.2016, one dyke on 22.08.2017, two dykes on
14.11.2017, and one dyke on 22.04.2019. All of these dykes were injected just below the Koryaksky
Narzan and Isotovsky thermal mineral springs area. The depth of magma injections was estimated
from seismic data from −7000 to +1000 masl, with M ranges from 0.85 to 2.95 (Figure 2, Table 1).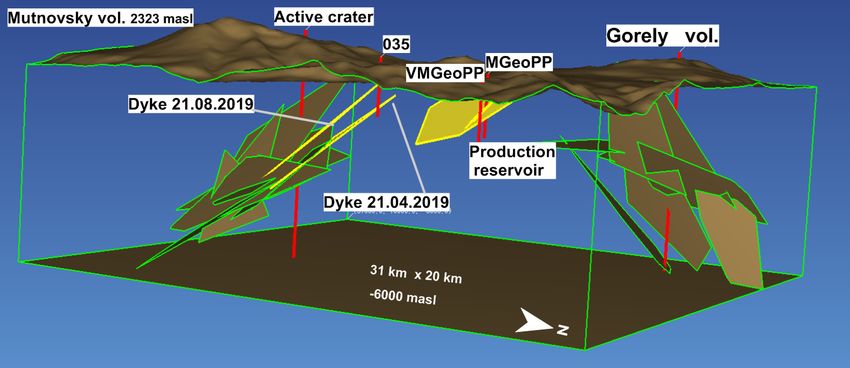
Geosciences 2020, 10, 52                                                                                       4 of 16
Geosciences 2020, 10, 52                                                                                       4 of 16

      Figure  2. Magma
      Figure 2.  Magmainjections
                         injections(dykes)
                                    (dykes)below
                                            belowthethe
                                                      northern foothills
                                                        northern         of Koryaksky
                                                                  foothills           volcano
                                                                            of Koryaksky      during
                                                                                          volcano    the time
                                                                                                  during   the
      period from 2011 to 2019. Koryaksky Narzans are marked as K1, K2, K3, K7, and K8, Isotovsky hot
      time period from 2011 to 2019. Koryaksky Narzans are marked as K1, K2, K3, K7, and K8, Isotovsky
      spring—IS, Vodopadny hot spring—VD. Frac-Digger parameters are: δt = 1 day, δR = 6 km, δZ = 0.2
      hot spring—IS, Vodopadny hot spring—VD. Frac-Digger parameters are: δt = 1 day, δR = 6 km, δZ =
      km, and N = 6. Dyke geometries and magnitudes are given in the Table 1 below. Note: Dykes patches
      0.2 km, and N = 6. Dyke geometries and magnitudes are given in the Table 1 below. Note: Dykes
      in 3D view are convex polygons, with vertices in the points of projections of plane-oriented clusters of
      patches in 3D view are convex polygons, with vertices in the points of projections of plane-oriented
      earthquakes hypocenters on an approximation plane.
      clusters of earthquakes hypocenters on an approximation plane.
      Table 1. Dyke geometries and corresponding microearthquake (MEQ) magnitudes of the Koryaksky
      Table 1. for
      volcano   Dyke
                   thegeometries
                       period fromand corresponding
                                   02.08.2011         microearthquake (MEQ) magnitudes of the Koryaksky
                                              to 22.04.2019.
      volcano for the period from 02.08.2011 to 22.04.2019.
       ##            Data           Dip (◦ )       Dip Direction (◦ )    Mmax         N        Area km2
         ##        Data        Dip (°)         Dip Direction (°)          Mmax         N         Area km2
        1           02.08.11        39.3               115.1                 2.95           7            1.4
          1       02.08.11      39.3                115.1                  2.95        7            1.4
        2           28.02.16        70.2                64                   2.45           7            1.7
          2       28.02.16      70.2                 64                    2.45        7            1.7
        33          22.08.17
                  22.08.17       69 69                 246.3
                                                    246.3                    1.30
                                                                           1.30        6    6       1.0 1.0
        44          14.11.17
                  14.11.17       78 78                 291.2
                                                    291.2                    1.25
                                                                           1.25        17   17     11.5 11.5
        55        14.11.17
                    14.11.17    63.763.7            283.2
                                                       283.2               0.85
                                                                             0.85      8    8      10.0 10.0
        66        22.04.19
                    22.04.19     73 73              266.5
                                                       266.5               1.95
                                                                             1.95      6    6       2.2 2.2

     If a less severe Frac-Digger criterion in time, δt ≤ 30 day, is used, the number of detected dykes
significantly  increases.
     If a less severe     By using criterion
                      Frac-Digger   this approach,
                                              in time,   δt ≤ found
                                                      it was   30 day,that as a result,
                                                                       is used,         91% ofofthe
                                                                                 the number           total number
                                                                                                  detected    dykes
of 5160 earthquakes
significantly          452By
              increases.   plane-oriented   clustersitwere
                             using this approach,           formed.
                                                       was found   thatFigure  3 shows
                                                                         as a result, 91%that
                                                                                           of 68
                                                                                              theoftotal
                                                                                                     these  features
                                                                                                         number   of
were earthquakes
5160  interpreted as  dykes
                    452      from 2011 to
                         plane-oriented     2019 beneath
                                          clusters          Koryaksky
                                                   were formed.           volcano.
                                                                     Figure         Most
                                                                              3 shows      of68
                                                                                        that  them    were features
                                                                                                 of these   injected
in a northeast
were            sector
      interpreted      of thefrom
                   as dykes   volcano
                                  2011structure,   where thermal
                                         to 2019 beneath    Koryaksky springs  activity
                                                                          volcano.  Most occurs.
                                                                                           of them were injected
in a northeast sector of the volcano structure, where thermal springs activity occurs.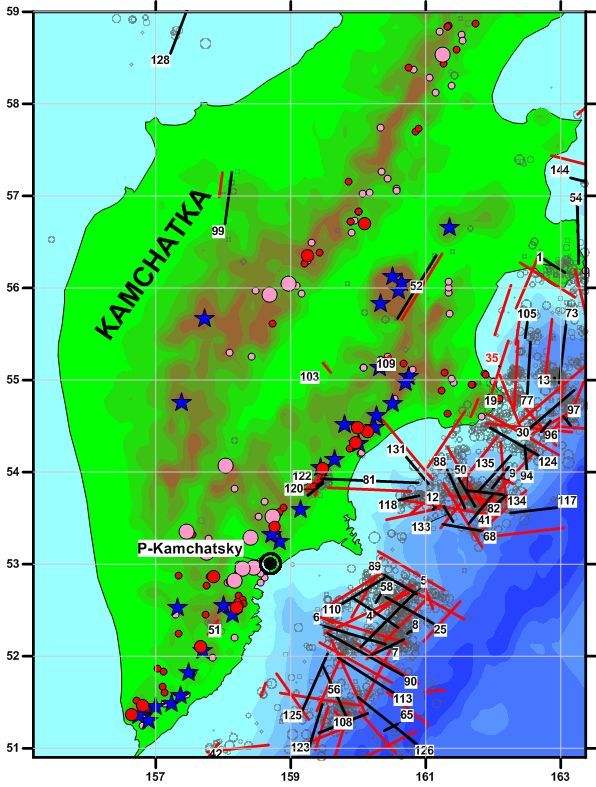
Geosciences 2020, 10, 52 5 of 16
Geosciences 2020, 10, 52 5 of 16
Figure 3. Magma injections (dykes) below northern foothills of Koryaksky volcano during the time
period from 2011 to 2019. Koryaksky
Koryaksky Narzans
Narzans are
are marked
marked asas K1, K2, K3, K7, and K8, Isotovsky hot
spring—IS, Vodopadny
Vodopadnyhothotspring—VD.
spring—VD.Frac-Digger
Frac-Diggercriteria
criteriaare: (δt== 30
are:(δt 30 day, δR== 6 km, δZ =
day,δR = 0.2
0.2 km,
km,
N == 6).
6).
2.2. Mutnovsky
2.2. Mutnovsky and
and Gorely
Gorely Volcanoes
Volcanoes
We already
We already used
used plane-oriented
plane-orientedearthquake
earthquakeclusters
clusters(KB(KBFRC
FRC UGS
UGS RAS,
RAS, catalogs
catalogs 2009–2017)
2009–2017) to
to track the dykes injected beneath and around the Mutnovsky volcano
track the dykes injected beneath and around the Mutnovsky volcano by using the Frac-Digger by using the Frac-Digger
program
program [5].[5].Thus,
Thus,magmatic
magmatic injection
injectionzones (shape-like
zones dykes
(shape-like and sills,
dykes and [13,14]) defineddefined
sills, [13,14]) in this manner
in this
were
mannertreated
wereas pathways
treated and heatand
as pathways sources
heat for ascending
sources high-temperature
for ascending upflows upflows
high-temperature that feedthatadjacent
feed
hydrogeological reservoirs and surface feature (hot springs and fumaroles)
adjacent hydrogeological reservoirs and surface feature (hot springs and fumaroles) discharge. discharge.
Four seismic
Four seismic stations
stations record
record seismicity
seismicity in the Mutnovsky–Gorely
in the Mutnovsky–Gorely volcanicvolcanic cluster.
cluster. A total of
A total of 1336
1336
earthquakes were
earthquakes were recorded
recorded by the KB
by the KB FRC
FRC UGS
UGS RASRAS inin the
the edifices
edifices and
and basement
basement of of the
the Mutnovsky
Mutnovsky
and Gorely volcanoes between January 2009 and February 2017. Cluster identification was carried
and Gorely volcanoes between January 2009 and February 2017. Cluster identification was carried
out using
out using our
our Frac-Digger
Frac-Diggerprogram.
program.The Thesame
samecriteria
criteriaasasabove
above were
were used
used to to include
include a new
a new event
event in
in the cluster. Our treatment of these data used the method previously outlined,
the cluster. Our treatment of these data used the method previously outlined, which yielded 973 which yielded 973
earthquakes (72.8%)
earthquakes (72.8%) that
that make
make up up 7474 plane-oriented
plane-oriented clusters
clusters between
between November
November 2013 2013 andand October
October
2016 (most
2016 (most of them associated
of them associated withwith the
the Mutnovsky
Mutnovsky volcano)
volcano) (Figure
(Figure 4).
4).
The analysis
The analysis ofof seismic
seismic activity
activity atat the
the Mutnovsky
Mutnovsky volcano
volcano revealed
revealed thethe following
following geomechanical
geomechanical
features. (1) Most of the dykes were injected below and in the
features. (1) Most of the dykes were injected below and in the northeastern sectornortheastern sector of
of the
the Mutnovsky
Mutnovsky
volcano
volcano ininananarea
area22kmkm× × 1010
km.km.(2)(2)
MostMost of the
of the dykes
dykes beneath
beneath the Mutnovsky
the Mutnovsky volcanovolcano
have ahave a dip
dip angle
angle ranging from 20 ◦ to 40◦ . (3) Most of the dykes were injected at a depth ranging from −4.0 to −2.0
ranging from 20° to 40°. (3) Most of the dykes were injected at a depth ranging from −4.0 to −2.0 km
km masl and at strikes in a NE–NNE (20–50 ◦ ) direction. (4) Six dykes were injected close to the SE
masl and at strikes in a NE–NNE (20–50°) direction. (4) Six dykes were injected close to the SE boundary
boundary of the Mutnovsky production
of the Mutnovsky production geothermal reservoir at geothermal reservoir
a depthatranging
a depthfrom
ranging−6.0from −6.0
to −4.0 km −4.0 km
to masl. (5)
masl. (5) Seismic events of magnitude M during dyke injection ranged from 1.0
Seismic events of magnitude M during dyke injection ranged from 1.0 to 2.8. (6) There is a trend of dyke to 2.8. (6) There is a
trend
dip of dyke
angle dip angle
increase moving increase
from the moving from the
Mutnovsky Mutnovsky
volcano volcano
to the north to the north (1◦ /km).
(1°/km).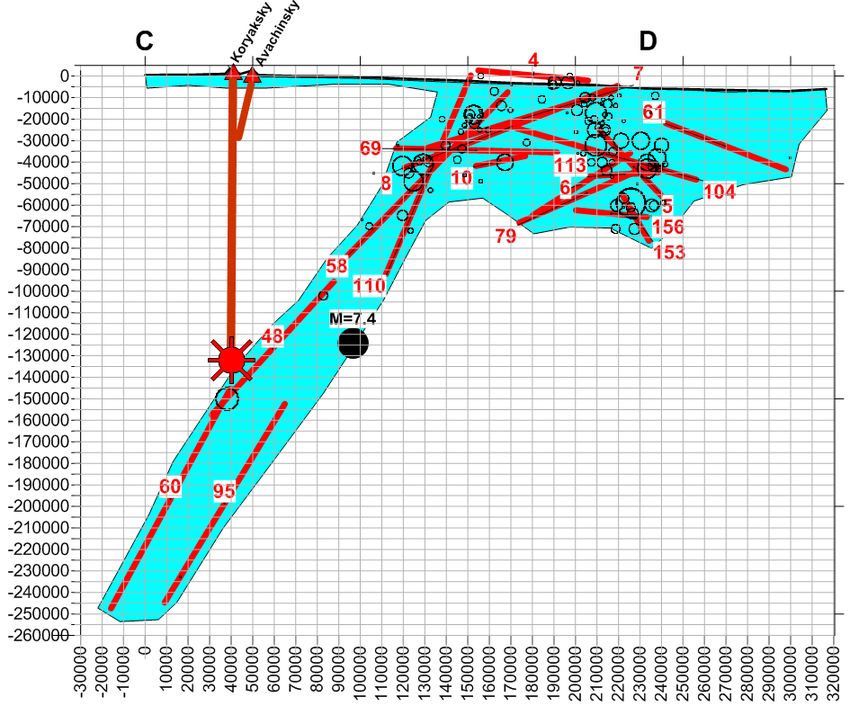
Geosciences 2020, 10, 52 6 of 16
Geosciences 2020, 10, 52 6 of 16
Figure 4. Mutnovsky–Gorely
Figure 4. Mutnovsky–Gorely area magma fracking geometry vs. known production production zone
zone geometry.
Dykes
Dykes 21.04.2019
21.04.2019 and
and 21.08.2019
21.08.2019injected
injectedclose
closeto
to well
well 035
035 are
are shown,
shown, too.
too. This figure
figure also
also gives
gives aa new
new
approach
approach for
for geothermal
geothermal production
productiontargets
targetsin
inMutnovsky
Mutnovskyarea.
area.
Thus,
Thus, dyke
dyke geometry
geometry indicated
indicated reverse
reverse fault
fault (RF)
(RF) geomechanic
geomechanic conditions
conditions [10]
[10] in
in the
the vicinity
vicinity of
of
the Mutnovsky volcano (SHmax > Shmin > Sv, SHmax striking to NE), while
the Mutnovsky volcano (SHmax > Shmin > Sv, SHmax striking to NE), while there is a trend to normal there is a trend to normal
fault
fault (NF)
(NF) conditions
conditions 10 10 km
km awayaway in in the
the region
region where
where thethe production
production geothermal
geothermal reservoir
reservoir formed.
formed.
The M = 0.67 log (V) −
The relationship M = 0.67 log (V) − 0.82 between the upper bound of the induced seismic event M
relationship 0.82 between the upper bound of the induced seismic event M and
and
magmatic injection volume V, suggested by [11], may be used for recorded
magmatic injection volume V, suggested by [11], may be used for recorded dyke volume estimates dyke volume estimates in a
range from 520
in a range from m3520to 0.252 106 m×3 ,10
m3 to×0.252 and6 mthe totalthe
3, and recorded volume of
total recorded the injected
volume of themagma
injected is magma
estimated is
at 0.67 × 10 6 m 3 from 2009–2016.
estimated at 0.67 × 10 m from 2009–2016.
6 3
There
There were were additional
additional 22 22 magma
magma injections
injections identified
identified during
during 02.2017
02.2017 toto 10.2019
10.2019 in in the
the
Mutnovsky–Gorely
Mutnovsky–Gorely geothermal geothermal area. area. MostMostofofthe the dykes
dykes beneath
beneath thethe Mutnovsky
Mutnovsky volcano
volcano havehave
a dipa
dip angle ranging from 20 ◦ to 40◦ and were injected at the depth ranging from −4.0 to −2.0 km masl
angle ranging from 20° to 40° and were injected at the depth ranging from −4.0 to −2.0 km masl and
and dipping
dipping in the
in the SEE–SE
SEE–SE (120◦ –130direction.
(120°–130°)
◦ ) direction. Most of the dykes beneath the Gorely volcano have a
Most of the dykes beneath the Gorely volcano have a
dip angle ranging from 40 ◦ to 70◦ and were injected at the depth ranging from −2.0 to −1.5 km masl
dip angle ranging from 40° to 70° and were injected at the depth ranging from −2.0 to −1.5 km masl
and ◦ –320◦ ) direction. It is worth noting two sub-parallel dykes (dip angles
and dipping
dipping in in the
the NWW
NWW (280 (280°–320°) direction. It is worth noting two sub-parallel dykes (dip angles
from ◦ ◦ , dip azimuth from 149◦ to 153◦ , depth range from −2.6 to −1.9 km masl, M from 1.25 to
from 3939° toto4343°, dip azimuth from 149° to 153°, depth range from −2.6 to −1.9 km masl, M from 1.25
1.7) injected
to 1.7) injectedin the vicinity
in the vicinityof well 035035
of well in 2019 (Figure
in 2019 4). 4).
(Figure
2.3. Northern Group of Volcanoes
2.3. Northern Group of Volcanoes
To recover the sequence of magma injections in the area of the Klyuchevskoy Volcanic Cluster,
To recover the sequence of magma injections in the area of the Klyuchevskoy Volcanic Cluster,
we used a catalog containing data of seismic monitoring at 19 seismic stations operated by the KB
we used a catalog containing data of seismic monitoring at 19 seismic stations operated by the KB
FRC UGS RAS for the 2000–2017 period (the total number of earthquakes that have been recorded
FRC UGS RAS for the 2000–2017 period (the total number of earthquakes that have been recorded
between January 1, 2000 and August 23, 2017 is 122,451). The method that we used to identify
between January 1, 2000 and August 23, 2017 is 122,451). The method that we used to identify plane-
plane-oriented earthquake clusters and fitting planes using the Frac-Digger software was described
oriented earthquake clusters and fitting planes using the Frac-Digger software was described in [2–
in [2–5]. The relevant calculated plane patches are interpreted as zones of magma emplacement in the
5]. The relevant calculated plane patches are interpreted as zones of magma emplacement in the form
form of dykes and sills. The calculations assumed the following parameters for the identification of
of dykes and sills. The calculations assumed the following parameters for the identification of plane-
plane-oriented
oriented clusters:clusters: δt ≤ 1 month,
δt ≤ 1 month, δR ≤ 6 δRkm,≤δZ6 km, km,≤N1 ≥km,
≤ 1 δZ N ≥calculations
6. The 6. The calculations
yielded yielded 1788
1788 clusters
clusters that contained
that contained 117,412 117,412 earthquakes
earthquakes (96% of (96% of the
the total total number
number of recorded
of recorded events).events).
AA vertical profile along the axis of the Klyuchevskoy Volcanic Cluster that
vertical profile along the axis of the Klyuchevskoy Volcanic Cluster that extends
extends from
from the
the
Tolbachik volcanoes to Shiveluch (Figure 5) shows that when extrapolated
Tolbachik volcanoes to Shiveluch (Figure 5) shows that when extrapolated downward, the dykes downward, the dykes
beneath
beneath Tolbachik
Tolbachik and
and Shiveluch
Shiveluch intersect
intersect at
at aa point
point that
thatlies
liesbetween
betweenabsolute
absolute depths of−165
depths of −165 and
and
−205
−205 km beneath Klyuchevskoy; it is at this location that the region of primary magma melting is
km beneath Klyuchevskoy; it is at this location that the region of primary magma melting is
thought to reside, or there is a primary magma chamber to provide magma for all
thought to reside, or there is a primary magma chamber to provide magma for all active volcanoes active volcanoes in
the Klyuchevskoy
in the Klyuchevskoy Cluster (Klyuchevskoy,
Cluster (Klyuchevskoy, Plosky Tolbachik,
Plosky Bezymyanny,
Tolbachik, Bezymyanny, andandShiveluch).
Shiveluch).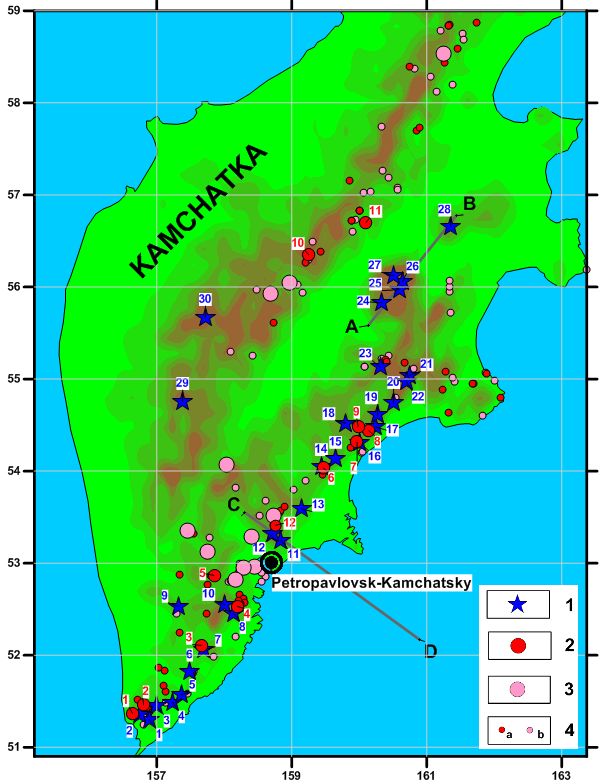
Geosciences2020,
Geosciences 10,52
2020,10, 52 77ofof16
16
Figure 5. Magma fracking system beneath the Northern group of volcanoes. The AB cross-section line
Figure 5. Magma fracking system beneath the Northern group of volcanoes. The AB cross-section line
was shown in Figure 1.
was shown in Figure 1.
The 2000–2017 magma injections directly beneath Klyuchevskoy were concentrated in the depth
Thebetween
ranges 2000–2017 −31magma
and −28 injections
km masl directly
(35%) beneath Klyuchevskoy
and between −1 andwere +2 km concentrated
masl (20%), in the
where depth
we
ranges between −31 and −28 km masl (35%) and between −1 and
hypothesize the existence of a crustal chamber (C2) and a peripheral chamber (C1), respectively (we+2 km masl (20%), where we
hypothesize
mean chamber the asexistence
a plexus ofofa crustal
sills andchamber
dykes here).(C2) and Theacrustal
peripheral
magma chamber
chamber (C1),(C2)respectively
was found (we to
mean
contain dykes that dip at angles of 70–80 (30%) and sills that dip at 15–20 (8%); one also finds to
chamber as a plexus of sills and dykes
◦ here). The crustal magma chamber
◦ (C2) was found an
contain
increasingdykes that dip
number at angles
of nearly of 70–80°
east–west (30%)dykes
striking and sills
that that
supplydipmagma
at 15–20° (8%);
to the one also
nearby finds an
Bezymyanny
increasing number of nearly east–west striking dykes that supply
and Krestovsky volcanoes. Nine episodes of intensive dyke emplacement and seven episodes of magma to the nearby Bezymyanny
and Krestovsky
intensive volcanoes.were
sill emplacement Ninerecorded
episodesinof theintensive
C2 chamber dykeduring
emplacement
the periodand seven episodes
of interest (2000–2017); of
intensive sill emplacement
the dyke episodes precededwere recorded
the sill episodesinby the
anC2 chamber
advance timeduring
of one theyearperiod of interest
(two cases), (2000–
the episodes
2017); the dyke episodes preceded the sill episodes by an advance time
occurred simultaneously (five cases), or they did not terminate in sill emplacement (one case), which of one year (two cases), the
episodes occurred simultaneously (five cases), or they did not terminate
provides evidence of a change in the geomechanical condition around the C2 chamber in the range in sill emplacement (one
case),
from which
horizontal provides evidence
extension of a compression.
to radial change in the geomechanical condition around the C2 chamber
in theThe
range from horizontal extension
dip angles and azimuths of dykes to radial andcompression.
sills in the peripheral chamber (C1) are distributed
The dip angles and azimuths of dykes
rather uniformly; one notes some increase in the number and sills in the peripheral
of dykes that chamber
dip at(C1) angles areofdistributed
35◦ to 50◦
rather uniformly;
◦ ◦ one notes some increase in the number of dykes that
and 65 to 80 . There is also a set of dykes that dip at northeast azimuths (i.e., striking along dip at angles of 35° to 50° andthe
65° to 80°. There is
Klyuchevskoy-Krestovsky line).also a set of dykes that dip at northeast azimuths (i.e., striking along the
Klyuchevskoy-Krestovsky line).
Tolbachik Volcano is characterized by injections of magma in the depth range between −8 and −1
Tolbachik Volcano is
km masl, with most dykes dipping more characterized bysteeply
injections
than of60
magma
◦ (67%). in In
theaddition,
depth range between −8
we identified and
a set of
−1 km masl, with most dykes dipping more
◦ steeply than 60° (67%). In addition,
dykes that dip at azimuths of 180–220 (26%) and strike along the Ostry Tolbachik to Plosky Tolbachik we identified a set of
dykes
to thethat dip at azimuths
Bol’shaya Udina line. of 180–220° (26%) and strike along the Ostry Tolbachik to Plosky Tolbachik
to theShiveluch
Bol’shayaisUdina line.
characterized by magma injections in the depth ranges between −4 and −2 km masl
Shiveluch is characterized
(37%) and between 0 and +2 km by(47%),
magma injections
where in the depth
two peripheral rangeschambers
magma between are −4 and −2 km masl
hypothesized to
(37%) and between 0 and +2 km (47%), where two peripheral magma chambers
reside. The injections mostly occurred in the form of sills that dip at angles below 5 , with some trend are ◦ hypothesized to
reside. The injections
of prevailing westernmostly occurred in the form of sills that dip at angles below 5°, with some trend
dip azimuths.
of prevailing
Bezymyanny western dip azimuths.
Volcano receives magma from the crustal magma chamber beneath Klyuchevskoy
Volcano (C2), which lies at areceives
Bezymyanny Volcano magma −31
depth between fromandthe−28crustal magma
km masl. Thechamber
injections beneath
beneath Klyuchevskoy
Bezymyanny
Volcano (C2), which lies at a depth between −31 and −28
occurred in the depth range between −2 and +2 km (93%), where a peripheral magma chamber km masl. The injections beneathis
Bezymyanny
hypothesizedoccurredto exist. inThe the depth range
injections mostly between
occurred −2 inandthe+2form
km (93%),
of sills where
that dip a peripheral
at angles below magma 15◦
chamber is hypothesized to exist. The injections
◦ mostly occurred in the
(27%) and low-angle dykes that dip at 50 or less (58%); the dip azimuths are distributed uniformly form of sills that dip at angles
below
over all15°directions.
(27%) and low-angle dykes that dip at 50° or less (58%); the dip azimuths are distributed
uniformly over all directions.
The volumes of magma injection from magma chambers can be estimated using empirical
The volumes
relationships that relate of magma injectionmagnitude
the maximum from magma of thechambers
triggeredcan be estimated
seismicity using empirical
to the volume of injected
relationships that relate the maximum magnitude of the triggered
magma [11]: M = 0.67 log(V) − 0.82, where M is the maximum magnitude of triggered seismic seismicity to the volume of injected
events
magma [11]: M = 0.67 log(V) − 0.82, where M is the maximum magnitude of triggered seismic eventsGeosciences 2020, 10, 52 8 of 16
and V is the injection volume. The results from this assessment of dyke and sill injections volumes for
the volcanoes in the Klyuchevskoy Cluster during 2000–2017 are Klyuchevskoy (peripheral chamber
C1)—0.6 × 10⁶ m3 , Klyuchevskoy (crustal chamber C2) —2.4 × 10⁶ m3 , Bezymyanny—4.7 × 10⁶ m3 ,
Tolbachik—13.2 × 10⁶ m3 , Shiveluch—22 × 106 m3 . Assuming the enthalpy of magma at a temperature
of 1200 ◦ C to be 1000 kJ/kg and the density of magma to be 2800 kg/m3 , one can estimate the mass
discharge and the corresponding thermal power due to magma injections for the time elapsed from
January 2000 to August 2017.
The thermal power values for magma injections in the volcanic plumbing systems considered here
and the output estimates for the respective volcanoes from [15] yields the following ratios between
the discharge of magmas stored beneath volcanoes and that of magma ejected onto the ground
surface (volume of intruded magma)/(volume of erupted magma): 0.8% for Klyuchevskoy, 14.9% for
Bezymyannyy, 23.2% for Tolbachik, and 72.9% for Shiveluch.
Thus, Kluchevskoy volcano magma injections (dykes) took place in “normal fault” (NF) conditions,
forming a permeable reservoir down to −35 km msl and two magma chambers within it; Shiveluch
volcano magma injections (sills) occurs in “reverse fault” (RF) conditions at shallow levels from −4 km
masl to −2 km masl, forming sills in an area 15 km across.
2.4. Kamchatka East Volcanic Belt and Adjacent Shelf Area
Critically stressed faults are key players in creation of the productive reservoirs and generation of
strong earthquakes [10]. We performed a Frac-Digger analysis of the Kamchatka’s regional seismicity to
identify the network of such active faults, which are identified as plane-oriented clusters of hypocenters
in Frac-Digger terms [16].
We used the regional catalog of earthquakes from KB FRC UGS RAS, which includes 5972
earthquakes with M values above 4.25 during the time period from 01.1980 to 02.2016. The following
criteria for seismogenic planes selection were used: N ≥ 6, δt ≤ ∞, δZ ≤ 10 km, δR ≤ 100 km. These
criteria correspond to the assumption of the existing network of continuously active regional faults.
Based on the above, we found 156 plane-oriented clusters of earthquakes, which are interpreted
as active seismogenic faults. Most of them are located beneath Kamchatka’s eastern shelf, between the
shore line and ocean trench (Figure 6). Seventeen faults are found to be the most active (with more
than 100 earthquakes each). Most of the active faults are characterized by dip angles from 50◦ to 70◦
and a dip azimuth NWW from 300◦ to 310◦ , striking subparallel to the ocean trench. This points to the
extension in the NWW direction and NF geomechanical conditions as a whole.
Seismogenic fault #110 includes the hypocenter of earthquake M = 7.3 on 24 Nov 1971, which was
the strongest felt in Petropavlovsk-Kamchatsky since 1959. Faults with other directions (especially in
shallow conditions at elevations above −10 km masl) are found too, which reflects local geomechanical
features. One of such faults is #4 (175 earthquakes included, dip angle 53◦ , dip azimuth 217◦ ) striking
in the direction of Petropavlovsk-Kamchatsky.
Seismogenic fault #35 includes the hypocenter of earthquake M = 6.9 on 17 Aug. 1983, which was
accompanied with the ground deformations described by [17]. Seismogenic fault #35 has a dip angle
of 60.3◦ , dip azimuth of 281.5◦ , and includes 77 hypocenters of earthquakes.Geosciences 2020, 10, 52 9 of 16
Geosciences 2020, 10, 52 9 of 16
Kamchatkashelf
Figure 6.6. Kamchatka
Figure shelfactive
activeseismogenic
seismogenicfaults.
faults.Traces
Tracesof
ofseismically
seismicallyactive
activefaults
faults(black
(blacklines
lines
with numbers at elevation of −5 km masl, red lines at elevations of −20 km masl), circles corresponds
with numbers at elevation of −5 km masl, red lines at elevations of −20 km masl), circles corresponds
toregional
to regionalearthquakes
earthquakesepicenters
epicentersin
inaarange
rangeof
ofdepth
depthabove −30km
above−30 kmasl
asl(size
(sizeofofcircle
circleproportional
proportionaltoto
earthquakes magnitudes). For other symbols, see the legend in Figure
earthquakes magnitudes). For other symbols, see the legend in Figure 1. 1.
Seismogenicfaults
Seismogenic faultsdistributions
distributionspoint
pointtotoaalower
lowerlimit
limitof ofthe
the hydrofrack
hydrofrackpropagation
propagationintointothe
the
subductionplate
subduction plate(down
(downto −250km
to−250 kmmasl),
masl),where
wherethisthisfluid
fluidcancanactactas
asthe
thekey
keyingredient
ingredientfor
formagma
magma
melting to recharge the primary chambers of active volcanoes
melting to recharge the primary chambers of active volcanoes (Figure 7). (Figure 7).
ItIt is
is also
also worth
worthnoting
notingthat
that98%
98%of of
all all
earthquakes
earthquakes formed
formeda plane-oriented clusters
a plane-oriented network,
clusters which
network,
characterizes
which the geomechanical
characterizes conditions
the geomechanical of collided
conditions ofplates andplates
collided suggestsandhydrofracking mechanisms
suggests hydrofracking
due to fluids (possible phases are: water, oil, gas) generation there.
mechanisms due to fluids (possible phases are: water, oil, gas) generation there.
Incase
In caseofofwater,
water, the
the empirical
empirical relationship
relationship M M ==0.67
0.67log (V) ++1.42
log (V) 1.42between
betweenthe
theupper
upperbound
boundof of
the induced seismic event M and water injection volume V, suggested by [11],
the induced seismic event M and water injection volume V, suggested by [11], may be used for water may be used for water
volumesrecharge
volumes recharge estimates
estimatesinto
into the
the active
active faults
faults network
network of of the
the Kamchatka
Kamchatka shelf.
shelf. This
Thisyields
yieldsin
inaa
range from 0.00007 to 0.3 km3, and the total volume of the recharged water is estimated at 1.87 km3
during the time interval from 1980 to 2016 (over approximately 750 km of arc length).Geosciences 2020, 10, 52 10 of 16
range from 0.00007 to 0.3 km3 , and the total volume of the recharged water is estimated at 1.87 km3
during the time
Geosciences 2020,interval
10, 52 from 1980 to 2016 (over approximately 750 km of arc length). 10 of 16
In case of gas, the empirical relationship is slightly modified (supercritical CO2 injection) to M =
0.67 log (V)In case
− 0.30 of [11];
gas, the empirical
then, relationship
this may be used foris slightly modified (supercritical
rough estimates of gas volumesCO2generated
injection) tofrom
M = deep
0.67 log (V)
hydrocarbon − 0.30to[11];
sources then, thisinto
be injected maythebeactive
used for rough
faults estimates
network of gas
of the volumes generated
Kamchatka shelf. Thisfrom
yields in
deep hydrocarbon sources3 to be injected into the active faults network of the Kamchatka shelf. This
a range from 0.024 to 111 km , and the total volume of the injected gas is estimated at 691 km3 during
yields in a range from 0.024 to 111 km3, and the total volume of the injected gas is estimated at 691
the time3 interval from 1980 to 2016. In relation to this, it is worth noting that methane hydrates and
km during the time interval from 1980 to 2016. In relation to this, it is worth noting that methane
methane submarine
hydrates and methanedischarges are widely
submarine distributed
discharges along the
are widely east coast
distributed of Kamchatka.
along the east coast of
Then, we
Kamchatka. perform an additional analysis of the 3D distribution of the 200 strongest earthquakes (М>
5.65) fromThen,
the above-mentioned
we perform an additionalcataloganalysis
of seismic events
of the of KB FRCofUGS
3D distribution RAS.
the 200 The following
strongest selection
earthquakes
criteria
(Мwere
> 5.65) used
frominthe Frac-Digger2:
above-mentionedδZ = catalog
4 km, δR = 100 km,
of seismic N =of5.KB
events The output
FRC UGS results
RAS. The show that 102 of
following
selection
the 200 strongestcriteria were used form
earthquakes in Frac-Digger2: δZ = 4 km,
11 plane-oriented δR = 100
clusters of km, N = 5. The output
hypocenters. results show
A comparative analysis
that 102 offaults
of seismogenic the 200 strongest with
orientation earthquakes form 11 plane-oriented
the mechanisms of corresponding clusters of hypocenters.
earthquakes A
(estimated at
comparative analysis of seismogenic faults orientation with the mechanisms
http://www.globalcmt.org/CMTsearch.html) shows an average intersection angle of 33 . This may have of corresponding
◦
earthquakes (estimated at http://www.globalcmt.org/CMTsearch.html) shows an average
the following geomechanical interpretation: seismogenic planes are marked as opening mode fractures
intersection angle of 33°. This may have the following geomechanical interpretation: seismogenic
(hydrofractures), which formed orthogonal to the least effective stress during magma injection, while
planes are marked as opening mode fractures (hydrofractures), which formed orthogonal to the least
the EQ’s mechanisms
effective stress during planes
magma areinjection,
markedwhileas shear faults
the EQ’s that initiated
mechanisms planesfrom the main
are marked opening
as shear faultsmode
fault that
(dyke) using pre-existing fractures systems.
initiated from the main opening mode fault (dyke) using pre-existing fractures systems.
Figure
Figure 7. Cross-section
7. Cross-section ofofKamchatka
Kamchatka along
along the
the CD
CDline
line(see
(seeFigure 1), 1),
Figure showing traces
showing of active
traces of active
seismogenic
seismogenic faults.
faults. The The
blueblue
colorcolor covers
covers the where
the area area where plane-oriented
plane-oriented seismogenic
seismogenic faults
faults are
are possible,
possible, which points to hydrofrack or brittle rock conditions. Numbers correspond to
which points to hydrofrack or brittle rock conditions. Numbers correspond to the fault numbers shown the fault
numbers shown in Figure 6. The star denotes suggested active volcanoes’ primary magma chamber
in Figure 6. The star denotes suggested active volcanoes’ primary magma chamber positions.
positions.
3. Hydrothermal Response to Magma Fracking
3. Hydrothermal Response to Magma Fracking
3.1. Uzon-Geysernaya Caldera Geysers
3.1. Uzon-Geysernaya Caldera Geysers
Geysers are examples of cyclically erupted boiling hot springs. It has been shown that the driving
mechanism of geysers cycling is gas-lift assisted eruptions, where non-condensable gases (mainly CO2 )
are important players [9,18] due to CO2 significantly drops boiling temperatures.Geosciences 2020, 10, 52 11 of 16
Geysers are examples of cyclically erupted boiling hot springs. It has been shown that the driving
Geosciences 2020, 10, 52 11 of 16
mechanism of geysers cycling is gas-lift assisted eruptions, where non-condensable gases (mainly
CO2) are important players [9,18] due to CO2 significantly drops boiling temperatures.
There is evidence from gas sampling at the Velikan Velikan Geyser
Geyser that at the time of full activity before
Jan. 3, 2014, gas composition was dominated
Jan. 3, 2014, gas composition was dominated by CO by CO . Gas
2 2. Gas sampling
sampling from September
from September20132013
showed that
showed
the
thatgas
thecomponent
gas componentof theofhydrothermal reservoir
the hydrothermal that fed
reservoir thefed
that Velikan GeyserGeyser
the Velikan was dominated by carbon
was dominated by
dioxide (CО2 , 61.5%)
carbon dioxide and nitrogen
(СО2, 61.5%) (N2 , 32.1%),
and nitrogen along with
(N2, 32.1%), alonga with
significant amount
а significant of methane
amount (CH4 ,
of methane
5.8%)
(CH4, and
5.8%)hydrogen (Н2 , 0.45%)
and hydrogen [9]. Gas[9].
(Н2, 0.45%) composition in 2014–2019
Gas composition in the Velikan
in 2014–2019 and Bolshoy
in the Velikan geysers
and Bolshoy
reveals
geysersnitrogen
reveals becoming a dominanta gas,
nitrogen becoming while CO
dominant gas,2 declined
while CO to 2less than 1%
declined to[19].
less In contrast,
than a new
1% [19]. In
geyser,
contrast,Shaman (Mutny),
a new geyser, developed
Shaman in 2008
(Mutny), in a channel
developed in 2008of in
thea former
channelhot springs
of the formerof Uzon caldera,
hot springs of
just
Uzon 12caldera,
km apart [20].
just 12 The
km gas
apart composition
[20]. The gasof the newly formed
composition of theShaman Geyser was
newly formed characterized
Shaman Geyser was by
CO 2 domination
characterized by according to our gas
CO2 domination sampling
according in 2018
to our and 2019.in 2018 and 2019.
gas sampling
We
We interpret
interpret this
this as
as aa redistribution
redistribution ofof the
the magmatic
magmatic gas gas recharge
recharge from
from magma
magma plumbing
plumbing
systems of the Uzon-Geysernaya caldera in the following way: the Valley of Geysers’ hydrothermal
system magmatic CO22 recharge was reduced, while that of the the Uzon
Uzon geothermal
geothermal reservoir
reservoir COCO22
recharge increased.
increased.
3.2. Koryaksky Narzan
3.2. Koryaksky Narzan Thermal
Thermal Springs
Springs
The ◦ C) and Isotovsky thermal springs
The Koryaksky
Koryaksky Narzan
Narzan CO -reach thermal
CO22-reach thermal springs
springs (12–14
(12–14 °C) and Isotovsky thermal springs
(40–50 ◦ C) are located in a north sector of Koryaksky volcano, where magma injections have taken
(40–50 °C) are located in a north sector of Koryaksky volcano, where magma injections have taken
place
place since
since2008
2008[4,5].
[4,5].We
Wehave
havebeen
beendoing continuous
doing continuous temperature
temperature monitoring
monitoringin Isotovsky spring
in Isotovsky (IS)
spring
since 2010 and in Koryaksky Narzan springs (KN1 and KN2) since
(IS) since 2010 and in Koryaksky Narzan springs (KN1 and KN2) since 2017. 2017.
We
We already
already reported
reported transient
transient temperature
temperature anomalies
anomalies recorded
recorded in in Isotovsky
Isotovsky inin 2012–2013
2012–2013 and
and
in
in 2015–2016, which were apparently related to dyke injections in adjacent areas that occurred on
2015–2016, which were apparently related to dyke injections in adjacent areas that occurred on
2.08.2011
2.08.2011 and
and 28.02.2016
28.02.2016 correspondingly.
correspondingly. The The latest
latest dyke
dyke injections
injections onon 14.11.2017
14.11.2017 and
and 22.04.2019
22.04.2019 are
are
also
also associated
associated with
with thermal
thermal tales
tales in
in Isotovsky
Isotovsky spring
spring (Figure
(Figure 8).
8).
Figure 8. Temperatures recorded in Isotovsky hot spring and suggested times of dyke injections in
Figure 8. Temperatures recorded in Isotovsky hot spring and suggested times of dyke injections in
adjacent areas. T—observational temperature; Tav—annual maximum monthly temperature (in a
adjacent areas. T—observational temperature; Tav—annual maximum monthly temperature (in a
referenced year 2010/2011); Tmax—maximum monthly temperature (in a current year). Arrows above
referenced year 2010/2011); Tmax—maximum monthly temperature (in a current year). Arrows above
correspond to the dyke events shown in Figure 2, bars on a plot above correspond to the dykes’ events
correspond to the dyke events shown in Figure 2, bars on a plot above correspond to the dykes’ events
magnitudes shown in Figure 3.
magnitudes shown in Figure 3.
Koryaksky Narzan-2 (K2 in Figures 2 and 3) transient temperature records 2017–2019 look very
stable with a few temperature drops from 0.1 to 0.4 ◦ C (Figure 9). The most significant drop observedGeosciences 2020, 10, 52 12 of 16
Geosciences 2020, 10, 52 12 of 16
Koryaksky Narzan-2 (K2 in Figures 2 and 3) transient temperature records 2017–2019 look very
stable with a few temperature drops from 0.1 to 0.4 °C (Figure 9). The most significant drop observed
is 0.4 ◦°C,
C, which may
may be
be caused
caused by
by aa H
H22O–CO2 boiling
boiling temperature
temperature drop in a spring pool due to the
magmatic CO22 release associated with dykes injections in the adjacent area.
area.
Figure 9. Koryaksky Narzan-2 transient temperature records 2017–2019. The significant temperature
Figure
drop on9.0.4
Koryaksky
◦ C may beNarzan-2 transient
caused by temperaturedecline
boiling temperature recordsdue
2017–2019. The significant
to additional temperature
magmatic gas recharge.
drop on 0.4 °C may be caused by boiling temperature decline due to additional magmatic
The arrows above corresponds to the dyke events shown in Figure 2, while the bars on the plot above gas
recharge. The arrows above corresponds to the dyke events
correspond to the dyke event magnitudes shown on Figure 3. shown in Figure 2, while the bars on the
plot above correspond to the dyke event magnitudes shown on Figure 3.
3.3. Mutnovsky Production Reservoir
3.3. Mutnovsky
The MutnovskyProduction Reservoirgeothermal reservoir includes at least two production faults
(Dachny)
geometrically and hydraulically
The Mutnovsky (Dachny) connected
geothermal to the magmaincludes
reservoir fracking system
at leastof two
Mutnovsky volcano
production [7]
faults
(see also Figureand
geometrically 4). hydraulically connected to the magma fracking system of Mutnovsky volcano [7]
Production
(see also Figure 4).fault #1 or the Main production zone (dip angle 58◦ , dip azimuth 110◦ ) includes 20
production feed-zones
Production as or
fault #1 follows: wells
the Main O29W, A3-1,
production 4-E,(dip
zone O27, O19,58°,
angle O8, dip
O45,azimuth
O1, O14,110°)
A2-1,includes
A2-2, O16,20
O13, 1, A3-2,feed-zones
production A4, 26, 24,as and 8 and the
follows: Dachny
wells O29W, thermal feature.
A3-1, 4-E, O27,ThisO19,nearly coincides
O8, O45, withA2-1,
O1, O14, the “Main
A2-2,
production
O16, O13, 1,zone”
A3-2,defined
A4, 26, in24,[21,22]
and 8 that
and has
the aDachny
dip angle of 60◦feature.
thermal and a dip Thisazimuth
nearlyof 106◦ . with the
coincides
Production fault #2 ordefined
the North-East ◦ ◦ ) includes
“Main production zone” in [21,22]production
that has a zone (dip angle
dip angle of 60°57and, dip azimuth
a dip azimuth143of 106°.
17 production
Production feed zones
fault asthe
#2 or follows: wells A2-2,
North-East O29W,zone
production A3-2, A4,angle
(dip 26, A2-1, O16,azimuth
57°, dip O13, 1, A3-1, O8, O37,
143°) includes
O42, O48, O53N,
17 production andzones
feed O55 (10 of them also
as follows: wells belong
A2-2,toO29W,
production
A3-2, zone #1) A2-1,
A4, 26, and the Verkhne-Mutnovsky
O16, O13, 1, A3-1, O8,
thermal
O37, O42, feature.
O48, O53N, and O55 (10 of them also belong to production zone #1) and the Verkhne-
We performed
Mutnovsky thermal30-day
feature.continuous monitoring of the non-condensable gases (most of gas content
is COWe2 ) partial pressure
performed in the
30-day turbine condenser
continuous monitoringofofthe thegeothermal
non-condensablepowergases
plant.(most
To estimate PCO2 ,
of gas content
we performed
is CO simultaneous
2) partial pressure in themeasurements
turbine condenser of the
ofsteam condensate
the geothermal pressure
power plant.PcTo
and temperature
estimate PCO2,
Tc; then, PCO was calculated as a difference between Pc and saturation
we performed2 simultaneous measurements of the steam condensate pressure Pc and temperature Tc;pressure corresponding to
temperature
then, PCO2 was Tc. calculated as a difference between Pc and saturation pressure corresponding to
Figure 10Tc.
temperature shows the transient PCO2 change during the observational period of time from 25.08.2019
to 25.09.2019.
Figure 10It shows
is clearly seen
the that at least
transient PCO14 maximaduring
2 change of PCOthe2 synchronized
observational with 14 minimums
period of time of Tc,
from
which detect
25.08.2019 tonon-condensable gas arrivals
25.09.2019. It is clearly seeninto
thatthe
at turbine
least 14from
maximathe production geothermal reservoir.
of PCO2 synchronized with 14
Some of these
minimums of PCO 2 peaksdetect
Tc, which may be related to magmatic
non-condensable gas gas recharge
arrivals into impulses,
the turbine followed by production
from the the magma
fracking
geothermal processes described
reservoir. Some of above
these(see
PCO Section
2 peaks2.2 of this
may paper).to magmatic gas recharge impulses,
be related
followed by the magma fracking processes described above (see Section 2.2 of this paper).Geosciences 2020, 10, 52 13 of 16
Geosciences 2020, 10, 52 13 of 16
Figure 10. Estimated partial pressure of CO2 in the condenser at the outlet of the turbine of the
Figure 10. Estimated
geothermal partial pressure of CO2 in the condenser at the outlet of the turbine of the
power plant.
geothermal power plant.
4. Discussion
4. Discussion
The key question in this paper is: How can we verify that plane-nested earthquakes are tracking
magma Theinjections
key question in the
inshapes of dykes
this paper is: Howor sills
can webeneath
verifyactive volcanoes? The
that plane-nested answer isare
earthquakes in the form
tracking
of a question,
magma too: in
injections what
the other
shapes fluid exceptormagma
of dykes can demonstrate
sills beneath such hydrofracking
active volcanoes? The answer iscapabilities?
in the form
Superheated
of a question,water and non-condensable
too: what other fluid exceptgases magma (possibly CO2 ) are other
can demonstrate suchcandidates
hydrofracking for such working
capabilities?
fluid duties. However, superheated water in shallow permeable fracture
Superheated water and non-condensable gases (possibly CO2) are other candidates for such working reservoirs conditions is
very
fluid sensitive to host rock
duties. However, temperatures
superheated waterand is easilypermeable
in shallow convertedfracture
into high-compressible
reservoirs conditions two-phase
is very
conditions,
sensitive toforming
host rock geothermal
temperaturesproduction
and isfields.
easilyAnother
converted fluidinto
is CO , especially
high-compressible
2 magmatic CO2
two-phase
having less forming
conditions, compressibility
geothermal as compared
production to superheated
fields. Another steam,
fluidandis COit may act as a magmatic
2, especially working fluid CO2
coupling
having less with magma. If so,
compressibility asthen we should
compared extend oursteam,
to superheated term of and magma
it mayfracking
act as abeneath
workingactivefluid
volcanoes
coupling with to themagma.
term magma+CO
If so, then2 we fracking
should beneath
extendactive
our termvolcanoes.
of magma CO2 fracking
impact isbeneath
also useful to
active
explain
volcanoes traces of fracks
to the term in a slope of Koryaksky
magma+CO volcano (Figure
2 fracking beneath 3), with noCO
active volcanoes. associated
2 impact magma
is alsodischarge
useful to
on the surface
explain tracesatofthe same in
fracks time. In thisofconnection,
a slope Koryakskyit volcano
is worth noting
(Figurethat 3), magmatic CO2 redistribution
with no associated magma
appears to
discharge on be the key reason to explain the transfer of geysers activity from
surface at the same time. In this connection, it is worth noting that magmatic CO Geysers Valley to Uzon in2
Kamchatka
redistribution andappears
recent (2018)
to be thereactivation
key reason of Steamboat
to explain theGeyser in Yellowstone.
transfer of geysers activity from Geysers
ValleyAnother
to Uzonimportant
in Kamchatka pointand is the
recentaccuracy of seismic hypocenter
(2018) reactivation of Steamboat data and in
Geyser uniqueness
Yellowstone. of the
Frac-Digger
Another method
importantfor plane-oriented shapes of
point is the accuracy definition. There is no uniqueness,
seismic hypocenter since we found
data and uniqueness of the more
Frac-
fracks
Diggerusing
method less for
severe criteria of selections
plane-oriented in Frac-Digger
shapes definition. There (see
is Section 2.1). Thus,
no uniqueness, we we
since suggest
found that 3D
more
distributions
fracks using less of magma
severe fracks
criteriabeofconsidered
selections in a plausible
Frac-Diggerscenario of magma
(see Section 2.1).fracking
Thus, we beneath
suggest active
that
volcanoes, but these
3D distributions may include
of magma fracksmore or less magma+CO
be considered a plausible 2 dykes,
scenario depending
of magma onfracking
the Frac-Digger
beneath
selection parameters.
active volcanoes, but Nevertheless,
these may include some more
Frac-Digger
or less selections
magma+CO pointed
2 dykes, to 90%–95%
dependingofon earthquake
the Frac-
hypocenters
Digger selection belonging to plane-oriented
parameters. Nevertheless, clusters,
somemeaning that fracking
Frac-Digger selections is a pointed
dominant toprocess
90%–95% there.
of
High-temperature
earthquake hypocenters (HT) geothermal
belonging system formation
to plane-oriented due to meaning
clusters, magma fracking is also well
that fracking is a explained
dominant
in terms there.
process of the magma thermal-hydrodynamic modeling.
Conceptual
High-temperature 2D iTOUGH2-EOS1sc
(HT) geothermal system thermal formation
hydrodynamic due tomodeling
magma fracking of the is Mutnovsky
also well
magmatic–hydrothermal
explained in terms of the system magma[7] reasonably explains itsmodeling.
thermal-hydrodynamic evolution over the most recent 1500–5000
yearsConceptual
in terms of2D heat recharge (supplied
iTOUGH2-EOS1sc by injected
thermal dykes modeling
hydrodynamic from the of active funnel Mutnovsky-4)
the Mutnovsky magmatic–
and mass recharge
hydrothermal system(water injected through
[7] reasonably explainstheitsdormant
evolutionvolcanic
over thefunnels
mostMutnovsky-3
recent 1500–5000 and possibly
years in
Mutnovsky-2) conditions.
terms of heat recharge We emphasize
(supplied that the
by injected magmatic
dykes from the injection
active rate is approximately
funnel Mutnovsky-4)equivalent
and mass
recharge
to the heat (water injected
discharge ratethrough the dormant
(455 MWt). volcanic funnels
This is equivalent Mutnovsky-3455
to approximately and possibly
kg/s Mutnovsky-
of magma, which
2) in
is conditions. We emphasize
turn equivalent to from that15.3 the
to 25.6 km3 ofinjection
magmatic magmarate overis3000–5000
approximately years.equivalent
This volume to thevalue
heat
discharge rate (455 MWt). This is equivalent to approximately 455 kg/s of magma, which is in turnYou can also read