Determination of Upland Rice Cultivar Coefficient Specific Parameters for DSSAT (Version 4.7)-CERES-Rice Crop Simulation Model and Evaluation of ...
←
→
Page content transcription
If your browser does not render page correctly, please read the page content below
American Journal of Plant Sciences, 2021, 12, 782-795
                                                                                               https://www.scirp.org/journal/ajps
                                                                                                           ISSN Online: 2158-2750
                                                                                                             ISSN Print: 2158-2742

Determination of Upland Rice Cultivar
Coefficient Specific Parameters for DSSAT
(Version 4.7)-CERES-Rice Crop Simulation
Model and Evaluation of the Crop Model under
Different Temperature Treatments conditions

Shams Shaila Islam1*, Ahmed Khairul Hasan2
1
 Department of Agronomy, Faculty of Agriculture, Hajee Mohammad Danesh Science and Technology University, Dinajpur,
Bangladesh
2
 Department of Agronomy, Faculty of Agriculture, Bangladesh Agricultural University, Mymensing, Bangladesh

How to cite this paper: Islam, S.S. and       Abstract
Hasan, A.K. (2021) Paper Title. American
Journal of Plant Sciences, 12, 782-795.       To develop basis for strategic or arranged decision making towards crop yield
https://doi.org/10.4236/ajps.2021.125054      improvement in Thailand, a new method in which crop models could be used
                                              is essential. Therefore, the objective of this study was to measure cultivar spe-
Received: April 10, 2021
Accepted: May 23, 2021
                                              cific parameters by using DSSAT (v4.7) Cropping Simulation Model (CSM)
Published: May 26, 2021                       with five upland rice genotypes namely Dawk Pa-yawm, Mai Tahk, Bow Leb
                                              Nahng, Dawk Kha 50 and Dawk Kahm. Experiment was laid out in a Com-
Copyright © 2021 by author(s) and
                                              pletely Randomized Design (CRD) with split plot design. Results showed that
Scientific Research Publishing Inc.
This work is licensed under the Creative      five upland rice genotypes had significantly affected each other by different
Commons Attribution International             temperature treatments (28˚C, 30˚C, 32˚C) with grain yield, tops weight,
License (CC BY 4.0).                          harvest index, flowering, and maturity date. At the same time, all the pheno-
http://creativecommons.org/licenses/by/4.0/
                                              logical traits had highly significant variation with the genotypes. The cultivar
               Open Access
                                              specific parameters obtained by using a temperature tolerant cultivar (Basma-
                                              ti 385) with five upland genotypes involved in the DSSAT4.7-CSM. Model
                                              evaluation results indicated that utilizing the estimated cultivar coefficient
                                              parameters, model simulated well with varying temperature treatments as in-
                                              dicated by the agreement index (d-statistic) closer to unity. Hence, it was es-
                                              timated that model calibration and evaluation was realistic in the limits of test
                                              cropping seasons and that CSM fitted with cultivar specific parameters can be
                                              used in simulation studies for investigation, farm managing or decision mak-
                                              ing. This electronic document is a “live” template. The various components of
                                              your paper [title, text, heads, etc.] are already defined on the style sheet, as il-

DOI: 10.4236/ajps.2021.125054        May 26, 2021                782                            American Journal of Plant Sciences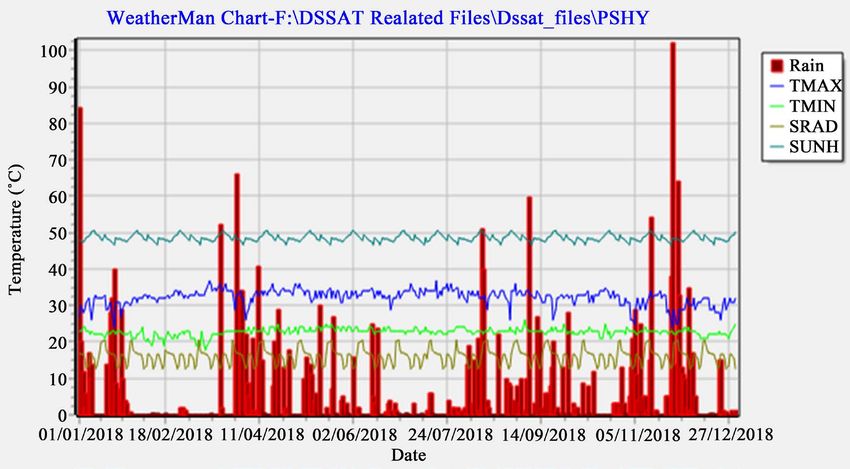
S. S. Islam, A. K. Hasan

                                  lustrated by the portions given in this document.

                                  Keywords
                                  DSSAT-CERES-Rice Crop Simulation Model, Temperature, Phenology,
                                  Upland Rice, Genotypic Cultivar Coefficient

                                1. Introduction
                                Crop simulation models have been utilized globally as an effective or planned
                                research for decision support tools in crop productivity or resources manage-
                                ment. Several crop models used from long time to assist crop management prac-
                                tices with exploring physiological processes under different environments [1].
                                The Decision Support Systems for Agrotechnology Transfer (DSSAT) is a popu-
                                lar package software comprises crop simulation models (CSM) for over 42 dif-
                                ferent crops including rice. The DSSAT software consists of: 1) data base man-
                                agement system for soil, weather, genetic coefficients, and management inputs;
                                2) crop simulation models (CSM); 3) series of utility programs; 4) series of
                                weather generation programs; 5) strategy evaluation program to evaluate options
                                including choice of variety, planting date, plant population density, row spacing,
                                soil type, irrigation, fertilizer application, initial conditions on yields, water
                                stress in the vegetative or reproductive stages of development, and net returns.
                                DSSAT-CSM models simulate growth, development, and yield of crops as a
                                function of the soil-plant-atmosphere-management dynamics [2].
                                  Crop modelling can also be useful to understand the scientist, researchers
                                define research priorities. Using a model to estimate the importance and the
                                effect of certain parameters, a researcher can observe which factors should be
                                more studied in future research, thus increasing the understanding of the sys-
                                tem. Crop Simulation Models (CSM) are tools of systems that define proce-
                                dures of crop growth and development as an act of weather, soil conditions,
                                crop management and help in solving problems related to crop production [3].
                                CSM was used to simulate grain yield, biomass, and water balance in rice crop
                                [4]. For dynamic crop simulation model accurate estimation of crop cultivar
                                coefficients is the main point into use (for research as well as decision making)
                                for improvement, identification and consequently narrowing gaps in our
                                knowledge over crops and biophysical aspects for improved agricultural prod-
                                uctivity.
                                  Rice (Oryza sativa L.) rice is one of the most important crops and it represents
                                a staple food for over half of the world’s population, with a global production of
                                more than 700 million tons per year and a harvested area reaching 165 million
                                ha [5]. In 2050 world’s population growth will be 10 billion and the demand for
                                rice will grow faster than other crops [6]. There are already many challenges to at-
                                taining higher productivity of rice. Climate change e.g., high temperature and its

DOI: 10.4236/ajps.2021.125054                        783                           American Journal of Plant Sciences
S. S. Islam, A. K. Hasan
consequences are the major challenges which affect the production of rice crop.
Upland rice suffers severely from irregular environmental factors, e.g., air
temperature, drought, and precipitation [7]. Temperature is attributed by its
impact on crop yield, due to expansion under excess heat stress conditions that
greatly influences the growth duration and yield of the rice plant [8]. The tem-
perature rise is one of issues of climate change that has the effect of rice produc-
tion in Thailand, especially to the development and growing of upland rice
plants reported by [9]. In the growing season the mean temperature, tempera-
ture sum, ranges, distribution pattern and diurnal changes or a combination of
these, highly correlated with grain yields had a significant issue [10]. Due to
global warming and climatic risk, the current rice productions in Thailand are in
danger. To fulfil the increase rice demand of ever-growing population pressures,
an estimation of likely impact is vital for planning strategies.
For estimating cultivar coefficients, numerous methods have been recognized.
However, these methods need key knowledge regarding a specific crop cultivar
such as planting dates, flowering dates, physiological maturity dates and final
grain yield, which in most cases are not available. Genetic coefficient calculator
(GENECALC) which is a sub module in the Decision Support System for Agro-
technology Transfer (DSSAT v4.7) was used to determine cultivar coefficients for
new peanut lines in Thailand from standard varietal trials reported by [11]. Some
researchers used generalized possibility uncertainty estimation (GLUE) method to
estimate maize cultivar coefficients [12]. Hence, DSSAT v4.7 has GLUE module
for estimating crop cultivar coefficients [13]. All the above-mentioned approaches
to estimate crop cultivar coefficients for use in dynamic crop models need some
degree of information on a particular cultivar. Therefore, in situations where
there is scarcity of data from typical variety trials or other devoted experiments,
repeated field experimentations would be the only option. For dynamic crop si-
mulation model accurate estimation of crop cultivar coefficients is the main
point into use (for research as well as decision making) for improvement, identi-
fication and consequently narrowing gaps in our knowledge over crops and bi-
ophysical aspects for improved agricultural productivity. Therefore, objectives of
current study are: 1) to determine upland rice crop growth and development in-
dices under optimum temperature conditions; 2) to estimate upland rice cultivar
parameters and calibrate DSSAT-CERES-Rice model using the same manage-
ment; 3) to evaluate DSSAT-CERES-Rice model for simulating growth and yield
under the rainfed upland conditions.
2. Material and Methods
2.1. Field Experiment for Model Calibration
For model calibration, five popular upland rice genotypes namely, Dawk Pa-yawm,
Mai Tahk, Bow Leb Nahng, Dawk Kha 50 and Dawk Kahm were grown on 8th
July 2018 to calibrate the CSM-CERES-Rice model by using a temperature tole-
rant cultivar (Basmati 385). The experiment was conducted as a split plot using
DOI: 10.4236/ajps.2021.125054 784 American Journal of Plant SciencesS. S. Islam, A. K. Hasan
Complete Block Design (CRD) as main plots with three replications. The main
plots had five upland rice genotypes and sub plots had three different tempera-
ture treatments (28˚C, 30˚C and 32˚C). Temperature treatments were set up by
using the data logger (UA-003-09 HOBO Pendant, for Temp/Light) from start-
ing of the experiment. Each plot had 5 rows, with 10 plants each. Standard
agronomic practices were followed for treatment of fertilizers, weed and insect
control. The crop management data (i.e., phenological data) required for the si-
mulation of the crop model include planting date, (50% and 100%) germination
date, flowering and maturity, tillers number, panicles number, leaf area index,
grain yield, biomass and 1000 grain weight were recorded harvest.
2.2. Description of the DSSAT-CERES-Rice Model
CERES-Rice present in DSSAT v4.7which is an advanced physiologically based
model, was used to calibrate and evaluate the crop simulation model. Genetic
co-efficients for the five upland rice genotypes were used to calibrate CERES-Rice
model. Soil analysis was carried out before started of the experiments to analyze
soil fertility and to carryout proper fertilizer management. Weather parameters
including maximum and minimum temperatures, rainfall with air intensity were
recorded from Kho Hong Agro meteorological station. Daily solar radiation
(MJm−2 day−1) was calculated by using weatherman tools in DSSAT v4.7. Dawk
Kahm genotype was used as border crop to avoid the varietal errors. To run the
model the following five input files were created:
2.2.1. Daily Weather Model
Maximum and minimum air temperatures, precipitation, rainfall, and solar rad-
iation (derived from sunshine hour data) were collected from the weather sta-
tion of Kho Hong Agro meteorological office, Hat Yai, Thailand.
2.2.2. Soil Data
Soil data were collected at the depth of soil characteristics at 0 - 20, 20 - 40, 40 -
60, and 60 - 80 cm before planting. Soil classes, organic carbon (%), sand, silt,
clay (%), soil texture, soil pH in water, field capacity (%), organic carbon (%),
cation exchange capacity, total nitrogen, potassium and phosphorus, potential
root distribution and depth were taken (Table 1).
2.2.3. Management Practices
Plant density, planting date, irrigation, weeding, plant row spacing, sowing
depth, amount and types of fertilizers, insecticide application was done whenev-
er necessary.
2.2.4. Plant Profile Data
Sowing date, emergence date, flowering date, physiological maturity date, pa-
nicle initiation (when 50% and 100% of the crop had reached those stages),
planting density, plant height, tops weight (grain weight), harvest index and
grain yield per genotype, i.e., grain yield per area of production.
DOI: 10.4236/ajps.2021.125054 785 American Journal of Plant SciencesS. S. Islam, A. K. Hasan
Table 1. Soil Physical, chemical and morphological analysis for model calibration.
Measured Layers (cm)
Parameters
units 0 - 20 20 - 40 40 - 60 60 - 80 Average
Soil textural Sandy clay Sandy clay Sandy clay Sandy clay Sandy clay
classes loam loam loam loam loam
Sand % 47.00 60.98 61.92 67.50 61.52
Silt % 9.00 11.47 11.68 9.00 12.46
clay % 24.10 25.50 26.60 26.00 27.08
Total N % 0.06 0.06 0.06 0.06 0.05
Organic matter % 1.40 1.30 1.33 1.23 1.34
Organic carbon % 1.45 0.90 0.83 0.73 0.81
Available P mgkg −1
147.49 131.35 141.32 120.23 140.05
Field capacity % 15.90 15.70 15.50 13.40 15.70
Available K mgkg−1 140.00 115.50 70.00 87.00 108.50
Available Ca mgkg −1
131.95 121.82 130.50 109.00 154.89
Available Fe mgkg −1
119.34 127.92 104.34 99.80 137.20
CEC Meq100g 11.14 13.12 12.27 12.00 3.08
Ec mgkg−1 100.00 95.10 95.30 87.00 100.13
pH mgkg−1 5.05 5.24 5.02 5.00 5.20
2.2.5. Genetic Coefficients File
Table 2 showed the genetic coefficients that were determined in the CERES-Rice
model with the parameters namely P1 (Time period or basic vegetative phase),
P2O (Critical photoperiod), P2R (Photoperiodism coefficients), P5 (Grain filling
duration coefficient), G1 (Spikelet number coefficient), G2 (Single grain weight),
G3 (Tillering coefficients) and G4 (Temperature tolerance coefficient). The ge-
netic coefficients or cultivar coefficient values as obtained through GLUE runs
were replaced by calculated values against tested genotypes and saved it in
RICER047.CUL file in DSSAT model. Model calibration was done several times
for P2O, P2R, G3 and G4 and subsequently suitable values for the coefficients
were selected.
2.3. Experiments for Model Evaluation
For model evaluation, selected five upland rice genotypes namely Dawk Pa-yawm,
Mai Tahk, Bow Leb Nahng, Dawk Kha 50 and Dawk Kahm and three tempera-
ture treatments were laid out in a Completely Randomized Design (CRD) under
split plot design structure with three replications in the 2017/2018 and
2018/2019 growing seasons at the research area of Plant Science Department,
faculty of Natural Resources, Prince of Songkla University Hat Yai campus,
Thailand. Soil samples were collected fifteen days before sowing for important
chemical and physical characterization (Table 3). We must do two seasons re-
search experimental work for model evaluation. Here planting was done on 24th
DOI: 10.4236/ajps.2021.125054 786 American Journal of Plant SciencesS. S. Islam, A. K. Hasan
Table 2. Genetic cultivar coefficients for the DSSAT-CERES-Rice model.
Stage Description
Time period or basic vegetative phase of the plant (expressed as growing
P1 (Juvenile Phase) degree days [GDD] in ˚C from seedling emergence during which the rice
plant is not responsive to changes in photoperiod.
P2O (Critical Critical photoperiod or the longest day length (in hours) at which the
Photoperiod) development occurs at a maximum rate.
P2R (Photoperiodism Extent to which phasic development leading to panicle initiation is delayed
Coefficients) (expressed as GDD) for each hour increase in photoperiod above P2O.
P5 (Grain filling Time period in GDD) from beginning of grain filling (3 to 4 days after
duration coefficient) flowering) to physiological maturity with a base temperature of 9˚C.
Potential spikelet number coefficient as estimated from the number of
G1 (Spikelet number
spikelets per gm of main culm dry weight (less lead blades and sheaths plus
coefficient)
spikes) at anthesis.
G2 (Single grain Under ideal growing conditions, i.e., non limiting light, water, nutrients,
weight) and absence of pests and diseases.
A higher tillering cultivar would have coefficient greater than 1.0 G4
G3 (Tillering
(Temperature tolerance coefficient) = Usually 1.0 for genotypes grown in
coefficient)
normal environments.
Usually, 1.0 for genotypes grown in normal environments. G4 for japonica
G4 (Temperature type rice growing in a warmer environment would be 1.0 or greater.
tolerance coefficient) Likewise, the G4 value for Indica type rice in very cool environments or
season would be less than 1.0.
Table 3. Chemical properties for model evaluation experiments.
Depth Organic carbon % Total N % pH (H2O) P (Bray1) (mg/kg) Exchangeable P (cmol)
0 - 10 1.7 1.3 5.00 98.00 0.09
10 - 25 1.5 0.9 5.02 87.50 0.07
25 - 35 0.9 0.8 5.01 95.50 0.06
July for the 2017/2018 and 2018/2019 seasons. Different fertilizers whenever ne-
cessary. Other management practices were carried out accordingly. The number
of days to anthesis and physiological maturity, and grain filling data were col-
lected. Moreover, grain yield and total plant biomass was measured at physio-
logical maturity.
2.4. Statistical Analysis
The analysis of variance (ANOVA) to evaluate cultivars growth and develop-
ment and the effect of different temperatures was done. Mean separation was
done by Least Square Difference (LSD) for split plot design to see the varietal
differences. Test of significance between the 2017/2018 and 2018/2019 experi-
ments and simulated and measured quantities was performed by R/agricolae
program [14]. This research focused to simulate the effect of different tempera-
tures on yield performed for phenology, grain yield, tops weight, leaf area index,
harvest index, and tillers number.
DOI: 10.4236/ajps.2021.125054 787 American Journal of Plant SciencesS. S. Islam, A. K. Hasan
2.5. Model Calibration
Calibration is the process of adjusting some model parameters to local environ-
mental conditions and obtains genetic coefficients for new cultivar used in mod-
eling study [15]. According to [16] model calibration was done by the Root
Mean Square Error (RMSE).
∑ i =1 ( Si − Oi )
n 2
RMSE = (1)
n
2.6. Model Evaluation
Model performance was evaluated by comparing the simulated versus observed
values from upland rice experiment under rainfed conditions where an agree-
ment index or d stat index [16] was used. The RMSEn gives the level of error as-
sociated with each evaluation between the observed and simulated values.
∑ i =1 ( Si − Oi )
n 2
d = 1− (2)
∑ i =1 ( Si′ + Oi′ )
n 2
= ( RMSE × 100 )
RMSEn O (3)
where Si = simulated value, Oi = observed value, n = number of observations, O
= overall mean of observed values, S=i
′ Si − O and O= i
′ Oi − O .
3. Results and Discussion
3.1. Weather Conditions
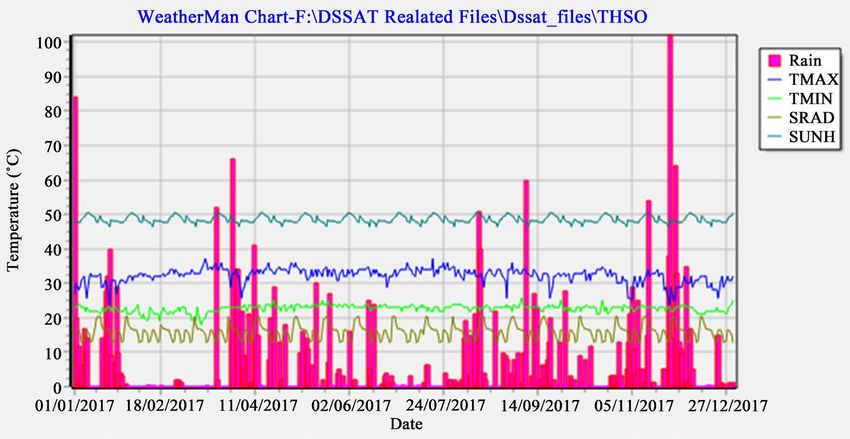
From Figure 1 and Figure 2 it was showed that in both 2017 and 2018 years,
weather conditions had no visible variations. The maximum and minimum
Figure 1. Mean daily maximum, minimum temperature, rainfall, solar radiation, sunshine determined in 2017/2018
year.
DOI: 10.4236/ajps.2021.125054 788 American Journal of Plant SciencesS. S. Islam, A. K. Hasan
Figure 2. Mean daily maximum, minimum temperature, rainfall, solar radiation, sunshine determined in
2018/2019 year.
temperatures ranged between 25˚C to 38˚C and 18˚C to 22˚C. Highest maxi-
mum temperature (35˚C) and highest minimum temperature (26˚C) shown at
ambient temperature 28˚C and 32˚C for 2018 Solar radiation ranged from 10.2
to 20 MJ∙m−2∙d−1, rainfall was reported between 20 - 980 mm and the highest
rainfall was shown in the month of November to mid-December. After that
January month was second most rainfall month near about 850 mm rainfall, re-
spectively. Extreme high temperature beyond the average temperature hampered
during experiment might have negative influence on upland rice yield, crop
growth and development.
3.2. Soil Condition
Different soil layers of the study site with surroundings contain sandy clay loam
texture and were highly acidic. Special management e.g., irrigation due to higher
clay contents and drainage system should be adopted for heavy rainfall. As the
soil was acidic, phosphorus fixation was required to improve soil pH, phospho-
rus fertilizers were added.
3.3. Analysis of Variance Result of Yield and Yield Attributes
Although ANOVA results (Table 4) for yield contributing traits using least sig-
nificant differences (LSD) test (P < 0.05 and P < 0.01) revealed that some traits
showed highly significant differences with temperatures and genotypes. Grain
yield, tops weight, harvest index, flowering date, and maturity date was signifi-
cantly affected by temperatures. Non-significant difference for tillers number,
and leaf area index occurred possibly due to the optimum input of temperatures
at the early stage. Whereas all the phenological traits had shown highly significant
DOI: 10.4236/ajps.2021.125054 789 American Journal of Plant SciencesS. S. Islam, A. K. Hasan
Table 4. Mean squares from analysis of variance for 5 upland rice genotypes.
Mean Squares
Source df
TN TW LAI HI GY FD MD
Replication 2 3.82 6,897,576 0.00054 0.00037 1,123,827 287.20 37.70
Temperature (T) 2 8.96 7,714,899** 0.0017 0.00050** 21,101,974** 1488.40** 4.29**
Error (a) 4 3.46 1,909,466** 0.0003 0.00034 895,471** 248.000** 19.00**
Genotypes (G) 4 26360** 1,412,628** 0.0310** 0.17674** 8,577,099** 2.00** 9.48**
T× G 8 2.20 275,655** 0.0017 0.00008 210,410** 5.01** 1.844**
Error (b) 24 5.99 123,482 0.0019 0.00012 61,252 0.82 1.94
CV% (a) 3.41 16.67 1.04 3.06 16.51 17.28 3.87
CV% (b) 4.49 4.06 1.71 1.80 4.32 0.99 1.27
Table 5. F values for selected variables between upland rice cultivars for 2017/2018 and
2018/2019 seasons.
Variables 2018 2019
Harvest index at 50% flowering 0.97 ns
1.22ns
Grain yield at harvest 2.568** 1.67**
Tops weight at physiological maturity 4.67** 2.22**
variation among different genotypes. Grain yield, flowering date and maturity
date had interaction effects between temperature and genotype.
3.4. Harvest Index, Grain Yield and Tops Weight
Table 5 showed that both grain yield at harvesting period and tops weight at
physiological maturity varied significantly (P < 0.05) during 2017/2018 and
2018/2019 seasons, except harvest index at 50% flowering did not fluctuate. So,
there was significant variation among genotypes in the 2018 and 2019 seasons.
Also, there was inter seasonal variation in the tested variables for tops weight
and grain yield. The similarity in the parameters for the 2018 and 2019 growing
seasons suggested that at the growing condition period rainfed condition, nu-
trients, fertilizers, and other managements were affected the yield contributing
traits. Though, sowing date for both seasons was the same 24th July, and weather
elements were comparatively similar in both years, finally the similarity could
not be expected.
3.5. CERES-Rice Model Calibration
Experiment for estimation cultivar coefficient was used for model calibration.
Data of observed and simulated days to anthesis, physiological maturity, grain
yield, by product and tops weight were collected for all the genotypes (Table
6(a) and Table 6(b)) indicating that cultivar specific parameters within the
model were reasonably adjusted. Similarly, there was a good relationship among
observed and simulated variables (d state values were respectively 0.97, 0.98, 1.0,
DOI: 10.4236/ajps.2021.125054 790 American Journal of Plant SciencesS. S. Islam, A. K. Hasan
Table 6. (a) Simulated and observed values of days to anthesis, days to maturity and grain
yield for upland rice genotypes. (b) Simulated and observed values of by product yield
and tops weight for upland rice genotypes.
(a)
By product (kg∙ha−1) Tops weight (kg∙ha−1)
Cultivar
Obs. Sim. RMSE Obs. Sim. RMSE
Dawk Pa-yawm 7208 7440 190 6890 6980 102
Mai Tahk 8050 8080 98 8879 8996 165
Bow Leb Nahng 8515 8720 87 7760 7890 89
Dawk Kha 50 7350 7860 97 8850 8960 104
Dawk Kahm 7660 7860 95 7590 7780 93
(b)
Days to anthesis Days to maturity Grain yield
Genotype
Obs. Sim. RMSE Obs. Sim. RMSE Obs. Sim. RMSE
Dawk Pa-yawm 65 66 7.5 110 112 8.5 6476 6525 89
Mai Tahk 63 64 5.7 108 109 6.5 7230 7340 218
Bow Leb Nahng 60 60 3.5 113 114 3.4 5990 6020 78
Dawk Kha 50 68 69 4.8 100 100 7.2 6200 6340 135
Dawk Kahm 59 59 7.0 104 104 6.8 6860 6998 115
1.0 and 0.99 for all the yield attributes. Dawk Pa-yawm showed high RMSE with
respect to both number of anthesis days and physiological maturity than other
genotypes. Mai Tahk had higher RMSE with respect to grain yield and tops
weight also indicated that was high yielding genotypes and the yield is associated
with the growth duration since it took longer than others to attain anthesis and
physiological maturity. Besides, Bow Leb Nahng had lower RMSE with anthesis
days, maturity days, grain yield, by product and tops weight indicated lower
yielding genotype.
3.6. Cultivar Specific Parameters
Table 7 showed that Dawk Kahm genotype required few thermal units to com-
plete juvenile stage (P1) compared to Mai Tahk genotype. This allowed Mai
Tahk required extra time to accumulate photosynthesis before flowering and
hence higher yielding genotype compared to other cultivars. Dawk Kahm was
formerly bred for temperature tolerance condition indicated that few tempera-
ture units of short duration were just required to attain end of juvenile stage.
Dawk Kha 50 required few temperature units from anthesis to physiological
maturity (P5), contrasting Mai Tahk with highest thermal time requirement
(G4). Spikelet number coefficient (G1) and single grain weight (G2) also high in
Mai Tahk cultivar and lower in Dawk kahm cultivar. This resembled to differ-
ences in grain size between the two cultivars. The rate of grain development was
DOI: 10.4236/ajps.2021.125054 791 American Journal of Plant SciencesS. S. Islam, A. K. Hasan
high in Mai Tahk compared to others since this could be a temperature tolerant
cultivar for rainfed environment with upland condition. Temperature tolerant
coefficient (G5) was for the cultivars varied from 0.78˚C-1.09˚C for Dawk kahm
to Mai Tahk genotypes.
3.7. Model Evaluation
The cultivar specific parameters found from experiments were used to evaluate
CSM-CERES-Rice for simulating different temperature treatments under rainfed
upland condition. The model simulated well the average number of anthesis to
maturity days with high degree of agreement as indicated by the agreement in-
dex (d-statistics) (Table 8). This is an indication that the model calibration and
resulting cultivar specific parameters were reasonably estimated. Generally, there
were significant different (p < 0.05) between observed and simulated data at all
temperature treatments and in all variables. Especially simulated yield decreased
as temperature increased in both model simulation and experimental observa-
tions. This suggests that the CERES-Rice model is sensitive to climatic variables
such as temperature. Furthermore t-test showed significant difference (P <
0.05) between simulated and observed yields at all temperature treatments
(Table 9).
For model evaluation, a comparison was made for the five upland rice geno-
types between simulated and observed grain yield at 28˚C, 30˚C and 32˚C tem-
perature treatments (Table 7). In this study all the genotypes had shown a close
agreement between observed and simulated values of grain yield data. Results
showed that Mai Tahk and Bow Leb Nahng were the best cultivars due to
Table 7. Cultivar coefficients for the five upland rice genotypes.
Genetic coefficient values
Genotypes
P1 P2O P2R P5 G1 G2 G3 G4
Dawk Pa-yawm 120.0 10.8 250.0 672.0 82.1 0.018 0.68 0.98
Mai Tahk 130.0 10.8 250.0 735.0 82.9 0.027 0.89 1.09
Bow Leb Nahng 119.0 10.8 250.0 560.0 78.8 0.024 0.78 0.90
Dawk Kha-50 118.0 10.8 250.0 500.0 80.8 0.020 0.82 0.95
Dawk Kahm 115.0 10.8 250.0 450.0 68.3 0.019 0.65 0.78
Table 8. Observed and simulated values of yield attributes as affected by three tempera-
ture treatments under rainfed conditions.
Variable Name Mean obs. Mean Sim. r-Square RMSE d-Stat.
Anthesis day 58 58 0.98 0.92 0.98
By product(kg/ha) 6850 7000 0.97 297 0.07
Tops weight (kg/ha) 5960 6150 0.99 300 0.99
Grain yield (Kg/ha) 5470 5680 0.99 310 0.99
Maturity day 97 99 0.87 1 0.98
DOI: 10.4236/ajps.2021.125054 792 American Journal of Plant SciencesS. S. Islam, A. K. Hasan
Table 9. Observed vs. simulated grain yields at different temperature treatments.
28˚C 30˚C 32˚C
Genotypes
Observed Simulated Observed Simulated Observed Simulated
Dawk Pa-yawm 3583 3734 3920 4350 3239 3497
Mai Tahk 4480 4860 5200 5500 3300 3880
Bow Leb Nahng 4200 4367 4920 5000 3600 3694
Dawk Kha-50 3308 3650 3829 4220 2835 3055
Dawk Kahm 3947 4230 4100 4331 3021 3230
increasing simulated grain yield and best performed with the moderate tem-
perature at 30˚C (Mai Tahk 5500 kg∙ha−1 and Bow Leb Nahng 5000 kg∙ha−1).
Whereas at 32˚C temperature treatment, a large variation for all the genotypes
decreased in yield with the maximum temperature increased. Highest reduction
in simulated yield was recorded for Dawk Kha 50 cultivar (3650 kg∙ha−1 at 28˚C,
4220 kg∙ha−1 at 30˚C and 3055 kg∙ha−1 at 32˚C) compared to others while mini-
mum temperature increased at high temperature (30˚C) stage.
4. Conclusion
Unavailability of experimental data related upland rice genotypes have ham-
pered DSSAT-CSM use in many areas and research such as biophysical resource
application, economical, cost effective tactical or strategic decision-making
processes. Here, simulation experiments done using these cultivar parameters
predicted reasonably well the crop growth and yield under varying temperature
treatments. It showed that highest simulated grain yield bearing genotype was
Mai Tahk 5500 kg/ha with 30˚C and the simulated yield of upland rice ranges
(3055 - 5500) kg/ha with temperature ranging 28˚C - 32˚C. The CSM-CERES-Rice
model was well validated and showed reliability of simulations with different
temperatures for phenology and yield attributes of upland rice genotypes. Our
study assessed the DSSAT–CERES–Rice model in a CRD experiment including
two factors; one of genotype (5 Thai upland rice genotypes) and another one of
different temperature treatments (3 levels) to identify the variations of grain
yield in southern Thailand under changing climatic (weather, soil) conditions.
Study results revealed that increase in temperature, solely lead to decrease in
grain yield of upland rice. Thus, CERES-Rice model could be safely used as a
tool to assess different agronomic and climatic change parameters.
Acknowledgments
The authors gratefully acknowledged the financial support from the budget
(NAT610046S) of Prince of Songkla University Higher Education Research
promotion and Thailand’s Education Hub for ASEAN countries (TEH-AC)
project office of the Higher Education Commission. It was partially supported
by the Graduate School, and thankful the Field Laboratory Centre of Plant
DOI: 10.4236/ajps.2021.125054 793 American Journal of Plant SciencesS. S. Islam, A. K. Hasan
Science Department, Faculty of Natural Resources, Prince of Songkla University,
Hat Yai campus, Thailand, for kindly providing the upland rice seeds.
Conflicts of Interest
The authors declare no conflicts of interest regarding the publication of this pa-
per.
References
[1] Mourice, S.K., Rweyemamu, C.L., Tumbo, S.D. and Amuri, N. (2014) Maize Culti-
var Specific Parameters for Decision Support System for Agrotechnology Transfer
(DSSAT) Application in Tanzania. American Journal of Plant Sciences, 5, 821-833.
http://doi.org/10.4236/ajps.2014.56096
[2] Dias, M.P.N.M., Navaratnea, C.M., Weerasinghea, K.D.N. and Hettiarachchib,
R.H.A.N. (2016) Application of DSSAT Crop Simulation Model to Identify the
Changes of Rice Growth and Yield in Nilwala River Basin for Mid-Centuries under
Changing Climatic Conditions. Procedia Food Science, 6, 159-163.
https://doi.org/10.1016/j.profoo.2016.02.039
[3] Kant, K., Telkar, S.G., Gogoi, M. and Kumar, D. (2017) Crop Simulation Models.
Biomolecule Reports, 1-5.
[4] Jat, S.R., Gulati, I.J., Soni, M.L., Kumawat, A., Yadava, N.D., Nangia, V., Glazirina,
M. and Rathor, V.S. (2017) Water Productivity and Yield Analysis of Groundnut
Using Crop Syst Simulation Model in Hyper Arid Partially Irrigated Zone of Ra-
jasthan. Legume Research, 40, 1-6.
[5] (2015) World Wheat, Maize (Corn), Rice, and Cotton. Oklahoma State University,
Stillwater.
http://www.nue.okstate.edu/Crop_Information/World-Wheat-Production.htm
[6] Nayak, A.K., Shahid, M., Nayak. A.D., Dhal, B., Moharana, K.C., Mondal, B., Tri-
pathi, R., Mohapatra, S.D., Bhattacharyya, P., Jambhulkar, N.N., Shukla, A.K., Fit-
ton, N., Smith, P. and Pathak, H. (2019) Assessment of Ecosystem Services of Rice
Farms in Eastern India. Ecological Processes, 8, Article No, 35.
https://doi.org/10.1186/s13717-019-0189-1
[7] Jalota, S.K. (2010) Integrated Effect of Transplanting Date, Cultivar and Irrigation
on Yield, Water Saving and Water Productivity of Rice (Oryza sativa L.) in Indian
Punjab: Field and Simulation Study. Agricultural Water Management, 96,
1096-1104. https://doi.org/10.1016/j.agwat.2009.02.005
[8] Fahad, S., Bajwa, A.A., Nazir, U., Shakeel, A.A., Farooq, A., Zohaib, A., Sadia, S.,
Wajid, N., Chao, W., Wang, D. and Huang, J. (2017) Crop Production under
Drought and Heat Stress: Plant Responses and Management Options. Frontiers of
Plant Sciences, 8, Article No. 1147. https://doi.org/10.3389/fpls.2017.01147
[9] Yuliawana, T. and Handokob, I. (2016) The Effect of Temperature Rise to Rice
Crop Yield in Indonesia Uses Shierary Rice Model with Geographical Information
System (GIS) Feature. Procedia Environmental Sciences, 33, 214-220.
https://doi.org/10.1016/j.proenv.2016.03.072
[10] Araus, J.L. and Slafer, G.A. (2011) Crop Stress Management and Global Climate
Change. CABI, Cambridge. https://doi.org/10.1079/9781845936808.0000
[11] Anothai, J., Patanothai, A., Jogloy, S., Pannangpetch, K., Boote, K. J. and Hoogen-
boom, G. (2008) A Sequential Approach for Determining the Cultivar Coefficients
of Peanut Lines Using End-of-Season Data of Crop Performance Trials. Field Crops
DOI: 10.4236/ajps.2021.125054 794 American Journal of Plant SciencesS. S. Islam, A. K. Hasan
Research, 108, 169-178. https://doi.org/10.1016/j.fcr.2008.04.012
[12] Jones, J.W., Hoogenboom, G., Porter, C.H., Boote, K. J., Batchelor, W. D., Hunt, L.
A., Wilkens, P.W., Singh, U., Gijsman, A.J. and Ritchie, J.T. (2010) The DSSAT
Cropping System Model. European Journal of Agronomy, 18, 235-265.
https://doi.org/10.1016/S1161-0301(02)00107-7
[13] Hoogenboom, G., Jones, J.W., Traore, P.C.S. and Boote, K.J. (2012) Experiments
and Data for Model Evaluation and Application. In: Kihara, J., Fatondji, D., Jones,
J.W., Hoogenboom, G., Tabo, R. and Bationo, A., Eds., Improving Soil Fertility
Recommendations in Africa Using the Decision Support System for Agrotechnol-
ogy Transfer (DSSAT), Springer Science+Business Media, Dordrecht, 9-18.
https://doi.org/10.1007/978-94-007-2960-5_2
[14] Mendiburu, F.D. and Simon, R. (2007) Agricolae—A Free Statistical Library for Ag-
ricultural Research. Iowa State University, Ames.
[15] Akinbile, C.O. (2013) Assessment of the CERES-Rice Model for Rice Production in
Ibadan, Nigeria. Agricultural Engineering International: CIGR Journal, 15, 19-26.
[16] Kiniry, J., Williams, R., Vanderlip, J., Atwood, D., Muuliken, W., Cox, H. and Wei-
bold, W. (1997) Evaluation of Two Maize Models for Nine U.S. Locations. Agron-
omy Journal, 89, 421-426.
https://doi.org/10.2134/agronj1997.00021962008900030009x
DOI: 10.4236/ajps.2021.125054 795 American Journal of Plant SciencesYou can also read