Modeling of Psychomotor Reactions of a Person Based on Modification of the Tapping Test
←
→
Page content transcription
If your browser does not render page correctly, please read the page content below
Date of publication JUN-28, 2021, date of current version APR-20, 2021.
www.computingonline.net / computing@computingonline.net
Print ISSN 1727-6209
Online ISSN 2312-5381
DOI 10.47839/ijc.20.2.2166

 Modeling of Psychomotor Reactions of a
 Person Based on Modification of the
 Tapping Test
 LESIA MOCHURAD, YAROSLAV HLADUN
 Lviv Polytechnic National University, Lviv, 79013, Ukraine (E-mail: Lesia.I.Mochurad@lpnu.ua, gladi41414@gmail.com)

 Corresponding author: Lesia Mochurad (e-mail: Lesia.I.Mochurad@lpnu.ua).
The work is supported by the research project of the National University “Lviv Polytechnic” of the Department of Artificial
Intelligence Systems “Information technology for the formation of psychophysical portrait in stressful situations” (SB/stress resistance
state registration number 0120U102194, 2020-2022) and the scientific direction “Analysis of big data” of the same department.

 ABSTRACT The paper considers the method for analysis of a psychophysical state of a person on
psychomotor indicators – finger tapping test. The app for mobile phone that generalizes the classic tapping test is
developed for experiments. Developed tool allows collecting samples and analyzing them like individual
experiments and like dataset as a whole. The data based on statistical methods and optimization of
hyperparameters is investigated for anomalies, and an algorithm for reducing their number is developed. The
machine learning model is used to predict different features of the dataset. These experiments demonstrate the
data structure obtained using finger tapping test. As a result, we gained knowledge of how to conduct
experiments for better generalization of the model in future. A method for removing anomalies is developed and
it can be used in further research to increase an accuracy of the model. Developed model is a multilayer recurrent
neural network that works well with the classification of time series. Error of model learning on a synthetic
dataset is 1.5% and on a real data from similar distribution is 5%.

 KEYWORDS tapping test; mathematical modeling; psychomotor reactions; time series; recurrent neural
network.

I. INTRODUCTION medical diagnostic decision support system including

D ETERMINING the basic properties of the nervous
 system is directly related to both theoretical and
applied research [1-2]. The finger-tapping test (FTT) has
 parametric methods, non-parametric methods and several
 neural network models [12, 13].
 In medicine, modeling the human psychophysical state
been used for almost a century to evaluate muscle control can help to better understand the nature of some mental
and motor ability in the upper extremities [3]. FTT is illness. This helps in determining a more accurate diagnosis
frequently used to quantitatively evaluate patients with of the patient. Also, after difficult operations, it is possible
Parkinson’s disease [4], ataxia [5], Alzheimer’s disease [6], to monitor the change in the psychophysical state of a
and Korsakoff syndrome [7], as well as in individuals who person that allows preventing the occurrence of stress,
have suffered an acute stroke [8]. Also, FTT is widely used which will adversely affect the state of health. APSP helps
to evaluate motor function in the upper limbs [9-11]. At the in selecting candidates for the position who need a stable
moment, with this type of testing, the results are checked by nervous system. In other words, having some tools of APSP
experienced doctors and conclusions are made about the in the form of a set of mathematical models can improve
psychophysical state of the person. But with the rapid the quality of selection of individuals by the level of
development of machine learning (ML) algorithms, they stability of the nervous system.
rapidly began to be used in medicine. There are a number There are rapid methods for determining the stability of
of different quantitative models that can be used in a the nervous system and the balance of nervous processes on

190 VOLUME 20(2), 2021
Lesia Mochurad et al. / International Journal of Computing, 20(2) 2021, 190-200

psychomotor parameters, which were developed by Subsection 3.1 is about an app that we used for conducting
E.P. Ilyn. One of the most well-known methods of a test. Subsection 3.2 is about data preparation and
determining the stability of the nervous system is the Subsection 3.3 describes the modeling. Section 4 is a result
tapping test. Based on it, five types of dynamics of the of experiments and model training. Section 5 reveals a
maximum pace of work can be distinguished: convex type discussion about different methods of data collecting.
(indicates the presence of a strong nervous system); straight Section 6 concludes the paper and determines the prospects
type (nervous system of medium strength); intermediate for further research.
and concave types (middle or weak nervous system);
degressive type (weak nervous system) [14]. This division II. LITERATURE ANALYSIS
is designed for testing using simple tools like a pen and a A fairly accurate way to analyze data from different areas
sheet of paper. The process of passing the classic tapping of medicine is the use of machine learning models [15]. In
test is quick and simple, but it has a negative side: most of particular, computer vision has become widely
the useful information is lost. popular [16]. Often, if the dimension of the input data is the
 The object of the research is the psychomotor learning same, it is possible to do with conventional models, for
(the relationship between cognitive functions and physical example, as regression or support vector machine [17]. But
movement). The subject of the research – the relationship recurrent neural networks have a great potential in
between psychomotor indicators obtained as a result of FTT medicine [17, 25]. This is a class of neural networks in
and other psychological indicators. The purpose of this which connections between nodes make a time-oriented
work is to develop a model for the classification of the graph. Due to this, they work well with sequences of
psychophysical state of a person (based on the FTT) in the different dimensions. If we used classical models of
form of a set of layers of different neural network (NN) machine learning (Support Vector Machine, Random
architectures with certain hyperparameters, develop a Forest, etc.), then we would need to describe the time series
software product for conducting FTT as an application and by some numerical characteristics. In this modeling, is first
develop a method for reducing anomalies that will be used needed to consider n (number of clicks). It is also needed to
before NN. describe the time series with the following numerical
 The model in the context of this work is a set of characteristics: average value, median, modus, standard
mathematical equations and algorithms that generally form deviation, minimum, maximum, etc.
an architecture, in which, by inputting data of a certain On the other hand, the use of appropriate models for the
structure (in our case it is a vector that describes the time problems of classification, clustering, regression [19-21]
series), we obtain other data that can also be categorical. requires a fairly large amount of data [15]. This amount of
This model must be flexible enough (it must contain a data is difficult to obtain because experiments usually
number of hyperparameters) so that it can be used for require special equipment. With the development of
different samples. This architecture consists of two parts technology, some methods can be simplified and easily
and will be considered in this paper as a description of its used on conventional devices like personal computer or
high-level components. mobile phone. One such method is – FTT [22]. Of course,
 The experiments demonstrate the structure of the data they give a fairly large error [23], but due to the fact that
obtained using the tapping test. As a result of the study, we they are mobile, it is possible to collect a lot of data, which
gained knowledge of how to conduct experiments so that makes it possible to use machine learning models for
the model is better generalized in the future. A method for various problems [24].
eliminating some anomalies is developed, which can be
used in further research to increase the accuracy of the III. MATERIAL AND METHODS
model. The method has two hyperparameters that are
selected when model training. A model is developed – a A. FORMULATION OF THE PROBLEM
multilayer neural network that works well with the A person clicks the index finger of the right hand on some
classification of time series. This is an important aspect of location of the device as many times as possible over a
the analysis of the psychophysical state of a person. period of time (one minute). Since the device records the
 The range of applied tasks is very wide. The model can time of each press, the result can be represented as a vector
be used, first of all, in the process of candidate selection for like this:
a position that requires a stable nervous system, for
example, in selecting a candidate head of some Х = ( t2 ,..., tn ) , (1)
governmental institution. Also considered mathematical
modeling can be used in medicine, for example, to where i-th element ti – time (in seconds), when the user
determine how a particular method of treatment affects the
 clicks on the device for the i-th time. More important is the
psychophysical state of a person.
 length of time between clicks. Number of clicks will always
 The remainder of this paper is organized as follows: the
 be one more than number of time intervals between those
analysis of modern literature is presented in Section 2.
 clicks. This is the reason that (1) does not have t1 in order
Materials and methods are presented in Section 3.

VOLUME 20(2), 2021 191
Lesia Mochurad et al. / International Journal of Computing, 20(2) 2021, 190-200

for the dimension X to be equivalent to the dimension Y. clicks the index finger of his right hand on a special place
The latter is defined as follows: of the device. We chose a smartphone as a device.
 Fig. 1 presents the main page of the application, which
 Y = ( t2 − t1, t3 − t2 ,..., tn − tn−1 ) . (2) was developed by us for the experiment. The application
 contains one button, clicking on which testing begins. The
 The content of this vector is as follows: i-th element – view of the main page of the application after pressing the
time between i+1-th and i-th clicks. The same dimension button is shown in Fig. 2. Then the timer is started for 60
(1) and (2) are required to visualize time series. Elimination seconds and the time of each subsequent press and their
of anomalies is important in further analysis, which uses total number is recorded. It is also important that the person
models that are sensitive to anomalies. taking the test follows certain rules: the palm should lie on
 It is necessary to consider models that work with the table, and the index finger, which should press on the
different dimensions of input data, because for each device under it, should be straightened. It is also important
experiment the number of presses n on the device will be to have as few people as possible in the room. It is
not the same. As for part of modeling, consider the problem necessary to isolate as much as possible from various
of classification. Suppose there are N classes of various external factors to the person who passes the experiment.
mental illnesses C1, C2, …, CN and testing is performed on
M individuals. In fact, it does not have to be a disease. This
can be, for example, a type of psychophysical state of a
person. Then, after all experiments, we will have a data
Тable 1 with a series and a target value.
Table 1. View data after collecting them for the problem
 of classifying time series

 (X, Y) С1 С2 … СN

 ( X1 , Y1 ) с11 с12 … с1N

 ( X 2 , Y2 ) с21 с22 … с2 N

 … … … … …
 ( X M , YM ) сM 1 сM 2 … сMN
 Figure 1. The main page of the application

Where сij = 1 , i = 1, M ; j = 1, N when person i has Cj
disease. In other cases, сij = 0 . Once we have trained the
model on this data, we can perform an FTT test on a patient
whose diagnosis is unknown and get a vector (X, Y). Submit
this vector like input to the trained model and at the output
get the next vector: Сk = (сk1, сk 2 , ..., сkN ), k = 1, M ;
I k = arg max Сki , i = 1, N , that is, the person who passed
 i
the test most likely belongs to the i-th class according to
Table 1. We can say that the closer the cki to 1, the more
likely the patient has Ci disease. Ck can be classified as a
categorical distribution. The vector Ck shows that according
to some data the probability of belonging to a series of one Figure 2. The main page of the application is
class is greater than the probability of belonging to another activated
class.
 C. DATA PREPARATION
B. FTT Since the model to be used is quite sensitive to anomalies
FTT is one of the most common tests for a person’s and due to the large number of these anomalies can be
psychophysical condition, which is quite mobile and does poorly generalized. It is necessary to develop a method to
not require specialized equipment. For our series of reduce the number of these anomalies. Obviously, in this
experiments, a program was developed that summarizes the case, the anomalies can be considered too large values yi
classic FTT. Its essence is that a person for 60 seconds that deviate greatly from the standard deviation or are much
 larger than it. To do this, we use the following formula:

192 VOLUME 20(2), 2021

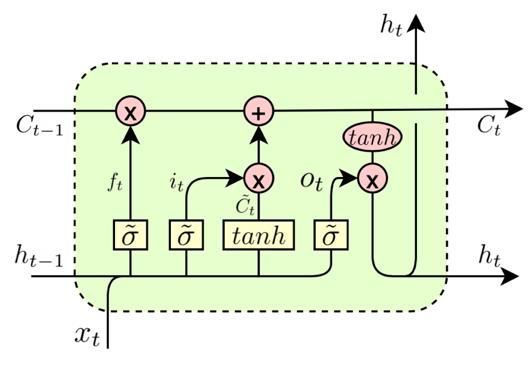
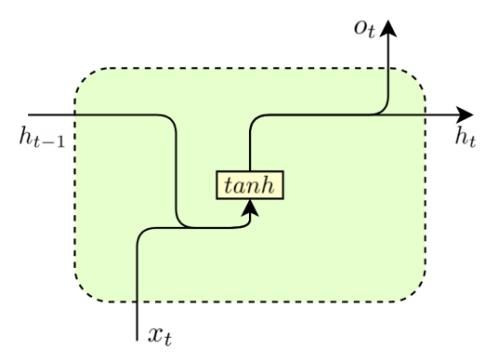
Lesia Mochurad et al. / International Journal of Computing, 20(2) 2021, 190-200 One of the solutions is to use its modification – LSTM with yi := min( yi , aM (Y ) + b (Y )), i = 1, n, (3) which there are no similar problems. LSTM is a type of RNN architecture that works well with long-term dependencies. It was proposed by Sepp Hochreiter and where, the hyperparameters a, b will be determined in the Jürgen Schmidhuber in 1997. The LSTM structure also process of conducting numerical experiments. M(Y) – mean unfolds in time like the classical RNN, but has a slightly value of Y. (Y) – standard deviation of Y. different architecture of layers that interact in a special way. Schematically, the structure of the neuron at time t is shown D. MODELING in Fig. 4. Unlike direct propagation neural networks, in which the signal propagates strictly from the output of one layer to another, RNNs (recurrent neural networks) use their internal memory to process arbitrary sequences of inputs [25], and therefore can be used in solving our problem. The target label can be different: in the case of regression – a number, in the case of classification – a class. This article will consider the problem of classification, because it has more nuances when working with weight optimization, error function, accuracy metrics, etc. The first step is to choose the specific architecture of the recurrent neural network that will be used in the model. There are several, but we will consider two: the classical recurrent neural network and the long short-term memory (LSTM) Figure 4. Schematic representation of the LSTM architecture, which we will use in our research. architecture Fig. 3 shows a fragment of a neural network. The The relationship between neurons in time and the relationship between neurons in time and the method of method of calculating their output is given by the following calculating their output is given by the following relations: relations: ht = ot tanh(Ct ), where ot = (Wo ht −1, xt + bo ), Ct = ft Ct −1 + it Ct , where Ct = tanh(Wc ht −1 , xt + bc ), ft = (W f ht −1 , xt + b f ), Figure 3. Schematic representation of a fragment of a classical recurrent neural network it = (Wi ht −1, xt + bi ), ℎ = tanh( ℎ + ℎ ℎ −1 + ℎ ) where , tanh −activation functions. Square brackets = tanh( ℎ + ), mean that values will be converted to a single vector. We can get acquainted with this architecture in more where ht – vector of the hidden layer of the neural network; detail by following the references [17, 25, 27]. Therefore, LSTM will be used in this model as the first layer of the ot – vector of the output layer; , , – matrix and vector neural network. This is done in order to first use LSTM to of weights; xt – vector of the input layer. reduce the data to a fixed dimension, and only then apply This architecture can use recursive communication to the data to subsequent layers of neurons of another type store previous information. This makes it adapted to the (such as fully connected). input data of different dimensions, which is required for our The LSTM architecture is typically used to predict the task. However, the data presented initially in the last behavior of the time series in subsequent moments of time. iterations have very little effect on the definition of the That is, ht is the prediction of yt. But in our case, it is class. In our case, the number of elements is quite large, necessary to characterize the time series. To do this, we will and for correct prediction is needed to remember a lot of supply the LSTM outputs to a fully connected neural data. Classical RNN may perform poorly in data of this network with a fixed number of neurons. Select the type due to the problem of long-term dependencies [26]. activation function relu. VOLUME 20(2), 2021 193
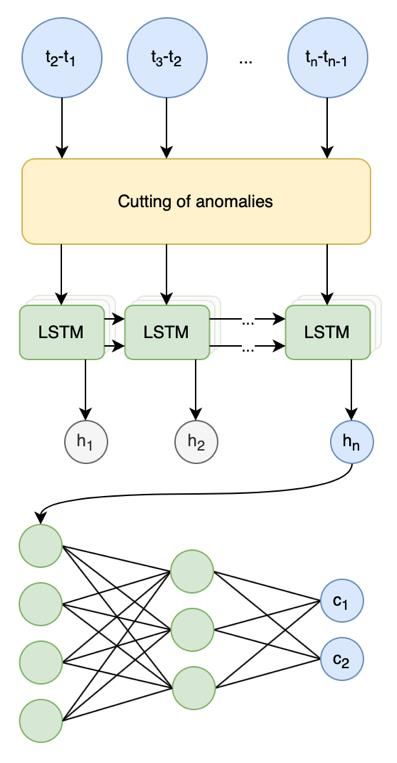
Lesia Mochurad et al. / International Journal of Computing, 20(2) 2021, 190-200 relu( z) = max(0, z), data, we increased the number of neurons. In total, the neural network looks like this: where z – input value of the neuron. 1) LSTM – 128 neurons; We can put several layers of fully connected neural 2) FNN (Feedforward neural network) with relu networks and apply the outputs of the previous one to the 3) activation – 64 neurons; input of the next layer. The last layer, namely the number of 4) FNN with relu activation – 32 neurons; its neurons and the activation function will depend on the 5) FNN with softmax. The output dimension is N, problem: where N is the number of classes. 1. In the classification problem, this layer will have Cross entropy will be used as a function of error: the number of neurons equal to the number of existing classes and the softmax activation function: N L = H ( y, yˆ ) = − ( yi log( yˆi ) + (1 − yi )log(1 − yˆi )). i =1 ( ) = ∑ , = ̅̅̅̅̅ 1, , =1 Here yˆi is the probability of obtaining a class, and yi where K – the dimension of the output of the previous is the real probability. yi will be equal to 1 only in one layer, p – K-dimensional vector with arbitrary component values. Component of vector softmax( p) belongs to the case: when i is a valid class. In other words, this function shows the degree of similarity of the two categorical area [0, 1] and gives a total of one. distributions yi , yˆi and the smaller the value, the more the 2. In the regression problem, the last layer must have a dimension equal to the number of values that we want to output of the model is similar to the actual correspondence predict. The activation function can be both relu and linear, of classes and time series. The complete model for the depending on the numerical range on which the value that analysis with all its components can be represented as it is we predict may exist. In the case of relu, these are only seen in Fig. 5. positive numbers, and linear is the entire numerical axis. We consider the problem of classification. As in our case, without reducing the generality, we will have two classes, then to determine the accuracy of the model we will use the area under receiver operating characteristic (ROC) curve (AUC) – the area bounded by the ROC – curve and the axis of the error rate of positive classifications. The AUC metric was chosen to show the accuracy of the model in more intuitive format. The AUC shows accuracy well on asymmetric datasets [28] (when objects of one class are much more frequent than objects of another class). AUC is used for binary classification, but there is a variation for many classes. Again, it is worth emphasizing why classical algorithms were not used for this, such as Bayes, logistic regression, support vector machine, random forest for classification, etc. The main reason is that these algorithms do not work with data of indefinite dimension, as in our case. Therefore, the only way out is to use models that assume this, which was proposed in the paper. To optimize the weights (for both LSTM and feed forward neural network), a gradient descent was used in the work, namely its modification – Adam [29]. Partial derivatives are calculated using the backpropagation method [30]. So, we have a model that consists of the following submodels: anomaly liquidation and neural network [30]. First, all data is partially cleared using (3), and then fed to the neural network. The number of neurons in each layer was selected by us using cross-validation [31]. If the accuracy on the validation data began to decrease sharply when the accuracy on the training increased, then we decreased the number of neurons in one of the layers. If the Figure 5. Schematic representation of model showed a poor result on both training and validation architecture 194 VOLUME 20(2), 2021
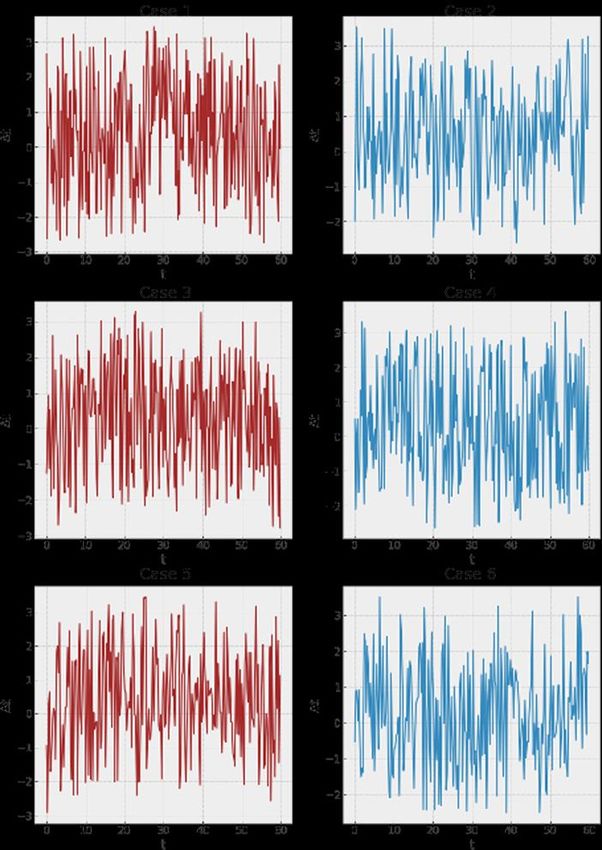
Lesia Mochurad et al. / International Journal of Computing, 20(2) 2021, 190-200

 After the anomalies in the vector Y are cut off, it is fed
to a layer of neurons of the LSTM (long short-term
memory) type. After the series passes through this layer, the
last value is taken (it stores information about the previous
behavior of the time series).
 The resulting vector is fed to the first layer of FNN with
the function of activation relu. The last layer should be the
softmax activation function in order to classify the resulting
vector as a categorical probability distribution. When
learning, the outputs of the last layer will take into account
the calculation of the error L, which is differentiated, which
allows to apply the backpropagation method.

IV. RESULTS Figure 7. 1 – time series of the second
 experiment; 2 – value of the cut anomalies
A. RESULTS OF FTT EXPERIMENTS In Fig. 7 we also see the anomaly, which will be cut
The study involved 30 people with a mean age of 30 years before applying to the input of the model. This case is
and a standard deviation from it – 15 years. Participants similar to the previous one.
were asked to perform the test with the index finger of their
right hand for 60 seconds. Before dealing directly with the
model (its testing), it is worth looking at the visualization of
the time series (X, Y) of some individual experiments to
better understand the structure of the data. In Fig. 6–9 red
lines show the cut boundaries of the anomalies, which are
based on formula (3).
 The hyperparameters a and b are equal to 1, 3,
respectively, and were selected using a grid search and
rounded to the nearest whole number. It is important to note
these hyperparameters received during the training of the
model on the simulated data. In fact, when conducting large
experiments (with a large amount of data) we need to look
again for these hyperparameters under the collected dataset
in order to increase the accuracy of the obtained data.
 Figure 8. 1 – time series of the third experiment;
 2 – value of the cut anomalies
 The case presented in Fig. 8 differs from the previous
 two because it has a much larger variance. The person who
 was taking the test was almost not distracted, and the
 presence of such peaks indicates a psychophysical state, so
 most of them will not be cut.

 Figure 6. 1 – time series of the first experiment;
 2 – value of the cut anomalies
 In the case presented in Fig. 6, we see one anomaly
(peak on the upper side of line 2 at t = 35.876), which
stands out against the background of other data. After
application (3), it will be equal to 0.233. In this case (3)
works correctly, because during the experiment the person Figure 9. 1 – time series of the fourth
was really distracted for a split second. experiment; 2 – value of the cut anomalies

VOLUME 20(2), 2021 195
Lesia Mochurad et al. / International Journal of Computing, 20(2) 2021, 190-200

 The case of Fig. 9 has a minimum variance (it is worth As the number of experiments increases (with large-
paying attention to the scale of the vertical axis), so there scale data collection), it is likely that the distribution of the
are no anomalies in it. In the same form it will be submitted number of clicks will be very similar to that shown in
to the model. The result of application (3) is true, the person Fig. 11, and this can be quite helpful in subsequent studies.
was not distracted by external factors when undergoing An overview of what data to expect and which models to
testing. use appears. Below is another histogram of the distribution
 The results of all thirty experiments are given below in of the standard deviation of each experiment (see Fig. 12).
the form of histograms – a method of presenting tabular
data (see Fig. 10-12). This is done in order to get
acquainted with the distributions of some numerical
characteristics of the time series of experiments.

 Figure 12. The distribution diagram of the
 standard deviation
 Figure 10. Histogram of the distribution of the
 number of clicks N B. RESULT OF MODEL LEARNING
 Unfortunately, little research has been done on data
 The width of the column indicates the range, and collection based on the tapping test, as this requires
the height indicates the number of experiments that knowledge in the development and design of information
belong to that range. Analyzing the histogram in systems, and therefore there are not enough data sets to test
Figure 10 it can be concluded that the average value the developed model. Of course, with the development of
of the number of clicks of the thirty experiments is technology this will change, but now, to test the developed
concentrated in the vicinity of 310 clicks. We can also model on data of this type, it is necessary to test it first on
 synthetic data, and then on data from another distribution,
see that in two experiments, people were able to click
 but similar to the data of the tapping test (one-dimensional
more than 400 times on the device. time series). So we proposed a synthetic data generator, the
 operation of which is explained below.

 B.1 RESULT OF MODEL LEARNING ON A SYNTHETIC
 DATASET
 The synthetic data generator works as follows:
 1. One of the functions is randomly selected (uniform
 distribution):
 a. g1 ( x ) = 0.005( x − 30) + 0.3;
 2

 b. g 2 ( x) = −0.005( x − 30) + 0.5.
 2

 2. m numbers are generated on the interval [0, 60]
 (uniform distribution). m is also chosen randomly from
 the interval [200, 400].
 3. Each of the numbers is fed into a randomly
 selected function gi and r is added – a normally
 distributed quantity with a mathematical expectation of
 Figure 11. Distribution diagram of the average
 zero and a variance of two (for each number in the
 value of Y

196 VOLUME 20(2), 2021
Lesia Mochurad et al. / International Journal of Computing, 20(2) 2021, 190-200 series it is generated again): Below, Fig. 15 shows the results of solving the problem ~ ( = 0, 2 = 2) The target label is a randomly of classification on synthetic data on specific examples. selected function, and the data is the resulting vector. The model was trained in 40 epochs. Optimization was performed using a mini-batch gradient descent. The dataset was generated in 100,000 rows and divided into 2 subsets in the ratio 1/3: 2/3 – training and validation. The model was trained on the training subset, and the final accuracy was displayed on the validation subset. Also on the validation subset the model is checked for overfitting [14]. Figure 13. Changing the error function on the training and validation subset, where L is the value of the error function In order to show the learning speed of the model, the following graphs are used: change in AUC (see Fig. 14) and error functions with each epoch (see Fig. 13). In the fifteenth epoch, the model showed an AUC of 0.9913, and in the last fortieth – 0.9976 (AUC is measured from zero to one, and the higher the value, the more Figure 15. The results of solving the accurate the model). The error L in the fortieth epoch was classification problem on specific examples (blue 0.0146. graphs – classes of function a, red – classes of function b) Table 2. Probability of time series belonging to the class Case g1 g2 1 0.9996 0.0004 2 0.0010 0.9990 3 0.9991 0.0009 4 0.0050 0.9950 5 0.9989 0.0011 6 0.0013 0.9987 In Table 2 a bold font indicates valid classes (of which there were two for this test). Columns g1 , g 2 are responsible for predicting the probability with which the series belongs to a certain class. As we can see, the model predicts the correct classes with high accuracy. Figure 14. Changing the accuracy of the AUC on the training and validation subset VOLUME 20(2), 2021 197
Lesia Mochurad et al. / International Journal of Computing, 20(2) 2021, 190-200 B.2 RESULTS OF MODEL LEARNING ON A REAL DATA V. DISCUSSION WITH SIMILAR STRUCTURE Another method of reading data to analyze the Also, by encoding words, the problem of text classification psychophysical state of a person is the keyboard typing test can be reduced to this task. There are many datasets on this (KTT) [34]. The essence of KTT is that a person enters issue. We selected an imdb dataset from the keras arbitrary text on the keyboard for a certain period of time. library [33]. Its dimension is 50,000 rows divided into 3 The time when she/he pressed the key and when she/he classes. This dataset was also divided into 2 subsets, but in released the key is recorded. The key pressed is also another proportion in order to provide more data for recorded. So, as a result, we have two vectors and an array training: 35,000 elements for training and 15,000 elements with the keys pressed: for validation. Also, in order to show the learning speed of the model, the following graphs were used: change in AUC Х1 = (t11, t12 ,..., t1n ) , (Fig. 16) and error functions with each epoch (Fig. 17). Х 2 = (t21, t22 ,..., t2n ) , K = k1, k 2 , ..., kn . Vector ΔX: Х = X 2 − X1 indicates how long the key has been pressed. For comparison, consider the results of an experiment involving 85 people [23] (see Fig. 18). Participants were asked to enter any text on the computer keyboard. Figure 16. Changing the error function on the training and validation subset, where L is the value of the error function Figure 18. Time series before reducing anomalies As we can see in Fig. 18, KTT results also show anomalies. They can be removed using equation (3) to increase the accuracy of the model. Fig. 19 shows that after reducing the anomalies, the points that are far from the average value became equal to 0.341. Figure 17. Changing the accuracy of the AUC on the training and validation subset In the fifteenth epoch, the model showed an AUC of 0.9472, and in the last fortieth – 0.9518. This indicates that the model is quite powerful and copes with such complex data as text. The error L in the last epoch was equal to 0.0530. The best error is between the fifth and tenth epoch with respect to the validation dataset. The error on the Figure 19 – Time series after reduction of validation dataset indicates that after 20 epochs, the model anomalies is overfitted. 198 VOLUME 20(2), 2021
Lesia Mochurad et al. / International Journal of Computing, 20(2) 2021, 190-200

 Both methods (FTT, KTT) demonstrate well the [3] A. Jobbágy, P. Harcos, R. Karoly, G. Fazekas, “Analysis of finger-
 tapping movement,” Journal of Neuroscience Methods, vol. 141, pp.
motility of the fingers of persons who were tested. When
 29-39, 2005, https://doi.org/10.1016/j.jneumeth.2004.05.009.
conducting the experiment, we noted exactly how in the [4] H. Jin, S. Gong, Y. Tao, et al., “A comparative study of asleep and
case of FTT we need to click on the device: we need to put awake deep brain stimulation robot-assisted surgery for Parkinson’s
our hand on the table and with our index finger, without disease,” NPJ Parkinsons Dis., vol. 6, paper 27, 2020,
 https://doi.org/10.1038/s41531-020-00130-1.
bending it, click on a certain place on the device. But often
 [5] B. R. Ott, S. A. Ellias, M. C. Lannon, “Quantitative assessment of
people broke these rules. In general, both in FTT and in movement in Alzheimer’s disease,” J Geriatr Psychiatry Neurol, vol.
KTT, external factors strongly influenced the result. 8, issue 1, pp. 71-75, 1995.
 There are many methods for reading data similar to a [6] L. W. Welch, A. T. Cunningham, M. J. Eckardt, P. R. Martin, “Fine
 motor speed deficits in alcoholic Korsakoff’s syndrome,”
tapping test or a keyboard typing test. With the right
 Alcoholism, Clinical and Experimental Research, vol. 21, issue 1, pp.
approach in terms of analysis, we can achieve good results 134-139, 1997, https://doi.org/10.1111/j.1530-0277.1997.tb03741.x.
in identifying special patterns and relationships between [7] N. J. Arts, S. J. Walvoort, R. P. Kessels, “Korsakoff’s syndrome: a
motor skills and psychophysical state of a person. This can critical review,” Neuropsychiatr Dis Treat, vol. 13, pp. 2875-2890,
 2017, https://doi.org/10.2147/NDT.S130078.
be applied in many of the areas mentioned earlier. One such
 [8] G. Giovannoni, J. van Schalkwyk, V.U. Fritz, A.J. Lees,
approach is proposed and analyzed in this article. It is with “Bradykinesia akinesia in co-ordination test (BRAIN TEST): an
the use of neural networks, in particular LSTM, and with objective computerised assessment of upper limb motor function,” J
the correct collection of data, that one can find these Neurol Neurosurg Psychiatry, vol. 67, pp. 624-629, 1999,
 https://doi.org/10.1136/jnnp.67.5.624.
connections and patterns that one might never find by
 [9] E. Nalçaci, C. Kalaycioğlu, M. Çiçek, & Y. Genç “The relationships
relying on intuition. between handedness and fine motor performance,” Cortex: A Journal
 Devoted to the Study of the Nervous System and Behavior, vol. 37,
VI. CONCLUSION issue 4, pp. 493–500, 2001, https://doi.org/10.1016/S0010-
In this paper, a model for classification of a psychophysical 9452(08)70589-6.
 [10] L. Jancke, G. Schlaug, H. Steinmetz, “Hand skill asymmetry in
state of a person on psychomotor indicators based on professional musicians,” Brain and cognition, vol. 34, pp. 424-432,
recurrent neural networks is developed. The model is 1997, https://doi.org/10.1006/brcg.1997.0922.
implemented programmatically and tested on synthetic and [11] M. Çiçek, Y. Genc, “The relationship between handedness and fine
real data from similar distribution. For forty learning motor performance,” Cortex, vol. 37, issue 4, pp. 493-500, 2001,
 https://doi.org/10.1016/S0010-9452(08)70589-6.
epochs, the model showed 99% AUC on synthetic data, and [12] D. West, V. West. “Model selection for a medical diagnostic
95% AUC on data from another distribution. A software decision support system: a breast cancer detection case”, Artif Intell
product is developed that accurately records the moments Med., vol. 20, issue 3, pp. 183-204, 2000,
of clicks and with which data is collected. Based on the https://doi.org/10.1016/s0933-3657(00)00063-4.
 [13] P. Mangiameli, D. West, R. Rampal, “Model selection for medical
investigation, it is analyzed how to conduct experiments for diagnosis decision support systems,” Decision Support Systems, vol.
better model generalization in future. More specifically, 36, issue 3, pp. 247-259, 2004, https://doi.org/10.1016/S0167-
external factors should be eliminated as much as possible, 9236(02)00143-4.
and the person being tested should be monitored so that he [14] Yu. A. Chistoedova, A. A. Kylosov, “Assessment and comparison of
 psychophysiological characteristics of athletes in different sports,”
or she does not break the rules. In general, the conducted Scientific and Methodical Electronic Journal “Concept”, vol. 2, pp.
research can serve as an excellent basis for other 575–581, 2017. [Online]. Available at: http://e-
investigations in different directions, such as: koncept.ru/2017/570114.htm.
 1. Selection of candidates for a position that requires a [15] R. C. Deo, “Machine Learning in Medicine,” Circulation. Вasic
 Science for Clinicians, vol. 132, pp. 1920–1930, 2015,
 stable nervous system; https://doi.org/10.1161/CIRCULATIONAHA.115.001593.
 2. Detection and investigation of different diseases [16] J. Gao, Y. Yang, P. Lin, D. S. Park, “Computer vision in healthcare
 related to psychophysical state of a person; applications,” Journal of Healthcare Engineering, vol. 2018, Article
 3. Monitoring of psychophysical state of a person after ID 5157020, 2018, https://doi.org/10.1155/2018/5157020.
 [17] A. Géron, Hands-On Machine Learning with Scikit-Learn and
 medical operations using deep learning models. Tensorflow, O’Reilly, 2017.
 It also could be something related to optimization of [18] I. Goodfellow, Y. Bengio, A Courville, Deep Learning, MIT Press,
model for getting better accuracy. 2016, 766 p.
 Our approach combines robust machine learning [19] R. Mogull, Second-Semester Applied Statistics, Kendall/Hunt
 Publishing Company, 2004, 59 p.
architectures and statistical methods. We hope that the [20] B. Everitt, Cluster Analysis, 5-th Edition, Chichester, West Sussex,
proposed approach will be useful for future investigations U.K: Wiley, 2011, 330 p. https://doi.org/10.1002/9780470977811.
of psychophysical state. [21] E. Alpaydin, Introduction to Machine Learning, MIT Press, 2010.
 [22] L. Schmitt, “Finger-tapping test,” In: Volkmar F.R. (eds)
 Encyclopedia of Autism Spectrum Disorders, Springer, New York,
References NY, 2013, https://doi.org/10.1007/978-1-4419-1698-3_343.
[1] O. P. Eliseev, Determination of the Coefficient of Functional [23] V. Chandola, A. Banerjee, V. Kumar, “Anomaly detection: A
 Asymmetry and Properties of the Nervous System on Psychomotor survey,” ACM Computing Surveys, vol. 41, issue 3, pp. 1–58, 2009,
 Parameters. Praktikum on psychology of the person, St. Petersburg, https://doi.org/10.1145/1541880.1541882.
 2003, pp. 200-202. [24] I. Izonin, R. Tkachenko, V. Verhun et al., “An approach towards
[2] E. P. Ilyin, “Methods of rapid diagnosis of the properties of the missing data management using improved GRNN-SGTM
 nervous system by psychomotor indicators (tapping test),” ensemblemethod,” Engineering Science and Technology, an
 Psychological diagnosis, [Online]. Available at: International Journal, vol. 24, issue 3, pp. 749-759, 2020,
 https://sites.google.com/site/test300m/tt. https://doi.org/10.1016/j.jestch.2020.10.005.

VOLUME 20(2), 2021 199
Lesia Mochurad et al. / International Journal of Computing, 20(2) 2021, 190-200

[25] S. I. Nikolenko, A. A. Kadurin, E. O. Arkhangelskaya, Deep [35] Ç. Barut, E. Kızıltan, E. Gelir, F. Köktürk, “Advanced analysis of
 Learning. Immersion in the World of Neural Networks, St. finger-tapping performance: A preliminary study,” Balkan Med J,
 Petersburg: Peter, 2016. vol. 30, issue 2, pp. 167-171, 2013,
[26] Y. Bengio, R. Ducharme, P. Vincent, and C. Janvin, “A neural https://doi.org/10.5152/balkanmedj.2012.105.
 probabilistic language model,” J. Mach. Learn. Res., vol. 3, pp.
 1137–1155, 2003.
[27] R. C. Staudemeyer, E. Rothstein Morris, Understanding LSTM – a LESYA MOCHURAD is a candidate of
 tutorial into Long Short-Term Memory Recurrent Neural Networks, Technical Sciences, an Associated
 CoRR abs/1909.09586 (2019), 42 p., arXiv:1909.09586. Professor at the Department of Artificial
[28] S. Wu, P. Flach, A scored AUC Metric for Classifier Evaluation and Intelligence Systems of Lviv Polytechnic
 Selection, 2005. National University. Scientific interests:
[29] D. Kingma and J. Ba, “Adam: A method for stochastic modeling of real modern electronic-
 optimization,” Proceedings of the International Conference ICLR, optical systems, big data analysis, the
 2015, pp. 1-15. model of professional stress
[30] S. Kostadinov, Understanding Backpropagation Algorithm, [Online]. development.
 Available at: https://towardsdatascience.com/understanding-
 backpropagation-algorithm-7bb3aa2f95fd.
[31] D. Hawkins, S. Basak, D. Mills, “Assessing model fit by cross–
 validation,” Journal of Chemical Information and Computer YAROSLAV HLADUN, is a student of
 Sciences, vol. 43, issue 2, pp. 579–586, 2003, the Artificial Intelligent Systems
 https://doi.org/10.1021/ci025626i. Department of Lviv Polytechnic National
[32] X. Ying, “An overview of overfitting and its solutions,” Journal of University.
 Physics: Conference Series, vol. 1168, pp. 1-6, 2019,
 https://doi.org/10.1088/1742-6596/1168/2/022022.
[33] Datasets of Keras library, [Online]. Available at:
 https://keras.io/api/datasets/
[34] L. Giancardo, A. Sánchez-Ferro, T. Arroyo-Gallego, I. Butterworth,
 C. S. Mendoza, P. Montero, M. Matarazzo, J. A. Obeso, M. L. Gray
 & R. San José Estépar, “Computer keyboard interaction as an
 indicator of early Parkinson's disease,” Scientific Reports, vol. 6, pp.
 1-10, 2016, https://doi.org/10.1038/srep34468.

200 VOLUME 20(2), 2021
You can also read