State-space models reveal a continuing elephant poaching problem in most of Africa - Nature
←
→
Page content transcription
If your browser does not render page correctly, please read the page content below
www.nature.com/scientificreports
OPEN State-space models reveal a
continuing elephant poaching
problem in most of Africa
Scott Schlossberg1 ✉, Michael J. Chase1, Kathleen S. Gobush2, Samuel K. Wasser2 &
Keith Lindsay3
The most comprehensive data on poaching of African elephants comes from the Monitoring the Illegal
Killing of Elephants (MIKE) program, which reports numbers of illegally killed carcasses encountered by
rangers. Recent studies utilizing MIKE data have reported that poaching of African elephants peaked
in 2011 and has been decreasing through 2018. Closer examination of these studies, however, raises
questions about the conclusion that poaching is decreasing throughout the continent. To provide
more accurate information on trends in elephant poaching, we analyzed MIKE data using state-space
models. State-space models account for missing data and the error inherent when sampling carcasses.
Using the state-space model, for 2011–2018, we found no significant temporal trends in rates of illegal
killing for Southern, Central and Western Africa. Only in Eastern Africa have poaching rates decreased
substantially since 2011. For Africa as a whole, poaching did decline for 2011–2018, but the decline was
entirely due to Eastern African sites. Our results suggest that poaching for ivory has not diminished
across most of Africa since 2011. Continued vigilance and anti-poaching efforts will be necessary to
combat poaching and to conserve African elephants.
Beginning around 2007, a wave of poaching for ivory affected populations of savannah elephants (Loxodonta afri-
cana) and forest elephants (L. cyclotis) across Africa1. The total population of savannah elephants decreased by 30%
between 2007 and 20152, and an estimated 100,000 elephants of both species were poached between 2010 and 20123.
In some countries, elephant populations declined by over 50% in under 10 years2. With elephant populations and
ranges already greatly reduced from pre-colonial levels, such losses put many populations at risk of extirpation4,5.
Recent reports, however, indicate that elephant poaching may be abating6,7. Since 2016, some African parks
have reported reductions or even a halt in elephant poaching8,9. Likewise, global ivory prices appear to have
peaked and may have begun to fall, perhaps as a result of bans on ivory sales10. Accurately determining whether
or not poaching is diminishing is critical for evaluating the success of ivory trade bans and other anti-poaching
measures. Controversially, several African countries have proposed selling stockpiles of ivory11. Such sales may
not be justifiable if elephant poaching is continuing at the high levels of the early 2010s.
Elephant population surveys tend to be infrequent, so our main source of information on poaching rates
is the Monitoring the Illegal Killing of Elephants (MIKE) program, administered by the Convention on the
International Trade in Endangered Species of Wild Fauna and Flora (CITES). Accordingly, rangers at sites across
African gather data on the cause of death for elephant carcasses encountered during patrols12. The proportion of
carcasses killed illegally, as opposed to deaths due to natural causes, legal hunting, or killing of problem animals
by wildlife authorities, is known as “PIKE” and is considered an index of poaching rates3. PIKE data are typically
aggregated to estimate regional or continental poaching rates. For all of Africa, estimates using the MIKE pro-
gram’s methodology show a 31% reduction in PIKE between 2011 and 2018 (see Results). The program recently
reported that PIKE has exhibited a “steady downward trend” since 20116.
CITES estimates PIKE values for Africa as a whole via general linear models, treating region and year as fixed
effects so that
PIKEi , t = regioni + yeart + i , t (1)
1
Elephants Without Borders, PO Box 682, Kasane, Botswana. 2Center for Conservation Biology, Department of
Biology, University of Washington, Seattle, WA, 98195, USA. 3Amboseli Trust for Elephants, PO Box 15135, Langata,
Nairobi, 00509, Kenya. ✉e-mail: xanthocephalus@gmail.com
Scientific Reports | (2020) 10:10166 | https://doi.org/10.1038/s41598-020-66906-w 1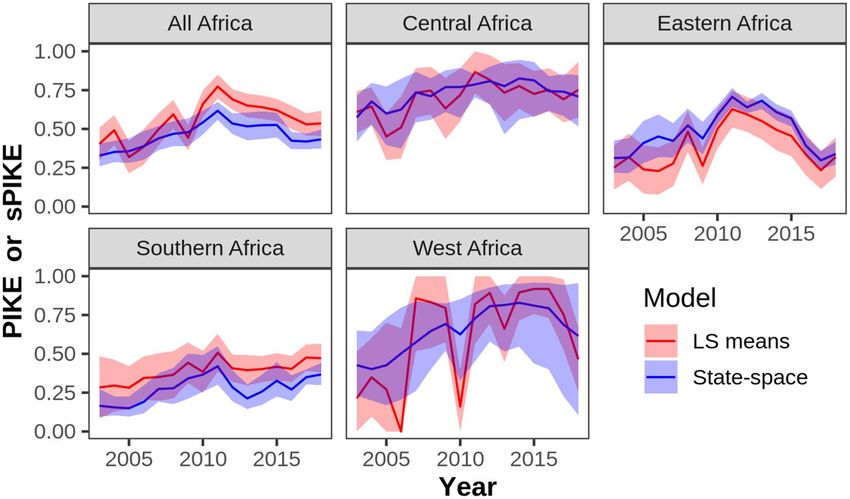
www.nature.com/scientificreports/ www.nature.com/scientificreports
where i indexes site, t is year, and i , t , is a normal error term with mean = 013. In the models, observations are
weighted by the total number of carcasses (legal and illegal) reported for that site and year. Per the MIKE pro-
gram, this weighting ensures that sites with better sampling, defined as those with more carcasses reported, have
the most influence on PIKE estimates13.
These models, while simple, pose several significant problems that call into question the resulting PIKE esti-
mates and inferences about trends in poaching. First, weighting observations by observed numbers of carcasses
leads to biased inferences. Ideally, carcass sample sizes would be directly proportional to the number of live
elephants in each ecosystem so that the resulting PIKE estimates would be an accurate index of overall poaching
rates. In reality, reported carcasses have a weak relationship to elephant population sizes (r2 = 0.21; unpublished
data), so the resulting PIKE estimates are biased compared to the true poaching rate. Also, because observed
numbers of carcasses fluctuate by year, the weights of the sites also vary from year to year. As a result, changes
in PIKE estimates from year to year are not entirely due to changes in poaching rates. Another problem with
the MIKE analyses is missing data. For 2003–2018, an average of 27% of African MIKE sites failed to report any
carcasses. Missing data are not random, either, as many sites are missing data for continuous blocks of years or
alternating years, and some sites report results more consistently than others. The model in equation (1) does
not account for missing data, so PIKE estimates may be biased by changing composition of the sample. Finally,
linear modeling of PIKE values assumes that errors are normally distributed. PIKE, however, is on a [0–1] prob-
ability scale, which violates the normality assumption of general linear models and results in biased confidence
intervals14.
These problems with the CITES MIKE analysis13 make it difficult to know if elephant poaching is actually
decreasing. As an alternative, we suggest using state-space models to assess trends in PIKE and elephant poach-
ing. With state-space models, the observed PIKE values are considered a noisy sample from the state, which is the
“true” underlying value of PIKE15. Change in the state from year to year can be modeled as a parametric process
such as a random walk. Compared to observed PIKE, state values are smoothed and relatively insensitive to
stochastic fluctuations in observed numbers while still tracking real changes in PIKE. In the state-space model,
observed PIKE values are a binomial sample from the underlying state. Because binomial sampling has inherent
error, observed PIKE values will deviate from the state values. The amount of smoothing is inversely proportional
to the number of carcasses observed. State-space models can be fit to MIKE data via the extended Kalman filter16.
Using state-space models with MIKE data deals with all of the problems mentioned above and should produce a
more accurate index of poaching rates. Here, we used state-space models to assess recent trends in poaching in
Africa and determine whether or not poaching has declined in recent years, both for the continent and by region.
Results
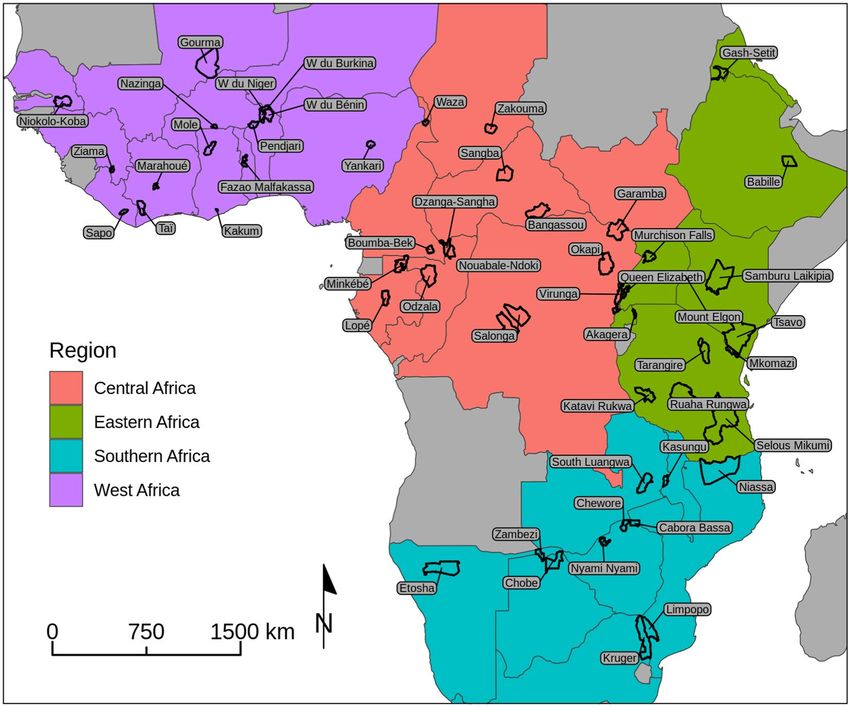
Of the 53 African MIKE sites (Fig. 1), 38 sites from 28 countries had carcass data for ≥4 years in 2003–2011 and
≥4 years in 2011–2018 and were included in the state-space models. The 38 sites had a mean of 13.1 years of data
(range: 9–16 years) for the 16-year study period and averaged 31.3 carcasses reported per year (range: 3.1–187.7).
Estimated live elephant populations averaged 4,845 on the 38 included sites and 319 on the 15 excluded sites.
Consequently, excluding these sites should have little effect on our conclusions because excluded sites’ weights
would be small when calculating regional estimates. Numbers of carcasses reported and estimated elephant pop-
ulation sizes varied substantially by region and were generally largest in Eastern and Southern Africa and smallest
in West Africa (Table 1).
Using the state-space model, we estimated “sPIKE,” the smoothed, state estimate of PIKE, for each site and
year. In general, sPIKE values deviated little from raw PIKE where the number of carcasses was large, but discrep-
ancies were greater when the number of carcasses was small (Supplementary Fig. S1). This was expected because
binomial sampling error is inversely proportional to sample size. For a few sites, sPIKE estimates were flat over
time, suggesting that observation error explains most or all of the temporal variation in PIKE. Models showed a
good fit to the data (r = 0.93) and no significant spatial or temporal autocorrelation in residuals (Supplementary
Fig. S2).
For the continent as a whole, the state-space model predicted consistently lower poaching levels than the
least-squares mean estimates from CITES (Fig. 2). By region, however, differences between the CITES and
state-space models were more idiosyncratic. In Central and Eastern Africa, sPIKE values were greater than the
CITES values (Fig. 2). By contrast, sPIKE estimates in Southern Africa were lower than the CITES estimates. In
West Africa, confidence intervals on sPIKE were wide for most years due to small sample sizes (x = 7.5 carcasses
site−1 year−1).
Changing the minimum sample size requirements for 2003–2011 and 2011–2018 had little effect on our
results. Other than small differences in confidence intervals, sPIKE estimates were nearly identical for minimum
samples of 2–5 years in each time period (Supplementary Fig. S3). When we increased the minimum sample size
to 6, we obtained moderately lower sPIKE estimates. Only 26 sites met the criteria for inclusion with a minimum
of 6 observations in each time period.
For 2003–2010, sPIKE for the entire continent increased at a significant rate of 0.03 year−1 (Table 2). Trends
in sPIKE were increasing and significant in all four regions for those years. For 2011–2018, sPIKE decreased sig-
nificantly in eastern Africa and for Africa as a whole (Table 2). Trend estimates for Southern and Western Africa
were small and not significantly different from 0. The trend for Central Africa was negative but not significant
after Bonferroni correction.
We used simulations to test the accuracy of the state-space model. With completely random PIKE values,
continental sPIKE estimates had mean root mean square error (rmse) of 0.04 (range: 0.02–0.08). By site, rmse
averaged 0.20 (range: 0.18–0.23). For simulations with logit-linear trends in PIKE, the mean continent-wide rmse
was lower at 0.02 (range: 0.01–0.03). By site, rmse for simulations with trends averaged 0.10 (range; 0.08–0.13).
Scientific Reports | (2020) 10:10166 | https://doi.org/10.1038/s41598-020-66906-w 2www.nature.com/scientificreports/ www.nature.com/scientificreports
Figure 1. MIKE sites by region in Africa, with site names labelled. Sites are outlined in black. This map was
created in Program R27 using Natural Earth data (https://www.naturalearthdata.com) and CITES MIKE data
(https://www.cites.org/eng/prog/mike/index.php).
No. years with data
Est. no. live
Region Sites 2003–2011 2011–2018 2003–2018 No. carcasses elephants
Central Africa 12 7.3 (4–9) 6.8 (4–8) 13.1 (9–16) 17.8 (5.7–59.0) 3,529 (213–18,844)
Eastern Africa 10 8.3 (7–9) 7.5 (5–8) 14.9 (12–16) 51.0 (3.8–187.7) 6,559 (105–20,619)
Southern Africa 9 7.9 (4–9) 8.0 (8–8) 14.9 (11–16) 46.1 (12.5–130.1) 8,078 (1,338–27,802)
West Africa 7 5.9 (5–8) 6.6 (6–8) 11.7 (10–15) 7.5 (3.1–17.4) 492 (35–1,003)
Africa 38 7.4 (4–9) 7.2 (4–8) 13.7 (9–16) 31.3 (3.1–187.7) 4,845 (35–27,802)
Table 1. Sample sizes and summary statistics for MIKE sites used in the state-space analysis. Values other than
the number of sites are shown as the mean with range by site in parentheses.
Discussion
Analyzing MIKE data with state-space models, we found no significant trends in sPIKE for 2011–2018 in three
of four African regions. Only in Eastern Africa did we find a significant trend, a clear decrease in sPIKE for
2011–2018. Southern, Central, and Western Africa all had non-significant trends in sPIKE for those years. Even
if we accept the result for Central Africa as significant, the trend was just −0.01 year−1, a rate of change just 15%
as large as the trend for East Africa (Table 2). The 2011–2018 trend for the continent as a whole was negative, but
the effect is driven entirely by the strong decline in Eastern Africa. To demonstrate this, we recalculated conti-
nental sPIKE while excluding data from Eastern Africa. The trend estimate for 2011–2018 was −0.007 ± 0.006
year−1, which was not significantly different from 0 (P = 0.30). Thus, we conclude that poaching, as measured by
sPIKE, has not been decreasing in most of Africa since 2011. This conclusion stands in contrast to recent anal-
yses of MIKE data6,7. Though CITES has consistently noted that there is uncertainty in trend estimates6, media
reports based on CITES reports and a recent paper by Hauenstein et al.7 have largely ignored this uncertainty
and reported declines in poaching levels since 201117,18. By contrast, our findings show the importance of using
appropriate analytic methods to measure trends in poaching rates.
Scientific Reports | (2020) 10:10166 | https://doi.org/10.1038/s41598-020-66906-w 3www.nature.com/scientificreports/ www.nature.com/scientificreports
Figure 2. Smoothed sPIKE estimates from state-space models and PIKE estimates from CITES least-squares
means (“LS means”) model for all of Africa and by subregion. Lines indicate mean estimates, and shading
indicates 95% confidence intervals.
Region Years Estimate ± SE t P
2003–2010 0.03 ± 0.002 13.40www.nature.com/scientificreports/ www.nature.com/scientificreports
one would need to run a model that fits year effects separately for each region. Simply looking at either the CITES
estimates or the sPIKE estimates in Fig. 2 strongly suggests that the trends in the four regions are dissimilar.
In contrast to the other recent analyses, state-space models proved ideal for analyzing MIKE data on elephant
carcasses, for several reasons. First, the model takes into account the inherent error in sampling the causes of
elephant mortality. As a result, in West Africa, where relatively few carcasses were reported, confidence intervals
around sPIKE estimates were wide, suggesting that we lack sufficient data to precisely estimate poaching levels
in that region. More generally, incorporating error in the data generation process is critical when modeling any
ecological phenomenon19. Another major advantage of the state-space model is the ability to account for missing
data. In West Africa, the sudden dips in the CITES PIKE estimates in 2006 and 2010 are largely due to many sites’
missing data for those years (Fig. 2). The state-space model does not produce similar dips because it accounts for
missing data. Finally, the state-space model is relatively easy to fit using the extended Kalman filter. R packages
such as KFAS, dlm, and walker can be used to fit state-space models.
Simulations with known PIKE values showed that our state-space models can accurately estimate poaching rates.
The process error for the state-space model with actual MIKE data averaged 1.2 across the 38 sites. In the simulations,
mean process error was 0.8 with trends and 3.1 without trends. Thus, the simulations with trends are likely the best
guide for assessing the accuracy of the state-space model. Mean rmse for continental estimates was just 0.02 for simula-
tions with an underlying trend in PIKE. This suggests that the state-space model can produce accurate results even with
the missing data and relatively small sample sizes that characterize the MIKE dataset. In the simulations, mean rmse
was larger when calculated by site, at 0.10. This is unsurprising, as the total sample sizes for many sites were small, and
smoothing produces discrepancies between predicted and observed values. Thus, our results suggest that state-space
models will be most useful for calculating regional or continental poaching rates rather than site-level estimates.
One notable result of our study is that continental sPIKE estimates were consistently lower than CITES’ PIKE
estimates. A likely reason for this difference is that in CITES’ models, observations are weighted by sample size.
Consequently, when poaching increases, the number of carcasses increases as well because elephant mortality
from poaching is largely additive, not compensatory3,7. This gives sites with more poaching excess weight in the
linear models and biases the resulting PIKE estimates high.
Our results come with an important caveat: the state-space model cannot account for inherent bias in the
reporting of carcasses. Some MIKE sites consistently reported PIKE values equal to or near 1.0 (Supplementary
Fig. S1). These sites could be biasing their reporting towards illegally killed carcasses, perhaps based on investigat-
ing intelligence reports12. Though state-space models can account for sampling error, they cannot correct biased
data on their own. Thus, the state-space model is not a panacea for all sampling issues.
Our findings have major implications for conservation of African forest and savannah elephants. Notably, we
find that illegal killing has improved little or even worsened since 2011 in Southern, Western, and Central Africa.
The reduction in poaching in East Africa appears to be real and is laudable, but conservationists and governments
should not allow improvement in one region to influence their view of what is happening in the rest of Africa.
Poaching levels remain high and are likely unsustainable in Central and Western Africa. In Western Africa, most
savannah elephant populations are small and isolated, meaning that these populations could be at risk of extir-
pation4. In Central Africa, studies have shown major declines in some elephant populations5,20. Recent survey
data from Southern Africa is limited, but two major elephant populations in this region are showing worrisome
trends. Northern Botswana’s large elephant population has been experiencing a spike in poaching since 201721,
and Kruger NP in South Africa has experienced heightened poaching recently as well6. Taken together, these
findings call for continued vigilance and anti-poaching and anti-trafficking efforts.
The MIKE program is an extremely valuable source of information on the status of elephant populations
across Africa and Asia. In many countries, elephant surveys are infrequent, and some governments refuse to
release elephant survey data. Thus, MIKE is notable for being the only publicly available source of data for many
elephant populations. Proper analysis of MIKE data will help to ensure that managers and decision-makers have
accurate information needed to conserve elephants. The MIKE program has recently initiated a process to update
their analytic methods6. We suggest that state-space models or other methods that account for observation error
be used in future analyses of MIKE data.
Methods
Study areas. We used data from 53 African MIKE sites that began reporting prior to 2010 (Fig. 1). Additional
sites in Asia as well as African sites added to the program in 2018 were not considered here. MIKE sites tend to be
protected areas, though some sites are unprotected or include both protected and unprotected areas. The 53 sites
average 9,863 km2 in area (range: 175–51,027 km2) and are divided into four regions (Fig. 1). Habitats on MIKE
sites are varied and include savannahs, grasslands, tropical forests, and a variety of other vegetation types. In our
analyses, we did not attempt to distinguish between sites with forest or savannah elephants. Forest elephants pre-
dominate in MIKE’s Central Africa region, though a few sites in this region hold savannah elephants.
MIKE data. MIKE data were made available by CITES at http://cites.org/eng/prog/mike/data_and_reports.
Each MIKE site reports annual totals of the number of carcasses of all origins encountered and the number
of illegally killed carcasses encountered. The program utilizes strict criteria for determining a carcass’ cause of
death22. In our analyses, we used data from 2003–2018; we excluded data from a few pilot sites in 2002. As men-
tioned above, no data exists for many site-year combinations, and some MIKE sites have few years with data. To
accurately estimate trends in PIKE, we arbitrarily restricted the dataset to sites with at least 4 years with data for
2003–2011 and 4 years with data for 2011–2018. We used 2011 as a dividing point because of reports that 2011
was an inflection point for elephant poaching rates, with distinct trends before and afterwards6,7. Thus, good
estimates of trends in PIKE require multiple observations before and after 2011. We tested how these sample-size
restrictions affected our results, as discussed below.
Scientific Reports | (2020) 10:10166 | https://doi.org/10.1038/s41598-020-66906-w 5www.nature.com/scientificreports/ www.nature.com/scientificreports
Elephant population estimates. To estimate PIKE by region or for the continent, we had to weight
PIKE estimates from individual sites. The MIKE program weights individual sites by the number of carcasses
reported13. As noted above, carcasses reported are only weakly related to elephant population size and more likely
reflect search effort as well as rates of poaching and natural mortality. Instead, we weighted site PIKE estimates
by live-elephant population size. This should allow for better inferences about regional and continental poaching
levels because the resulting PIKE estimates should be representative of the entire region or the continent. We
obtained elephant population estimates for MIKE sites from four sources (see Supplementary Table S1): pub-
lished survey reports, unpublished survey reports, the African Elephant database23, and African elephant status
updates from IUCN24,25. For each survey, we examined study area maps to ensure that survey boundaries were
congruent with MIKE site boundaries. Where necessary, we excluded survey strata outside MIKE boundaries
from population estimates.
MIKE data are reported annually, but elephant surveys were generally less frequent. Weighting by elephant
population size requires estimates for each site and year. Thus, for each site, we used linear interpolation to esti-
mate population sizes between surveys. For years prior to the earliest available survey, we used the earliest survey
estimate. For years after the latest elephant survey, we used the latest survey estimate. If only a single elephant
population estimate was available, we used that estimate for all years. In our sample, there was a positive correla-
tion between the number of elephant population estimates and the mean population size (r = 0.45). This means
that fewer interpolated estimates were generally needed for the sites with the largest weights in the analysis.
State-space models. We used state-space models to estimate the unobserved, “true” PIKE for each site and
year while accounting for missing data and smoothing over fluctuations due to sampling error. The state-space
model has two components: an observation model, which treats observed PIKE as a noisy sample of the state,
and a process model, which treats change in the state over time as a parametric process. To avoid confusion with
observed PIKE values, we refer to the state estimates as “sPIKE”; like PIKE, sPIKE is also on a probability scale.
The observation model was a draw from a binomial distribution, with probability equal to sPIKE so that
Ki , t ~ binomial(Ci , t , si , t )
where s is sPIKE, K is the number of illegally killed carcasses, and C is the total number of carcasses reported
for site i and year t. We modeled change in sPIKE over time as a random walk on a logit scale as
logit(si , t ) = logit(si , t -1) + i , t (2)
i , t ∼ N(0, σi2). (3)
2
Here, i , t is the “disturbance,” the change in the state from year to year. Larger values of σi , the process error, allow
for more rapid change in the state and more “wiggle” in sPIKE estimates. We estimated process error separately
for each site, as discussed below.
The state-space model partitions variance in PIKE between the state process and the observation process. As a
result, observed values of PIKE, K/C, will deviate from sPIKE due to binomial sampling. At the same time, sPIKE
should be a more accurate index of poaching levels because it is relatively insensitive to outliers and random fluc-
tuations in observed values. Another advantage of the state-space model is the ability to predict sPIKE in years
when data was missing for a site, by estimating disturbances from equations (2) and (3). Regional and continental
estimates of sPIKE use estimates from all sites in all years so that resulting values are not biased by missing data.
We used the extended Kalman filter to fit the binomial state-space models. The Kalman filter is an algo-
rithm for estimating the underlying state from noisy observations16. In practice, the Kalman filter optimally par-
titions the variance in observations between the state and observation processes. The extended Kalman filter uses
Taylor-series expansion to approximate the binomial distribution as a linear equation, allowing the model to be
fit by maximum likelihood. We made inferences from smoothed estimates of the state16.
We ran our models using the KFAS package26 in Program R27. The Kalman filter can be used with multivariate
time series, which combine multiple sites. In such models, the process error term is a covariance matrix, so that
correlations between sites can be explicitly modeled. We initially tested multivariate models fit by region, with the
process error modeled as an unstructured covariance matrix. This formulation allowed for correlations between
sites in the random walk disturbances, as might be occur if sites follow parallel trends over time. We compared the
multivariate models with models in which process errors were independent for each site. Per Akaike’s Information
Criterion, models with independent disturbances by site were strongly preferred over models with correlated dis-
turbances. Thus, we made inferences from models in which disturbances were uncorrelated between sites.
To validate models, we assessed model residuals for spatial and temporal autocorrelation using the ncf pack-
age28 in R. As a measure of model fit, we computed the correlation between model predictions and actual PIKE
values. To test how our minimum sample size requirements affected our results, we used the state-space model to
predict continental sPIKE for minima of 2–5 years of data for 2003–2011 and for 2011–2018.
Regional estimates and trends. We used the site-wise sPIKE estimates to assess trends in poaching for
the four regions and for the entire continent. For each year, we calculated regional or continental sPIKE as the
weighted mean of the site estimates, with weight equal to estimated elephant populations. Weighting by the num-
ber of live elephants is advantageous because the resulting sPIKE estimates should be an index of the overall
proportion of elephants poached in the given region. Accordingly,
Scientific Reports | (2020) 10:10166 | https://doi.org/10.1038/s41598-020-66906-w 6www.nature.com/scientificreports/ www.nature.com/scientificreports
N
rt = ∑wi ,tsi ,t
i=1
Ei , t
wi , t = N
.
∑ i =1Ei , t
Here, r is the regional or continental sPIKE estimate, w is the weight, Ei,t is the estimated number of live elephants,
and N is the total number of sites in the given region or continent. We computed variances of regional sPIKE
estimates on a logit scale as
N
V(logit(rt )) = ∑wi2,t V(logit(si ,t ))
i=1
for two reasons: first, to allow for the normal approximation to hold in calculating confidence intervals, and
second, because our state-space models estimate variances for sPIKE on the logit scale. Per Oranje29, we calcu-
lated 95% confidence limits on regional sPIKE on the logit scale and then back transformed the estimates to the
probability scale as
logit−1[logit(rt ) ± z 1 −α /2 V(logit(rt )) ] .
To assess trends, we used linear regression, with regional or continental sPIKE estimates as the dependent
variable and year as the independent variable. Because earlier studies showed that poaching peaked in 2011, we
conducted separate regressions for 2003–2010 and for 2011–2018 for each region. To account for error in the
dependent variable in the regression, we used the feasible generalized least squares method30. When the estimated
error due to the variance in sPIKE was small, this method was equivalent to inverse-variance weighted least
squares regression. To reduce the probability of type-I error, we used Bonferroni correction on the significance
levels of the regression coefficients for a family-wise error rate of 0.05.
Simulations. To test the accuracy of the state-space models, we used simulations with known “true” PIKE
values. We ran two sets of simulations, each of which included 100 simulated carcass datasets with sample size
identical to that of the MIKE dataset—16 years of observations and 38 sites. In the first set of simulations, we
assumed a monotonic trend in actual PIKE values (hereafter “aPIKE”) at each site. For each site, we drew a
random starting value for year 1. Subsequent aPIKE values followed a linear trend on a logit scale, with random
deviations from the trendline for each year. Accordingly, for site i,
logit(ai,1) ~ U( − 4, 4)
βi ~ U( − 1, 1)
εi , t ~ N(0, 1)
logit(ai , t |t >1) = logit(ai ,1) + βi(t − 1) + εi , t .
Here, a is aPIKE, β is the linear trend in aPIKE on a logit scale, and ε is the random departure from the trendline.
In the simulations, numbers of illegally killed carcasses were randomly drawn for each site and year from bino-
mial distributions with probability = aPIKE and sample size equal to the observed total number of carcasses in
the MIKE dataset for that site and year. To make the simulated dataset match the MIKE data, we removed site-year
combinations from the simulated dataset that were missing for the actual data. This allowed us to learn how well
the state-space model compensated for missing data.
The second set of simulations utilized random values of aPIKE for all sites and years, with no underlying
trends. Accordingly,
ai , t ~ U(0, 1)
We drew numbers of illegally killed carcasses with binomial draws from the aPIKE values as above. Again, the
simulated datasets included only site and year combinations that were not missing in the MIKE dataset.
For each simulated dataset, we used state-space models to estimate sPIKE for each site and year, as described
above for the MIKE data. To measure the accuracy of the models, for each set of simulations, we computed the
root mean squared error (rmse) of sPIKE for each site and year and averaged the rmse over all estimates. We also
calculated continental sPIKE estimates for each simulation and computed the mean rmse over the years for those
estimates.
Data availability
MIKE data used in this study are available at http://cites.org/eng/prog/mike/data_and_reports. Data on elephant
population sizes and code used to run the state-space models are included in this published article (and its
Supplementary Information files).
Received: 23 December 2019; Accepted: 26 May 2020;
Published: xx xx xxxx
Scientific Reports | (2020) 10:10166 | https://doi.org/10.1038/s41598-020-66906-w 7www.nature.com/scientificreports/ www.nature.com/scientificreports
References
1. UNEP, CITES, IUCN & TRAFFIC. Elephants in the dust – the African elephant crisis. A rapid response assessment. United Nations
Environment Programme, GRID-Arendal (2013).
2. Chase, M. J. et al. Continent-wide survey reveals massive decline in African savannah elephants. PeerJ 4, e2354, https://doi.
org/10.7717/peerj.2354 (2016).
3. Wittemyer, G. et al. Illegal killing for ivory drives global decline in African elephants. Proc. Natl. Acad. Sci. 111, 13117–13121,
https://doi.org/10.1073/pnas.1403984111 (2014).
4. Bouché, P. et al. Will elephants soon disappear from west African savannahs? Plos One 6, e20619, https://doi.org/10.1371/journal.
pone.0020619 (2011).
5. Maisels, F. et al. Devastating decline of forest elephants in central Africa. Plos One 8, e59469, https://doi.org/10.1371/journal.
pone.0059469 (2013).
6. CITES. Report on Monitoring the Illegal Killing of Elephants (MIKE), https://cites.org/sites/default/files/eng/cop/18/
doc/E-CoP18-069-02.pdf (2019).
7. Hauenstein, S., Kshatriya, M., Blanc, J., Dormann, C. F. & Beale, C. M. African elephant poaching rates correlate with local poverty,
national corruption and global ivory price. Nat. Commun. 10, 2242, https://doi.org/10.1038/s41467-019-09993-2 (2019).
8. Nuwer, R. How one national park is saving Chad’s elephant population from poaching. The Independent, https://www.independent.
co.uk/news/world/africa/chad-national-park-poaching-elephant-conservation-population-numbers-a8361926.html (2018).
9. Anna, C. Zero elephants poached in a year in top Africa wildlife park. AP NEWS. https://apnews.com/
ef25debd7ab74b7ca5dc3fe9692c1fa8 (2019).
10. Sosnowski, M. C., Knowles, T. G., Takahashi, T. & Rooney, N. J. Global ivory market prices since the 1989 cites ban. Biol. Conserv.
237, 392–399, https://doi.org/10.1016/j.biocon.2019.07.020 (2019).
11. Botswana, Namibia, and Zimbabwe. CoP19 Prop. 11. https://cites.org/sites/default/files/eng/cop/18/prop/19032019/E-CoP18-
Prop-11.pdf (2019).
12. Burn, R. W., Underwood, F. M. & Blanc, J. Global trends and factors associated with the illegal killing of elephants: a hierarchical
Bayesian analysis of carcass encounter data. Plos One 6, e24165, https://doi.org/10.1371/journal.pone.0024165 (2011).
13. CITES-MIKE. CITES-MIKE/MIKE-LSMEANS, https://github.com/CITES-MIKE/MIKE-LSMEANS (2019).
14. Douma, J. C. & Weedon, J. T. Analysing continuous proportions in ecology and evolution: a practical introduction to beta and
Dirichlet regression. Methods Ecol. Evol. 10, 1412–1430, https://doi.org/10.1111/2041-210X.13234 (2019).
15. Buckland, S. T., Newman, K. B., Thomas, L. & Koesters, N. B. State-space models for the dynamics of wild animal populations. Ecol.
Model. 171, 157–175, https://doi.org/10.1016/j.ecolmodel.2003.08.002 (2004).
16. Durbin, J. & Koopman, S. J. Time series analysis by state space methods: second edition. (OUP Oxford, 2012).
17. CNN. African elephant poaching has declined, but study warns they are still vulnerable. CNN, https://www.cnn.com/2019/06/06/
world/elephants-poaching-decrease-trnd/index.html (2019).
18. Stokstad, E. Elephant poaching falls dramatically in Africa. Science. https://www.sciencemag.org/news/2019/05/elephant-poaching-
falls-dramatically-africa (2019).
19. Royle, J. A. & Dorazio, R. M. Hierarchical modeling and inference in ecology: the analysis of data from populations, metapopulations
and communities. (Academic Press, 2008).
20. Poulsen, J. R. et al. Poaching empties critical central African wilderness of forest elephants. Curr. Biol. 27, R134–R135, https://doi.
org/10.1016/j.cub.2017.01.023 (2017).
21. Schlossberg, S., Chase, M. J. & Sutcliffe, R. Evidence of a growing elephant poaching problem in Botswana. Curr. Biol. 29, 2222–2228,
https://doi.org/10.1016/j.cub.2019.05.061 (2019).
22. MIKE Programme. MIKE site monitoring guidelines and procedures, Version 15.3. CITES (2015).
23. IUCN. Elephant database, http://africanelephantdatabase.org (2019).
24. Blanc, J. J. et al. African elephant status report 2007: an update from the African Elephant Database. IUCN/SSC African Elephant
Specialist Group (2007).
25. Thouless, C. R. et al. African elephant status report 2016: an update from the African Elephant Database. Occasional paper of the
IUCN Species Survival Commission no. 60 (2016).
26. Helske, J. KFAS: exponential family state space models in R. J. Stat. Softw. 78, 1–39, https://doi.org/10.18637/jss.v078.i10 (2017).
27. R Core Team. R: A language and environment for statistical computing. (R Foundation for Statistical Computing, 2017).
28. Bjornstad, O. N. NCF: spatial covariance functions, https://CRAN.R-project.org/package=ncf (2019).
29. Oranje, A. Confidence intervals for proportion estimates in complex samples. ETS Res. Rep. Ser. 2006, i–26, https://doi.
org/10.1002/j.2333-8504.2006.tb02027.x (2006).
30. Lewis, J. B. & Linzer, D. A. Estimating regression models in which the dependent variable is based on estimates. Polit. Anal. 13,
345–364, https://doi.org/10.1093/pan/mpi026 (2005).
Acknowledgements
Thanks to T. Carroll and M. Kshatriya for comments on an earlier version of the manuscript. Elephants Without
Borders thanks A. E. Wilmshurst, W. G. Williams III (The Sayers Foundation), the Thomas C. Bishop Charitable
Fund, the Molasky family, C. Stern, the Smith Family Charitable Fund, the Woodtiger Fund, the Stadler Family
Charitable Foundation, C. Parker, and V. G. Irions for their support.
Author contributions
S.S. designed and carried out the study, analyzed the data, and interpreted results. M.C. and K.G. were involved
in the study design and provided discussion and intellectual input into the manuscript. S.S. wrote the manuscript
with significant input from M.C., K.G., S.W. and K.L. All authors read, edited, and approved the final version of
the manuscript.
Competing interests
During preparation of this manuscript, authors Schlossberg, Chase, Gobush, and Lindsay worked for
organizations that engage in environmental research and advocacy. Author Wasser declares no competing
interests.
Additional information
Supplementary information is available for this paper at https://doi.org/10.1038/s41598-020-66906-w.
Correspondence and requests for materials should be addressed to S.S.
Scientific Reports | (2020) 10:10166 | https://doi.org/10.1038/s41598-020-66906-w 8www.nature.com/scientificreports/ www.nature.com/scientificreports
Reprints and permissions information is available at www.nature.com/reprints.
Publisher’s note Springer Nature remains neutral with regard to jurisdictional claims in published maps and
institutional affiliations.
Open Access This article is licensed under a Creative Commons Attribution 4.0 International
License, which permits use, sharing, adaptation, distribution and reproduction in any medium or
format, as long as you give appropriate credit to the original author(s) and the source, provide a link to the Cre-
ative Commons license, and indicate if changes were made. The images or other third party material in this
article are included in the article’s Creative Commons license, unless indicated otherwise in a credit line to the
material. If material is not included in the article’s Creative Commons license and your intended use is not per-
mitted by statutory regulation or exceeds the permitted use, you will need to obtain permission directly from the
copyright holder. To view a copy of this license, visit http://creativecommons.org/licenses/by/4.0/.
© The Author(s) 2020
Scientific Reports | (2020) 10:10166 | https://doi.org/10.1038/s41598-020-66906-w 9You can also read