DETECTION AND CLASSIFICATION OF BRIDGE CROSSING EVENTS WITH GROUND-BASED INTERFEROMETRIC RADAR DATA AND MACHINE LEARNING APPROACHES - KIT
←
→
Page content transcription
If your browser does not render page correctly, please read the page content below
ISPRS Annals of the Photogrammetry, Remote Sensing and Spatial Information Sciences, Volume V-1-2020, 2020
                                                XXIV ISPRS Congress (2020 edition)

     DETECTION AND CLASSIFICATION OF BRIDGE CROSSING EVENTS WITH
   GROUND-BASED INTERFEROMETRIC RADAR DATA AND MACHINE LEARNING
                             APPROACHES

                                                          M. Arnolda, , S. Kellerb
                                    a
                                      ci-tec GmbH, 76137 Karlsruhe, Germany - m.arnold@ci-tec.de
         b
             Institute of Photogrammetry and Remote Sensing, Karlsruhe Institute of Technology, 76131 Karlsruhe, Germany -
                                                         sina.keller@kit.edu

                                                         Commission I, WG I/3

KEY WORDS: Ground-based Interferometric Radar, Event Detection, Classification, Infrastructure Monitoring, Machine Learning,
Field Campaign, Critical Infrastructure, UAV

ABSTRACT:

In this paper, we investigate the potential of detecting and classifying vehicle crossings (events) on bridges with ground-based interfero-
metric radar (GBR) data and machine learning (ML) approaches. The GBR data and image data recorded by a unmanned aerial vehicle,
used as ground truth, have been measured during field campaigns at three bridges in Germany non-invasively. Since traffic load of the
bridges has taken place during the measurement, we have been able to monitor the bridge dynamics in terms of a vertical displacement.
We introduce a methodological approach with three steps including preprocessing of the GBR data, feature extraction and well-chosen
ML models. The impact of the preprocessing approaches as well as of the selected features on the classification results is evaluated.
In case of the distinction between event and no event, adaptive boosting with low-pass filtering achieves the best classification results.
Regarding the distinction between different class types of vehicles, random forest performs best utilising low-pass filtered GBR data.
Our results reveal the potential of the GBR data combined with the respective methodological approach to detect and to classify events
under real-world conditions. In conclusion, the preliminary results of this paper provide a basis for further improvements such as
advanced preprocessing of the GBR data to extracted additional features which then can be used as input for the ML models.

                      1. INTRODUCTION                                   following this approach to detect vehicle crossings on a bridge.
                                                                        For this purpose, we rely on a ground-based interferometric radar
Worldwide, the service life of newly constructed bridge infras-         (GBR) as a sensor recording the bridge dynamics stimulated by
tructure is designed for several decades. In Germany, the targeted      vehicles crossing the bridge. We use solely the GBR data com-
lifetime is about one hundred years. However, increasing traffic        bined with machine learning (ML) approaches to detect and clas-
frequency and vehicle loads may have a negative effect on the           sify vehicle crossings. We avoid threshold-based methods, since
structural integrity. For example, excitations due to crossing traf-    they need adjustment for each structure, preventing a generali-
fic may have higher amplitudes or may be qualitatively different        sation. To evaluate our proposed approach and its ability in the
compared to the considerations when planning the bridge. There-         context of SHM, we choose a dataset which we have recorded in
fore, a frequent monitoring is crucial for public safety.               three real-world measurement campaigns at bridges in Germany.
                                                                        Among others, an important challenge arises from the excitation
Conventional systems used for structural health monitoring              of the bridge caused by unspecified, random daily traffic. The
(SHM), e.g. strain gauges, require a permanent installation to          main contributions of this paper are:
an infrastructure such as a bridge. The installation process and a
long-term maintenance can be difficult for only remotely accessi-         • a detailed description of the measurement setup with the
ble bridges. In addition, commonly used systems are often inva-             GBR sensor monitoring three bridges,
sive meaning their installation introduces damage at the structure.       • a profound analysis of time-series data extracted from the
Furthermore, analytical approaches of SHM, such as Operational              GBR measurements to calculate the vertical displacement
Modal Analysis (OMA), investigate solely the response of the                of the bridge caused by vehicle crossings,
bridge based on, for example, the acceleration. In this case, how-        • a schematic approach including all steps starting with the
ever, the cause of the acceleration is not considered explicitly due        time-series data, preprocessing and subsequent feature ex-
to the difficulties of measuring the exact excitation. At the same          traction,
time, changes of the bridge’s behaviour and its dynamics can be           • an appropriate ML framework with eight models applied to
caused by changes of the traffic volume itself (e.g. Magalhães et          (1) detect and (2) classify vehicle crossings (events),
al., 2012). Detecting changes of a bridge’s characteristics under         • and finally a comprehensive evaluation of the proposed
dynamic conditions of traffic is an essential part of SHM. Alto-            methodological approach according to the classification per-
gether, there is a need for an innovative approach in SHM which             formance.
includes non-invasive measurements of the dynamic behaviour of
the bridge and which is able to detect and distinguish changes in       We give a short overview of related work regarding distinct ap-
the resulting data either caused by traffic or the structure itself.    proaches in bridge monitoring, event detection and vehicle clas-
                                                                        sification in Section 2. In the following section, we describe the
To achieve these objectives, a first approach is to extract vehi-       measurement setup at three different bridges with a GBR sen-
cle crossings on the bridge based on the signal data so that the        sor. Section 4 introduces the acquired GBR time-series data and
causing excitations can be defined. In this contribution, we are        describes the generation of bridge displacement data. Addition-

         This contribution has been peer-reviewed. The double-blind peer-review was conducted on the basis of the full paper.
                     https://doi.org/10.5194/isprs-annals-V-1-2020-109-2020 | © Authors 2020. CC BY 4.0 License.                       109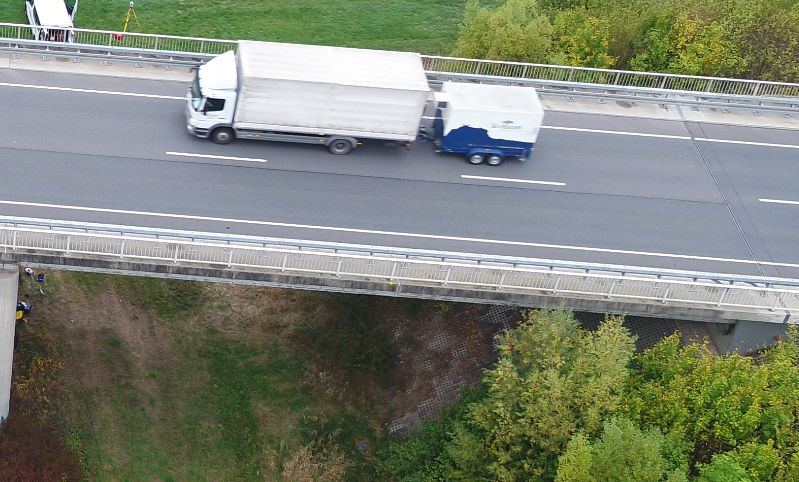
ISPRS Annals of the Photogrammetry, Remote Sensing and Spatial Information Sciences, Volume V-1-2020, 2020
XXIV ISPRS Congress (2020 edition)
ally, we present and analyse the vehicle crossing events. Sec- real-world conditions are given at all three bridges, the possibility
tion 5 contains the proposed methodological approach consisting to transfer the applied approach to further bridges is maintained.
of three steps: preprocessing, feature extraction, as well as ML The measurement setups at all monitored bridges are described
models to detect and classify vehicle crossings. The results are in Section 3.1. Subsequently, we give a brief introduction of the
presented and discussed focusing on the feature importance of GBR measurement principles (see section 3.2). A more detailed
the ML models in Section 6. Finally, we conclude our studies in explanation of the GBR measurement principles with respect to
Section 7 with a brief summary and an outlook to further research the processing of the raw data is given at Coppi et al. (2010).
topics.
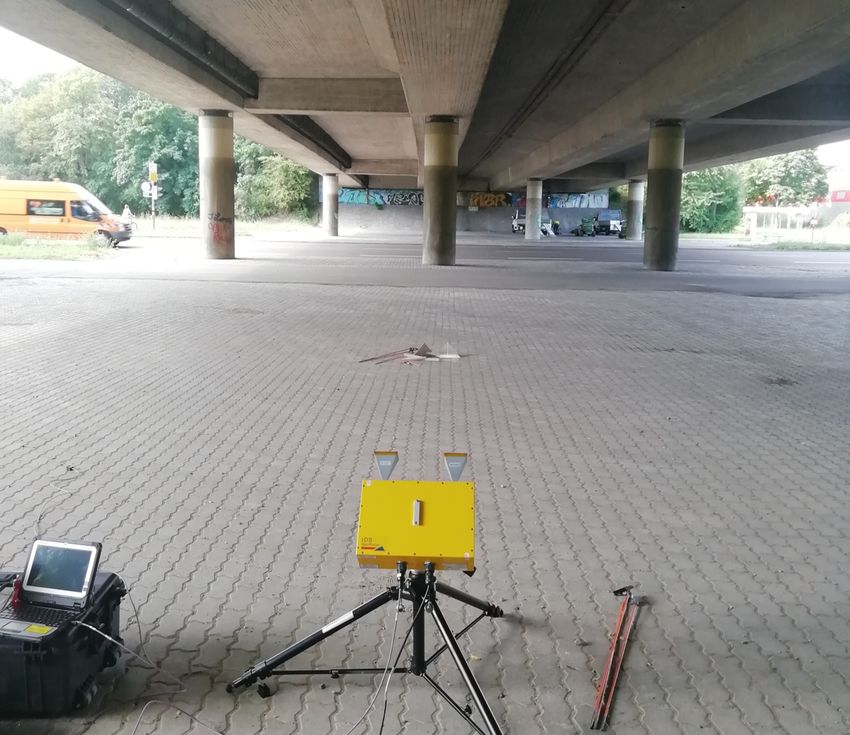
3.1 Measurements at Three Selected Bridges
2. RELATED WORK
Three selected German bridges are the centerpiece of the mea-
surement campaigns. They have been monitored over several
Alternatively to acceleration-based or strain-based monitoring of hours at different days and, thus, cover a broad variance of envi-
bridges (see e.g. Cho et al., 2010), the GBR-based measurements ronmental influences. We have equipped two of the three bridges
have gained a growing reputation in structural health monitoring with corner reflectors to gain a high signal-to-noise ratio (SNR)
(SHM). This increasing interest mainly results from its simple of the GBR data. Table 1 provides an overview of selected details
usage and the non-invasive measuring principle to recognise the of all three bridges.
vertical displacement of a bridge. Gentile and Bernardini (2010)
introduces a new microwave radar-system (IBIS-S) and compares With respect to the vehicle crossings, we can divide the bridges
its sensitivity to acceleration sensors. To increase the sensitivity into two groups. The vehicles crossing bridges A and B drive
of the GBR signal, so-called corner reflectors can be installed at a constant speed. In contrast, bridge C serves as entrance and
at the bridge. In general, the displacement sensitivity exceeds exit to the state road on top of it. Therefore, vehicles will ac-
0.02 mm depending on the underlying measurement setup. The celerate and decelerate while crossing. In our analysis, we focus
IBIS-S is used to perform static and dynamic measurements on a solely on a single field of each bridge for reasons of comparabil-
bridge near Florence, Italy in order to acquire its natural frequen- ity. Figure 1 shows the respective measurement setups at each of
cies (Pieraccini et al., 2007). Furthermore, Hsu et al. (2016) carry the three bridges from different perspectives. To explain the mea-
out a long-term monitoring of two highway bridges in Taiwan. suring principle of the GBR and to illustrate the GBR raw data,
After measuring each bridge annually and over 5 to 6 years, one we use the bridge A in the following subsections as an example.
bridge has shown a change in its natural frequencies as well as a
clear visual degradation. As an alternative measurement setup of 3.2 Measurements with the GBR
the IBIS-S, Michel and Keller (2020) proposes and evaluates the
mirror mode during measurements at a bridge in Karlsruhe, Ger- Two fundamental measurement principles are combined in the
many. This setup allows the usage of corner reflectors without the IBIS-S GBR to ensure the precise measurement of spatial dis-
need for a permanent installation of these reflectors directly at the placements: frequency modulation and interferometry. By ap-
bridge. A corner reflector is placed opposite the GBR beneath the plying frequency modulation, the GBR monitors several points
bridge reflecting the beam which is scattered from the flat surface in line of sight (LOS) which we refer to as range bins. With the
of the bridge underside back to the GBR. speed of light c = 3 × 10⁸ m s−2 and a bandwidth B = 200 MHz,
the spatial resolution ∆r is
In the context of vehicle classification, deep learning combined
with data recorded by visual sensors is commonly used (Nguyen c
∆r = = 0.75 m. (1)
et al., 2018). Further sensors applied for event detection and 2·B
classification are strain gauge sensors. For example, Zhang et
al. (2008) presents a strain-based method to classify vehicles in The LOS distance R between the GBR and each range bin equals
five different categories and estimates the speed of each vehicle. the spatial resolution times the number of the range bin. Four
The sensors have been embedded below the surface of a state of such measuring points with their corresponding numbers are
road in China. A support vector machine (SVM) is applied for highlighted in Figure 1a. The IBIS achieves an accuracy of up
the classification tasks utilising the number of axes and the speed to 0.01 mm, depending, for example, on the inclination of the
function as input features. Yan et al. (2008) exploits a principal GBR (Rödelsperger et al., 2010). To monitor a bridge, the GBR
component analysis (PCA) on strain time-series data. A bridge- is placed underneath it as shown in Figure 2. For each range bin a
deck in the USA has been equipped with 16 gauges at both the phase shift ∆φ is measured with a sampling rate of up to 200 Hz
top and the bottom side of the panel. Additionally synchronised through interferometry. This shift can be transformed to a radial
video clips have been archived in order to correlate a portion of displacement ∆R along LOS according to
the signal to its corresponding vehicle. Based on the resulting λ
PCA components, an artificial neural network (ANN) with two ∆R = · ∆φ. (2)
4π
layers is trained to classify five distinct vehicle classes. During
their measurement campaign, Rajab et al. (2014) have installed Its high sampling rate enables IBIS-S to monitor continuously
multi-element piezoelectric sensors beneath the surface of a road- and to record vibrations caused by vehicle crossings. The verti-
way in the USA. Based on this data, they extract vehicle length, cal displacement ∆z as a projection from ∆R can be deduced
axle spacing and the number of tires as features for subsequently from the height difference h between the bridge and the radar
threshold-based classification with a overall accuracy of 86.9 %. corresponding to
R
∆z = · ∆R. (3)
h
3. MEASUREMENT SETUP
To evaluate our approach for detection and classification of vehi- 4. GBR TIME-SERIES DATA
cle crossings on a bridge based on GBR measurement and ML,
we rely on a dataset which has been recorded during several mea- First, the selection of useful range bins is described in Section 4.1
surement campaigns in 2019 on three bridges in Germany. Since which are then used to illustrate time-series signals of crossing
This contribution has been peer-reviewed. The double-blind peer-review was conducted on the basis of the full paper.
https://doi.org/10.5194/isprs-annals-V-1-2020-109-2020 | © Authors 2020. CC BY 4.0 License. 110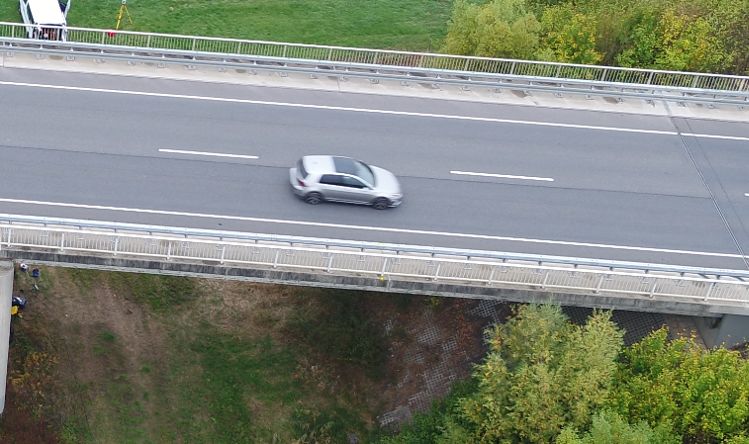
ISPRS Annals of the Photogrammetry, Remote Sensing and Spatial Information Sciences, Volume V-1-2020, 2020
                                              XXIV ISPRS Congress (2020 edition)

                                               Table 1. Overview of selected bridge details.

      Structure                     Type                      Fields          Length                                        Width           Reflectors           Lanes           Natural Freq.
      Bridge A          Beam/plate mixing system                 2             57.0 m                                  13.6 m                  Yes                   2                  3.66 Hz
      Bridge B    Plate girder bridge/Girder Grid Bridge         1             26.36 m                                 11.69 m                 Yes                   2                  3.75 Hz
      Bridge C    Plate girder bridge/Girder Grid Bridge         4            116.62 m                                 14.65 m                 No                    2                  3.42 Hz

                      (a)                                               (b)                                                                                              (c)

Figure 1. (a) View of bridge A recorded by a unmanned aerial vehicle. The rectangle marks the GBR position and its inclination.
Crosses represent points with a high SNR. (b) A side view of the measurement setup of bridge B. The GBR and two corner reflectors
are highlighted. (c) The GBR position at bridge C. No reflectors have been attached to the lower side of the bridge.

                     ΔR
                                                                                                                                                                                 615
                            Δz

              R
                                                                                 (VWLPDWHG615

                            h


Figure 2. Schema of the measuring principle of the GBR exem-

plary illustrated for bridge A. R is the distance in LOS between
each range bin and the GBR, h the height difference between                                                                                   5DQJH%LQ1XPEHU
the GBR and the lower side of the bridge. ∆R represents the
measured displacement in LOS and ∆z is the respective vertical
projection.                                                                   Figure 3. SNR values of all range bins. The highlighted range
                                                                              bins 19, 21, 22 and 24 are characterised by high SNR.

events in Section 4.2. We refer to crossing events as vehicle cross-          4.2                             Time-Series Signals of Events
ings of the bridge. Second, we will define classes to distinguish
between events (see Section 4.3).                                             The local maximum displacement at a specific point (see Fig-
                                                                              ure 4, second row) on the bridge depends on several parameters
                                                                              such as the weight of the vehicle and the driving direction. Bridge
4.1   Range Bin Selection                                                     crossings of different vehicle types such as trucks or cars result
                                                                              in distinct time-series signals of the measured displacements as
In time-series analysis, it is essential to have a signal with a high         illustrated in Figure 4. When analysing the time-series signals
SNR meaning a powerful signal. In the context of GBR mea-                     and the corresponding events on the bridge, we suggest that (a)
surements, range bins with a high SNR correspond to parts of                  the relative vehicle weights can be approximated based on the
the bridge with high backscattering. We can generate high reflec-             maximum displacement for each vehicle and (b) the bridge site,
tivity artificially by installing corner reflectors to the underside          on which the vehicle is driving, can be estimated as the relative
of a bridge. This has been performed at bridge A and bridge B.                maximum displacement of each range bin within one event. We
As illustrated in Figure 3, high peaks indicate data samples with             have to distinguish two cases: In case of a single event, i.e. be-
a higher SNR which are used for further analysis. The marked                  tween the entering time and exiting time only one vehicle is on
range bins of Figure 1a correspond to measuring points with a                 a bridge, the driving direction can be deduced from the driving
high SNR in Figure 3. We select these four range bins for further             site. However, at several bridges we observe multi-events, some-
time-domain analysis.                                                         times in the form of overtaking manoeuvres. For multi-events

          This contribution has been peer-reviewed. The double-blind peer-review was conducted on the basis of the full paper.
                      https://doi.org/10.5194/isprs-annals-V-1-2020-109-2020 | © Authors 2020. CC BY 4.0 License.                                                                                   111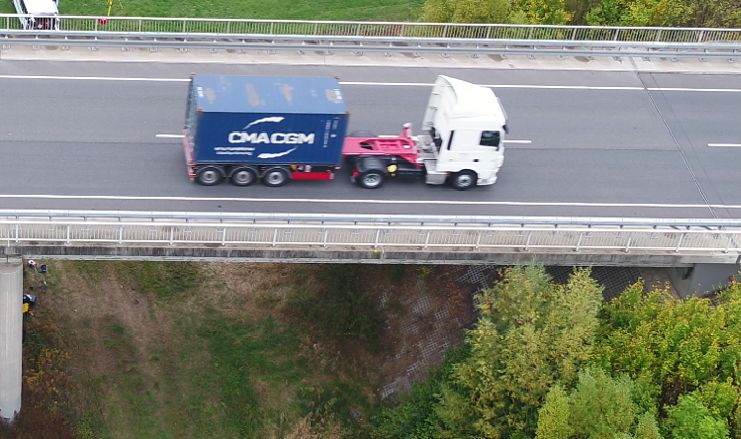
ISPRS Annals of the Photogrammetry, Remote Sensing and Spatial Information Sciences, Volume V-1-2020, 2020
XXIV ISPRS Congress (2020 edition)
9HUWLFDO'LVSODFHPHQW>PP@
9HUWLFDO'LVSODFHPHQW>PP@
9HUWLFDO'LVSODFHPHQW>PP@
5DQJH%LQ
5DQJH%LQ
5DQJH%LQ
5DQJH%LQ 5DQJH%LQ 5DQJH%LQ
5DQJH%LQ 5DQJH%LQ 5DQJH%LQ
5DQJH%LQ 5DQJH%LQ 5DQJH%LQ
7LPH>V@ 7LPH>V@ 7LPH>V@
(a) (b) (c)
Figure 4. Different events on bridge A with their resulting time-series signals of the measured displacements. First row: UAV-images
of vehicles crossing the bridge. Second row: the corresponding displacement time-series.
the driving direction is more challenging to detect. It is neces-
sary to understand which vehicles are on the bridge and which
type generated the corresponding signal measured by the GBR.
9HUWLFDO'LVSODFHPHQW>PP@
To establish ground truth concerning the types of vehicles on the
bridge, we have used an unmanned aerial vehicle (UAV) to mon-
itor the surface of the bridge. The UAV was employed in mea-
surement campaigns at the bridges A and B. After some vehicles
exit the bridge, an undisturbed swing-out process can follow (see
Figure 4(b) and Figure 4(c)). Note that an event is defined as
solely the crossing of each vehicle without the respective swing-
out process. In sum, the time between the entering and the exit
of a vehicle is regarded. This study focuses on the events, but as
a byproduct the characteristic natural frequencies of bridges can
easily be extracted from a swing-out process with a fast Fourier
5DQJH%LQ
transform (FFT). For each bridge we extracted the first natural
frequency, as shown in Table 1. 7LPH>V@
Figure 5 shows the vertical displacement from the selected range
bin 21 as a time series recorded for approximately 2.7 h. In gen- Figure 5. The vertical displacement of the selected range bin 12
eral, the vertical displacement in the time series of range bins is as a time series over about 10 000 s. The occurring peaks in the
characterised by a drift in a non-linear manner over time (see e.g. time series correspond to different events. The time-series data
Figure 5). Similar to all electronic devices, the GBR is influenced has been low-pass filtered (see Section 5.1).
by environmental parameters of the measurement surroundings
such as temperature, relative humidity and air pressure. How-
shows three distinct event classes. Class 1 contains for example
ever, these parameters affect the GBR device on the one hand
cars, class 2 contains vehicles such as small trucks and class 3
and the GBR signal during the transmission on the other hand.
contains trucks. We have evaluated these three classes based on
Furthermore, the bridge is also affected by the dynamics of the
high-resolution UAV data. Note that the defined classes do not
environmental parameters. For example, the bridge expands un-
correspond to official vehicle types. For a preliminary classifica-
der rising temperature which leads to a slow horizontal movement
tion presented in this study, we rely on the three classes defined
of the corner reflectors. It is challenging to account for all these
above.
parameters without interfering with signal components necessary
to detect events within the time-series data. A description of our
applied preprocessing follows in Section 5.1.
4.3 Class Extraction 5. METHODOLOGY
To define potential classes of events, respectively vehicle cross-
ings on the bridge, we analyse the duration of different events Our proposed methodological approach consists of three steps:
vs. the maximal vertical displacement (see Figure 6). The event the different preprocessing approaches, the feature extraction and
duration depends on the speed of each vehicle, but the bridge the ML models to classify the events. Figure 7 provides the
is usually crossed with approximately constant pace. Figure 6 schema of the three applied steps.
This contribution has been peer-reviewed. The double-blind peer-review was conducted on the basis of the full paper.
https://doi.org/10.5194/isprs-annals-V-1-2020-109-2020 | © Authors 2020. CC BY 4.0 License. 112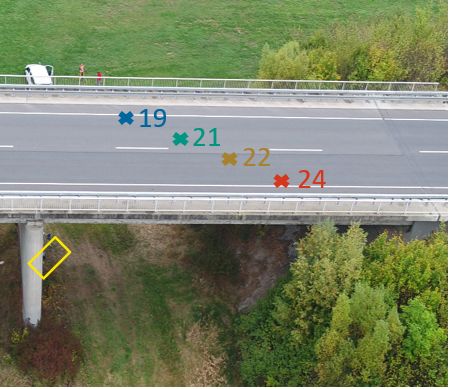
ISPRS Annals of the Photogrammetry, Remote Sensing and Spatial Information Sciences, Volume V-1-2020, 2020
                                                                                     XXIV ISPRS Congress (2020 edition)


      (YHQW'XUDWLRQ>V@


                                                                                                                    &ODVV
                                                                                                                  &ODVV
                                                                                                                    &ODVV

                                                            0D[LPXP'LVSODFHPHQW>PP@

Figure 6. Scatterplot of the maximal vertical displacement vs. the
event duration. The three classes can be distinguished.

5.1   Preprocessing

The GBR monitors a bridge dynamically with a sampling fre-
quency of up to 200 Hz. However, most significant signal com-
ponents of bridges are to be expected in a lower frequency range
(Mehlhorn and Curbach, 2014). Therefore, low-pass filtering is a
useful preprocesssing step to suppress high-frequency noise. We
apply a Butterworth filter (Bianchi and Sorrentino, 2007) with
two different settings which we refer to a LP1 and LP2. The dis-                                                                                 Figure 7. Schema of the methodological approach.
tinction between LP1 and LP2 is that the latter has a higher degree
of filtering than LP1. The raw GBR data without any filtering is
defined as baseline.                                                                                                                      Table 2. Number of labelled events per bridge and class. The
                                                                                                                                          labelling of the data of Bridge A and B has been done primarily
We analyse different approaches for preprocessing (see Figure 7:
                                                                                                                                          by monitoring the bridge surface via UAV. The labels of Bridge
None, LP1, LP2). In the test phase of the ML models we com-
                                                                                                                                          C have been created manually.
pare the results of the classification based on features extracted
from the three preprocessing approaches. Note that no scaling
has been applied on the time series and the features in order to                                                                                      Class 1         Class 2          Class 3     Class 4
                                                                                                                                           Bridge
avoid misclassification of events including heavy vehicles.                                                                                          e.g. cars   e.g. small trucks   e.g. trucks   no event
                                                                                                                                           A             447            114              32          534
5.2   Feature Extraction
                                                                                                                                           B             152             40               7          100
Table 2 shows the number of labelled data samples according to                                                                             C              43             17              10           50
each bridge and event class as illustrated in Figure 6. The event
duration is not constant. Since the further steps of our method-                                                                          Table 3. Seven features extracted from the GBR time-series data.
ological approach require features extracted from time-series data                                                                        x represents one data sample of 0.5 s.
of equal length, all events are split into multiple time series of a
length of 0.5 s. For each bridge, we consider only the range bin                                                                           Feature No.     Name of Feature                 Formula
with the highest SNR. As a result, the complete dataset consists
of 4490 time-series samples of 0.5 s for each preprocessing ap-                                                                                  1         Maximum                 max(x − mean(x))
proach. In addition to real events, we include time-series samples                                                                               2         Minimum                  min(x − mean(x))
                                                                                                                                                                                      |x − mean(x)|2
                                                                                                                                                                                    P
with no event on the bridges to the current dataset (Class 4). We                                                                                3         Energy                p
do not balance our data since it is not possible without heavily re-                                                                             4         Variance                mean((x − mean(x))2 )
ducing the dataset considering there are only few Class 3 events.                                                                                5         Standard Deviation     mean((x − mean(x))2 )
For comparability, we also omit balancing for the event detection                                                                                6         Skewness               mean((x − mean(x))3 )
task.                                                                                                                                            7         Kurtosis               mean((x − mean(x))4 )

Seven features are extracted from each time-series sample. We
use common statistical and signal processing values such as the                                                                           In Table 3, the extracted features as well as their corresponding
variance and the signal energy. Since the displacement signal of                                                                          formulas are summarised.
the GBR has a baseline drift caused by environmental parameters
(see Section 4.2), we have excluded features such as the mean                                                                             5.3   Machine Learning Models
value which are sensitive to this drift. Where meaningful, e.g.
Maximum, Minimum and Energy, the influence of the mean value                                                                              In the last step (see Figure 7), we select eight ML models (1) to
was eliminated. All the features are extracted directly from the                                                                          distinguish between event and no event and (2) to detect events
time series (time domain) without performing a modal analysis.                                                                            and classify these events according to four proposed class types.

                                             This contribution has been peer-reviewed. The double-blind peer-review was conducted on the basis of the full paper.
                                                         https://doi.org/10.5194/isprs-annals-V-1-2020-109-2020 | © Authors 2020. CC BY 4.0 License.                                                   113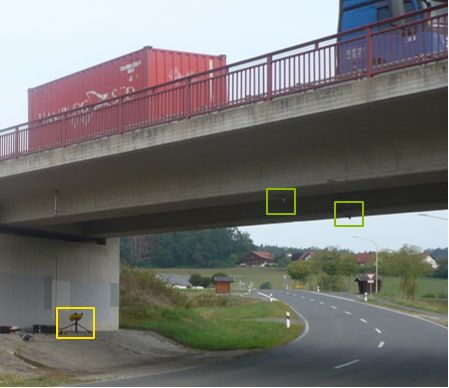
ISPRS Annals of the Photogrammetry, Remote Sensing and Spatial Information Sciences, Volume V-1-2020, 2020
                                              XXIV ISPRS Congress (2020 edition)

Table 4. Overview of the results of event vs. no event classification for the ML models under consideration. The classification
performance is expressed by the overall accuracy (OA), precision (P) and recall (RC). The highlighted figures represent the best
classification results for each preprocessing approach.

                                          Baseline                    LP1                          LP2
                        Model       OA       P        RC       OA       P       RC        OA         P        RC
                                   in %    in %      in %     in %    in %     in %      in %      in %      in %
                        KNN        77.5    67.7      54.8    77.4     66.9     61.2     79.1      67.3      62.9
                        ET         80.6    67.6      66.0    70.0     64.7     18.7     76.9      72.5      37.8
                        SVM        72.4    67.0      24.4    59.2     36.5     33.0     76.6      75.4      72.7
                        SOM        56.9    35.9      47.0    55.6     35.5     43.9     57.8      37.8      61.5
                        RF         78.6    67.7      61.1    82.2     75.8     67.0     83.2      72.9      72.6
                        ANN        78.6    69.9      56.5    80.0     73.2     60.2     83.6      74.0      72.7
                        AB         78.2    67.7      59.4    81.6     74.9     66.0     83.8      74.0      71.6
                        GB         77.2    67.6      53.0    81.3     75.4     63.6     81.3      74.8      59.7

We apply the following ML-Models for the classification task: k-      The classification results of the class type classification are simi-
nearest-neighbours1 (KNN), extremely randomised trees1 (ET),          lar to the results of the event vs. no event classification. For LP1
support vector machines1 (SVM), self-organising maps2 (SOM),          vs. LP2 half of the ML models achieve higher OA with the LP2
random forest1 (RF), artificial neural-network1 (ANN), adaptive       preprocessing approach (see Table 5). As the class type classifi-
boosting1 (AB) and gradient boosting1 (GB).                           cation is a more sophisticated task than the distinction between
                                                                      event and no event, high-frequency noise has a more negative
Before the training the complete dataset is randomly split into a     effect on the classification performance (see Table 5, Baseline
training subset and test subset in the ration 80:20. All selected     columns). ANN trained on the LP2-filtered data has the highest
ML models are trained on the training subset using the extracted      OA of 77.5 %. With the LP1 filtered data, AB classifies the class
features as input and the class labels as target label. The hyper-    types best. Although with LP1 RF is the best ML classifier for
parameters for each model are found using grid search. Note that      the event vs. no event classification, it performs poorly in the task
only the SOM performs the training phase unsupervised while all       of distinguishing several vehicle classes based on the same data.
other models are supervised learners. For details on the SOM          Since the difference in OA between LP1 and LP2 event detection
specifications see Riese et al. (2019).                               for RF and AB is only small, we will use LP1 in the remainder in
                                                                      order to avoid suppressing potential significant bridge deforma-
During the subsequent test phase, the trained classification mod-     tions.
els classify (1) the events meaning event vs. no event as well
as (2) the four classes based on the extracted features of the test   Figure 8 shows the relative feature importance of the input fea-
subset. The predicted classes are compared to the labelled val-       tures (see Table 3) of the LP1 preprocessing approach provided
ues. The classification performance is expressed by the overall       by the ensemble models, RF and AB. We select these two ML
accuracy (OA), precision (P) and recall (RC). Ensemble models         models since RF is the best ML model to detect events with LP1
such as ET and AB provide the feature importance of the input         preprocessing and AB is the best ML model to classify class types
features as further information of the classification task.           with the LP1 preprocessing. As for the differences in the classifi-
                                                                      cation performance of RF and AB, the latter has a balanced classi-
                                                                      fication performance for the two underlying tasks, while RF has a
               6. RESULTS AND DISCUSSION                              significant lower OA for LP1 class type classification. When only
                                                                      focusing on the features which are important for both classifica-
The main objective of this study is to evaluate the potential of      tion tasks, RF priors the features energy, variance and standard
ML models to detect and classify events based on GBR data from        deviation in this order. However, AB either omits all three fea-
bridge monitoring. Such events are, for example, vehicle cross-       tures or rates them low. Especially the relative weighting of the
ings on the bridge.                                                   variance shows strong deviations within both models. This find-
                                                                      ing suggests that the feature variance can be useful as an indicator
Table 4 shows the results for the event vs. no event classifica-      for event detection (event vs. no event) but it can be omitted for
tion task of the selected ML models and the three preprocessing       the decision of the class type. We can observe, that the feature
approaches. When comparing the baseline, i.e. no applied pre-         kurtosis is dropped by RF completely as for AB, it is an impor-
processing and hence more high frequency noise, to the LP1 and        tant feature for the class type classification.
LP2 filtered preprocessing approach, we obtain a better classi-
fication performance in terms of OA. By applying the two low-         In sum, the classification performance of the ML models is sat-
pass filters as preprocessing, the eight ML models perform differ-    isfying. The best classification performance independent of the
ently. Within the ensemble methods, ET, for example, achieves         classification tasks is an OA of 83.8 %. We state that for any clas-
the highest OA for the unfiltered input data. The filtered input      sification improvement, the selection of the class types depending
data leads to a lower OA. In contrast, RF performs the best with      on the vehicles needs to be enhanced. In addition, we cannot cre-
the most filtered input data (OA of 83.2 %) as well as AB with an     ate further features out of the GBR data due to the included drift.
OA of 83.8 %. With focus on P and RC, both measures are low           Thus, we need to apply advanced preprocessing approaches to
despite OAs over 70 %. The reasons for this is the unbalanced         eliminate this drift and to extract more potential features. Also
input data (see Section 5.2).                                         note that the impact of further features in the ML classification
                                                                      tasks needs to be evaluated with respect to each model. To al-
  1 scikit-learn                                                      low for an unknown weight range, we have omitted data scaling
  2 Implementation   from Riese (2019)                                which can be another factor influencing the prediction accuracy

          This contribution has been peer-reviewed. The double-blind peer-review was conducted on the basis of the full paper.
                      https://doi.org/10.5194/isprs-annals-V-1-2020-109-2020 | © Authors 2020. CC BY 4.0 License.                      114
ISPRS Annals of the Photogrammetry, Remote Sensing and Spatial Information Sciences, Volume V-1-2020, 2020
XXIV ISPRS Congress (2020 edition)
Table 5. Overview of the results of the class type classification for the ML models under consideration. The classification performance
is expressed by the overall accuracy (OA), precision (P) and recall (RC). The highlighted figures represent the best classification results
for each preprocessing approach.
Baseline LP1 LP2
Model OA P RC OA P RC OA P RC
in % in % in % in % in % in % in % in % in %
KNN 65.5 66.0 65.5 68.0 68.0 68.0 67.8 68.0 67.8
ET 69.4 70.3 69.4 70.2 71.6 70.2 68.4 69.9 68.4
SVM 64.1 66.2 64.1 61.3 67.6 61.4 67.5 68.9 67.5
SOM 45.0 51.8 45.0 44.8 47.7 44.8 45.4 49.0 45.4
RF 57.8 38.7 57.8 60.1 40.2 60.1 67.5 62.6 67.5
ANN 70.8 66.2 64.1 70.1 71.2 71.0 72.5 73.5 72.5
AB 71.7 72.3 71.7 71.0 70.6 71.0 69.7 71.2 69.7
GB 69.6 69.9 69.5 68.5 67.8 68.5 68.2 67.8 68.2
5)(YHQW $%(YHQW 5)&ODVV7\SH $%&ODVV7\SH
)HDWXUH,PSRUWDQFH
)HDWXUH,PSRUWDQFH
)HDWXUH )HDWXUH )HDWXUH )HDWXUH
Figure 8. Feature importance of RF and AB with the LP1 approach for both classification tasks, event vs. no event and class type
classification. The feature numbers correspond to Table 3.
(see Section 5.1). Obviously, the classification performance de- 7. CONCLUSION
pends highly on the selected time-series data. For example, we
may miss the start of an event, if the impact of the increased bend- In this paper, we address the challenge of detecting vehicle cross-
ing of the bridge is too small to be detected in the respective win- ings, which we refer to as events, and their classification based on
dow. To avoid these kind of misclassifications, we plan to use GBR data using ML. In contrast to widely used event detection
overlapping windows in further studies. approaches, which exploit acceleration sensors or strain gauge
data, we extract the bridge displacement directly from GBR time-
series data avoiding any threshold-based approaches. The GBR
time-series data has been recorded during real-world measure-
ments at three bridges in Germany with random daily traffic. As
To summarise and visualise our results, we apply the two ML ground-truth data for the vehicle types we have used UAV data
models performing the best with LP1 preprocessing on the event of the vehicles that have been on the respective bridge during the
detection task (RF and AB) to classify a time series which is pre- measurement. Our main objective is to investigate the potential of
viously unknown by these two models. We then combine these GBR data for (1) detecting events and (2) classifying time-series
two models in a voting classifier implementing soft voting to de- excerpts according to four class types of vehicles.
tect events (see Figure 9). By employing data of an unknown
range bin with a different GBR position, we demonstrate the po- To solve these classification tasks, we introduce a methodologi-
tential of the combination of ML approaches and GBR data to cal approach involving an optional preprocessing step with low-
generalise in case of a event vs. no event classification. As Sec- pass filtering and eight ML models. The classification results of
tion 4.2 shows, all events of this 350 s time-series section are both cases reveal the high potential of data-driven models and the
classified and labelled. Bridges are dynamic infrastructure ob- exploited GBR input data at varying measurement conditions at
jects and vehicle crossings stimulate their oscillation. Hence, we the three bridges. Furthermore, the performance of the method-
have to deal with swing-out processes which are characterised ological approach is satisfying with respect to the limited size
partly by high amplitudes. As the classification of the events in of (ground-truth) data and without providing any prior domain-
general and the feature extraction is based on, for example, ratios knowledge. Except for the low-pass filtering, no further prepro-
between high amplitudes, the swing-out processes are challeng- cessing of the GBR data has been applied. Thus, the mentioned
ing. At several occasions noise is falsely detected as an event, drift in the GBR time-series data, caused, among others, by en-
mirroring the precision of around 75.8 % and 74.9 % for RF and vironmental influences during the measurements, has not been
AB. excluded in this preliminary study.
This contribution has been peer-reviewed. The double-blind peer-review was conducted on the basis of the full paper.
https://doi.org/10.5194/isprs-annals-V-1-2020-109-2020 | © Authors 2020. CC BY 4.0 License. 115ISPRS Annals of the Photogrammetry, Remote Sensing and Spatial Information Sciences, Volume V-1-2020, 2020
XXIV ISPRS Congress (2020 edition)
References
Bianchi, G. and Sorrentino, R., 2007. Electronic Filter Simula-
tion & Design. McGraw-Hill Education.
9HUWLFDO'LVSODFHPHQW>PP@
Cho, S., Jo, H., Jang, S., Park, J., Jung, H.-J., Yun, C.-B.,
Spencer Jr, B. F. and Seo, J.-W., 2010. Structural health mon-
itoring of a cable-stayed bridge using wireless smart sensor
technology: data analyses. Smart Structures and Systems 6(5-
6), pp. 461–480.
Coppi, F., Gentile, C. and Paolo Ricci, P., 2010. A software tool
for processing the displacement time series extracted from raw
1R(YHQW radar data. In: AIP Conference Proceedings, Vol. 1253num-
(YHQW ber 1, AIP, pp. 190–201.
Gentile, C. and Bernardini, G., 2010. An interferometric radar
7LPH>V@
for non-contact measurement of deflections on civil engineer-
ing structures: laboratory and full-scale tests. Structure and
Figure 9. The vertical displacement of an unknown range bin Infrastructure Engineering 6(5), pp. 521–534.
at Bridge A and a different GBR position at this bridge as a time
series over about 350 s. The event classification is shown as result Hsu, K., Cheng, C. and Chiang, C., 2016. Long-term monitoring
of two highway bridges using microwave interferometer-case
of the voting classifier (RF and AB).
studies. In: 2016 16th International Conference on Ground
Penetrating Radar (GPR), IEEE, pp. 1–5.
When focusing on the monitoring of the bridge dynamics under Magalhães, F., Cunha, A. and Caetano, E., 2012. Vibration based
structural health monitoring of an arch bridge: from automated
load, the application of GBR sensors provide a non-invasive and
oma to damage detection. Mechanical Systems and Signal Pro-
remote alternative to sensors which have to be directly installed
cessing 28, pp. 212–228.
on the bridge or even in the bridge structure. Therefore, GBR
sensors can contribute to structural health monitoring in combi- Mehlhorn, G. and Curbach, M., 2014. Handbuch Brücken.
nation with appropriate methodological approaches. Springer.
Michel, C. and Keller, S., 2020. Introducing a non-invasive mon-
To evaluate the generalisation abilities of the proposed approach, itoring approach for bridge infrastructure with ground-based
we apply a voting classifier (RF and AB) on time-series data of interferometric radar. Accepted.
an so far unknown range bin from data of another GBR sensor at
Bridge A. Aiming at distinguishing between event and no event, Nguyen, H., Kieu, L.-M., Wen, T. and Cai, C., 2018. Deep learn-
the classification results are satisfying in general. Although, in ing methods in transportation domain: a review. IET Intelligent
some cases, noise is misclassified as an event, the events are all Transport Systems 12(9), pp. 998–1004.
detected properly.
Pieraccini, M., Parrini, F., Fratini, M., Atzeni, C., Spinelli, P. and
Micheloni, M., 2007. Static and dynamic testing of bridges
The results of this first study are very promising. As a direct through microwave interferometry. Ndt & E International
consequence, we will further improve the ML-based approaches 40(3), pp. 208–214.
in order to remove the baseline drift. With respect to the class
type classification of different vehicles, we will then be able to Rajab, S. A., Mayeli, A. and Refai, H. H., 2014. Vehicle clas-
sification and accurate speed calculation using multi-element
extract additional features from the time-series GBR data. Then,
piezoelectric sensor. In: 2014 IEEE Intelligent Vehicles Sym-
we can evaluate the impact of these features on the classification posium Proceedings, IEEE, pp. 894–899.
performance due to avoiding misclassifications caused by long-
term drifts. Furthermore, we consider to include a new class Riese, F. M., 2019. SuSi: SUpervised Self-organIzing maps in
which covers the swing-out processes. To evaluate the generali- Python. doi.org/10.5281/zenodo.2609130.
sation abilities in detail, we will expand the dataset in upcoming
measurement campaigns. Additionally, we will exploit further Riese, F. M., Keller, S. and Hinz, S., 2019. Supervised and semi-
range bins of each bridge. Finally, to overcome the limited size supervised self-organizing maps for regression and classifica-
of labelled data, extended UAV flights simultaneously to the GBR tion focusing on hyperspectral data. Remote Sensing.
measurements are planned. As the dataset size is increased, ad- Rödelsperger, S., Läufer, G., Gerstenecker, C. and Becker, M.,
vanced ML approaches such as convolutional neural network can 2010. Monitoring of displacements with ground-based mi-
be applied and evaluated. crowave interferometry: Ibis-s and ibis-l. Journal of Applied
Geodesy 4(1), pp. 41–54.
Yan, L., Fraser, M., Elgamal, A., Fountain, T. and Oliver, K.,
ACKNOWLEDGEMENTS 2008. Neural networks and principal components analysis for
strain-based vehicle classification. Journal of Computing in
Civil Engineering 22(2), pp. 123–132.
This research study is part of the ZEBBRA project, which is
funded by the German Federal Ministry of Education and Re- Zhang, W., Wang, Q. and Suo, C., 2008. A novel vehicle classi-
search (BMBF). We especially thank our partners, the Institute fication using embedded strain gauge sensors. Sensors 8(11),
for Automation and Applied Informatics at the Karlsruhe Insti- pp. 6952–6971.
tute of Technology and the company Büro für Strukturmechanik,
Coburg, for their support during the measurement campaigns.
This contribution has been peer-reviewed. The double-blind peer-review was conducted on the basis of the full paper.
https://doi.org/10.5194/isprs-annals-V-1-2020-109-2020 | © Authors 2020. CC BY 4.0 License. 116You can also read