Data-to-Text Generation Improves Decision-Making Under Uncertainty - Core
←
→
Page content transcription
If your browser does not render page correctly, please read the page content below
Data-to-Text Generation Improves Decision-Making
                                         Under Uncertainty
Dimitra Gkatzia, Department of Computing, Edinburgh Napier University, Edinburgh, UK
Oliver Lemon, Department of Computer Science, Heriot-Watt University, Edinburgh, UK
Verena Rieser, Department of Computer Science, Heriot-Watt University, Edinburgh, UK

                                                           Abstract

         Decision-making is often dependent on uncertain data, e.g. data associated with confidence scores or
    probabilities. This article presents a comparison of different information presentations for uncertain data and, for the
    first time, measures their effects on human decision-making, in the domain of weather forecast generation. We use
    a game-based setup to evaluate the different systems. We show that the use of Natural Language Generation (NLG)
    enhances decision-making under uncertainty, compared to state-of-the-art graphical-based representation methods.
    In a task-based study with 442 adults, we found that presentations using NLG led to 24% better decision-making on
    average than the graphical presentations, and to 44% better decision-making when NLG is combined with graphics.
    We also show that women achieve significantly better results when presented with NLG output (an 87% increase
    on average compared to graphical presentations). Finally, we present a further analysis of demographic data and
    its impact on decision-making, and we discuss implications for future NLG systems.

                                                    I. I NTRODUCTION

  Natural Language Generation (NLG) technology can achieve comparable results to commonly used
data visualization techniques for supporting accurate human decision-making [1]. Current data-to-text
systems assume that the underlying data is precise and correct – an assumption which is heavily criticized
by other disciplines concerned with decision support, such as medicine [2], environmental modelling [3],
climate change [4], or weather forecasting [5]. In this paper, we investigate whether NLG technology can
be used to support decision-making when the underlying data is uncertain. However, simply presenting
numerical expressions of risk and uncertainty is not enough. Psychological studies on decision-making
have found that a high percentage of people do not understand and cannot act upon numerical uncertainty

 Corresponding Author: Dimitra Gkatzia (Email: D.Gkatzia@napier.ac.uk)
[6], [7]. For example, about 30% of participants in a German-American study were unable to correctly
answer the question:
Which of the following numbers represents the biggest risk of getting a disease: 1 in 100, 1 in
1000, 1 in 10?” [7].
The novelty of this paper is that unlike previous work, we investigate the potential of NLG to
automatically produce textual descriptions of uncertainty in order to support decision-making and help
with the numeracy problem. The generation task is defined as follows: the input to the data-to-text system
is uncertain data – specifically weather data associated with probabilities – and the output is weather
forecasts in Natural Language (NL) which express the uncertain nature of weather linguistically. This
article extends our previous work [8] in the following ways: We provide a more extensive discussion of
related work and clarify our unique contribution. In addition, we report more detail on the experimental
setup of the study, as well as the implementation of the WeatherGame. We report and discuss results
in more depths, including detailed results of statistical analyses. Furthermore, this article includes new
material, analysing demographic factors and their influence on the performance of NLG strategies.
The main contributions to the field are as follows:
• We study a principled mapping of uncertainty to NL and provide recommendations and data [9] for
future data-to-text systems;
• We introduce a game-based data collection environment which extends task-based evaluation by
measuring the impact of NLG on decision-making (measuring user confidence and game/task success);
• We show that effects of the different representations vary for different user groups, which suggests
that user adaptation is necessary when generating multi-modal presentations of uncertain information.
The rest of the article is organized as follows. Section II reviews existing approaches to conveying
uncertainty in data-to-text systems. Section III describes how the generation task is formulated and Section
IV briefly describes the game-based setup used for data collection. Section V describes the data-to-text
strategies we use for describing uncertainty. Section VI presents the evaluation setup and an overview of
the collected data emphasizing the demographics of the population, followed by the results (Section VII).
Finally, Section VIII discusses implications for multi-modal systems and potential directions for future
work.II. R ELATED W ORK The work presented in this article relates to two research fields: NLG and Linguistic Description of Data (LDD) using Soft Computing. We review related work in these areas below. A. Natural Language Generation A common task for NLG is to summarize time-series data (i.e. data with changing values over time), commonly known as data-to-text generation [10]. This paper focuses on the summarization of uncertain time-series data in the context of decision support systems. We use automatic weather forecast generation as an exemplar task, since weather data is associated with probabilities (e.g. 30% chance of rain) and therefore it is considered uncertain. Weather forecast generation is a common topic within the NLG community, e.g. [11], [12], [13], [14]. Previous approaches to data-to-text generation in the weather domain have not focused on how to communicate uncertain information, and neither have they looked into the best ways of referring to probabilities of meteorological phenomena to occur. In addition, NLG evaluation is usually based on user ratings of, e.g. grammatically, semantic correctness, fluency, and coherence, or via post-edit evaluation. Although these metrics are commonly used for evaluating the quality of the generated text, they cannot measure the effect that they have on people’s comprehension of uncertainty and on the decisions they will take. Decision support systems (especially commercial tools, such as energy consumption websites) tradi- tionally use graphical representations to visualize data and associated uncertainty. However, there is recent evidence that NL text, and NLG in particular, can have a positive effect on human decision-making [1], [8], [15]. Data-to-text systems have been successfully used for decision support, including weather forecasts [16], [17], medical care [1], [18], student feedback [19] and nature conservation [20]. Unlike traditional concept-to-text generation which typically generates texts from underlying semantic representations, data- to-text generation takes as input real-world observations and automatically generates descriptions in NL [10]. So far, most data-to-text systems assume that the underlying data is precise and correct with some notable exceptions: Gatt and Portet [21] present a framework for quantifying and communicating temporal uncertainty and show an implementation for different languages. They find that there are differences on how different languages (English, French, and Maltese) use propositions to indicate uncertainty, e.g. using “may
have/definitely/certainly” to indicate the likelihood whether an event has occurred. For generation, they
train a predictive model to select expressions to convey uncertainty based on human data.
  Power and Williams [22] present recent work on automatically translating numbers into NL expressions,
using a constraint-based framework for verbalizing numbers (proportions) at different levels of precision.
Chaganty and Liang [23] investigate how to give numbers more meaning by setting them into perspective,
e.g. 30 minutes can be described as “time taken for lunch”.
  Gkatzia et al. [24] propose an approach to handling unknown first-time users in the context of automatic
report generation from time-series data in the health domain. For this task, the uncertain factor is the
users and their preferences to which the output needs to be adapted. To solve the issue, they proposed
a framework which initially clusters existing users of a system according to their preferences, then they
model the preferences of each user cluster as an objective function and finally multi-objective optimisation
is used in order to simultaneously optimise for the preferences of each user cluster. Considering that a
first-time user would belong to any of the existing user clusters, the output is optimised for this user. In
contrast, in order to address two known user groups with competing preferences, such as lecturers and
students in the domain of feedback generation a different approach was followed by Gkatzia et al. [25].
Principal Component Regression analysis was used in order to identify the most important preferences
of each group and then they were included in a single objective function which was optimised using
Reinforcement Learning.
  Van Deemter [26] proposes a game-theoretic model for choosing vague expressions with the highest
“utility”. A recent study on vague referring expressions [27] shows that contextually appropriate
approximations can significantly reduce cognitive load and increase task efficiency. Finally, Gkatzia [28]
presents a comprehensive review on content selection methods for data-to-text systems.

B. Linguistic Description of Data using Soft Computing

  Soft Computing is a sub-area of Artificial Intelligence which investigates methodologies and approaches
which aim to cope with uncertainties such as imprecisions and missing data [29]. Several studies in this
area investigate the linguistic description of data (LDD):
  Herrera et al. [30] describe a “Computing with Words” approach to expressing and summarizing input
data using (deliberately) vague NL expressions, such as “small”, “big” and “tomorrow will be cloudy but
not very cold”. Ramos-Soto et al. [31] describe an approach to short weather forecast generation using
a combination of fuzzy sets and NLG approaches. Conde-Clemente et al. [32] also present an approach
which combines soft computing with NLG in the domain of decision support for energy saving at home.
Alonso et al. [33] describe an approach to LDD in the context of medical support systems using fuzzy
modelling. Finally, Marin and Sanchez [34] present a comprehensive literature review of approaches and
concepts used for linguistic descriptions of time-series data within the Soft Computing community. The
main methods used here are knowledge extraction and linguistic expression processes, whereas the NLG
community applies a series of tasks, including Signal Analysis, Microplanning, and Realisation.
Following on from prior research, we investigate whether conveying uncertainty in NL can support
decision-making. In particular, we are interested in how natural language expressions of uncertainty, i.e.
the probability of a future event to happen, will influence confidence and precision for human decision
makers. One of our main contributions is that we introduce an online task-based evaluation scenario in
order to measure the extrinsic effects of different realisations on the primary task, following similar efforts
for generating referring expressions [35].
III. T HE G ENERATION TASK
In this work, we consider the exemplar task of weather forecast generation. We initially present two
NLG strategies which present the uncertainty in the input data. The two strategies are based on (1) the
World Meteorological Organization (WMO) [5] guidelines, and (2) commercial forecast presentations (e.g.
from BBC presenters). We then evaluate the strategies against a state-of-the-art graphical system [36],
which presents the uncertain data in a graphical way. Figure 1 shows an example of this baseline graphical
presentation. We use a game-based setup [37] to perform a task-based evaluation, to investigate the effect
that the different information presentation strategies have on human decision-making.
IV. T HE E XTENDED W EATHER G AME
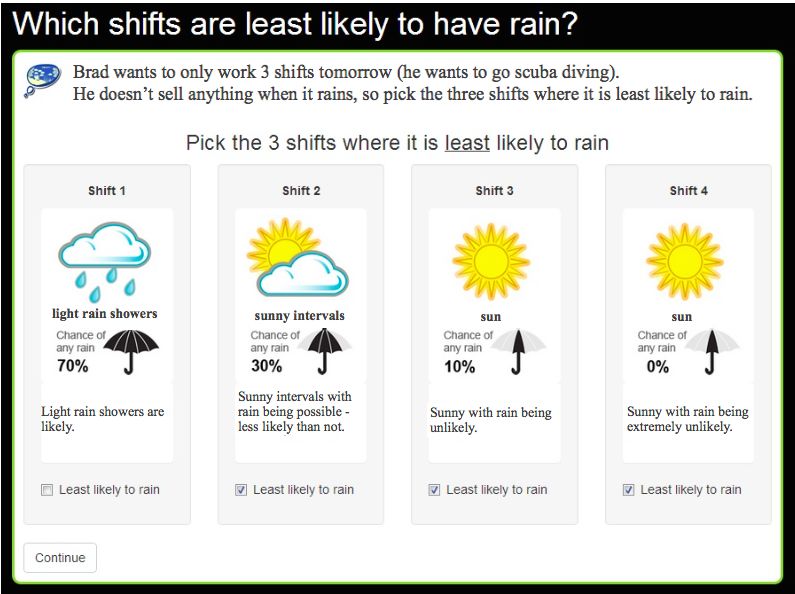
In this section, we present our extended version of the MetOffice’s Weather Game [36]. In this game,
the player has to choose where to send an ice-cream vendor in order to maximize sales, given weather
forecasts for four weeks and two locations. These forecasts describe (1) predicted rainfall (see Figure
2), and (2) temperature levels (see Figure 1) together with their likelihoods in three ways: (a) through
graphical representations (which is the version of the original game), (b) through textual forecasts, and (c)
through combined graphical and textual forecasts. We generated the textual format using two rule-based
NLG approaches as described in the next section. Users are initially shown the temperature graphs for
two locations and they are asked to choose the best destination for the ice-cream vendor. Following theirFig. 1: Graphics for temperature data. decision, they are asked to state how confident they are with their choice. Then, they are shown four potential shifts (see Figure 2) and they are asked to choose three of the shifts where it is least likely to rain. Again, they have to declare how confident they are with their decisions. This process is repeated four times. Based on their decisions and their confidence levels, the participants are presented with their monetary gain, i.e. game score, after each week (and in the end of the game), which gives them the chance to improve their decision-making strategy. The monetary gain function works as follows: the higher the likelihood of sunshine, the higher the monetary gain if the player has declared that s/he is confident that it is not going to rain and it does not actually rain. In the opposite scenario, the player would lose money. The decision on whether rain occurred is estimated by sampling the probability distribution, in order to simulate the real weather phenomena. Users were additionally required to provide demographic details such as age, gender and educational level (see also Section VI). At the end of the game, users were scored according to their risk literacy following the Berlin Numeracy Test [6]. The Berlin Numeracy Test is a psychometric test introduced by Cokely et al. [6], which quickly assesses statistical numeracy and risk literacy. The Extended Weather
Fig. 2: Screenshot of the Extended Weather Game.

Game uses the 1 minute literacy test in order to minimize the tasks that the participants have to perform.
This test includes only one numeracy question:

  Imagine we are throwing a five-sided die 50 times. On average, out of these 50 throws how many
  times would this five-sided die show an odd number (1, 3 or 5)?

  The Extended Weather Game can be accessed here:http://www.macs.hw.ac.uk/InteractionLab/
weathergame/.

                V. NATURAL L ANGUAGE G ENERATION FROM U NCERTAIN I NFORMATION

  We developed two NLG systems, WMO-based and NATURAL, using SimpleNLG [38], which both
generate textual descriptions of rainfall and temperature data addressing the uncertain nature of forecasts.
WMO-based: This is a rule-based system which uses the guidelines recommended by the WMO [5]
for reporting uncertainty, as shown in Table I. This system directly maps the probabilities of weather
to corresponding linguistic interpretation. Consider for instance a forecast of sunny intervals with 30%
probability of rain. This WMO-based system will generate the following forecast: “Sunny intervals with
rain being possible - less likely than not”.
TABLE I: Mapping of likelihoods with accordance to World Meteorological Organisation.
Likelihood of occurrence Lexicalisation
p > 0.99 “extremely likely”
0.90 ≤ p ≤ 0.99 “very likely”
0.70 ≤ p ≤ 0.89 “likely”
0.55 ≤ p ≤ 0.69 “probable - more likely than not”
0.45 ≤ p ≤ 0.54 “equally likely as not”
0.30 ≤ p ≤ 0.44 “possible - less likely than not”
0.10 ≤ p ≤ 0.29 “unlikely”
0.01 ≤ p ≤ 0.09 “very unlikely”
p < 0.01 “extremely unlikely”
NATURAL: This system imitates forecasters and their natural way of reporting weather. The rules used
in this system have been derived by observing the way that experts (e.g. BBC weather reporters) produce
forecasts. For the previous example (sunny intervals with 30% probability of rain), this system will generate
the following forecast: “Mainly dry with sunny spells”. This system is more natural than the WMO-based,
in that the probabilities are mapped to linguistic interpretation of weather (e.g. “sunny spells”) rather than
the linguistic mapping of uncertainty (e.g. “likely”).
VI. E XPERIMENTAL S ETUP
In order to investigate what helps people to better understand and act upon uncertainty in information
presentations, we initially use five conditions within the context of the Extended Weather Game grouped
in three categories:
Graphics only:
• This representation shows the users only the graphical representation of the weather forecasts. For
this condition, we used the graphs that scored best in terms of human comprehension in a study by
Stephens et al. [36], [39].
Multi-modal representations:
• Graphics and NATURAL: This is a multi-modal representation consisting of graphics (as described
in the previous condition) and text produced by the NATURAL system.
• Graphics and WMO-based: This is also a multi-modal representation consisting of graphics and
text produced by the WMO-based system.
NLG only:
• NATURAL only: This is a text-only representation as generated by the NATURAL system.• WMO-based system only: This is also a text-only representation as generated by the WMO-based
system.
In the next sections, we treat the NLG systems under one category (NLG only) in order to be able to
explore the effects that NLG has on decision-making in general (also the results obtained for the two NLG
systems were not significantly different) compared to graphics only and to multi-modal representations.
Data
We recruited 442 unique adult players using social media (197 females, 241 males, 4 non-disclosed). We
collected 450 game instances (only a few people played the game twice). Further to the Extended Weather
Game results and the Berlin Literacy test results, we also collected demographic data. A description of
the data is provided in Table II. The full dataset has been made available online1 .
TABLE II: Description of collected demographic data.
Variable Description
Age User could specify their age as free text
Postcode Only three first letters were requested
Gender Male/Female/Other
Native speaker of Yes/No
English
Familiarity with sci- Have you ever been taught or learnt about how scientists use computers
ence models to model the environment? Potential answers can be: Yes/No/Not Sure
Experience with risk Do you often make decisions or judgements based on risk, chance, or
probability? Potential answers can be: Yes/No/Not Sure
Education What is the highest qualification you have achieved so far? Potential
answers can be: Degree level or above, 2+ A-levels or equivalent,
Apprenticeship, 5+ GCSEs or equivalent, 1-4 GCSEs or equivalent,
Other qualifications, No qualifications. We only found significant
differences between BSc holders and non-holders.
The distributions of demographic features amongst our adult participants are shown in Table III. In the
next section, we describe the results with regard to game performance and information presentation and
their interaction with these demographic factors.
TABLE III: Demographics of the adult cohort.
Females (out of 197) Males (out of 241)
Native speaker of English 170 (86%) 199 (83%)
Familiarity with Science models 79 (40%) 145 (60%)
Experience with risk 132 (67%) 185 (77%)
Education (BSc holders) 161 (82%) 205 (85%)
1
https://github.com/dimi123/WeatherGameVII. R ESULTS
In order to investigate which representations assist people in decision-making under uncertainty, we
analyzed both the players’ scores (in terms of monetary gain) and their predictions for rainfall with regard
to their confidence scores. As we described in Section IV, the game calculates a monetary gain based
on both the decisions and the confidence of the player, i.e. the decision-making ability of the player.
Regarding confidence, we asked users to declare how confident they are on a 10-point scale. For example,
we assume that if there is 70% probability of rain, the player should have been 70% confident that is
going to rain. The 10-point scale was chosen for two reasons. Firstly, it was the one used at the original
weather game [36] so we followed the same design in order to be able to compare our results. Secondly,
since the weather uncertainty is communicated with percentages, e.g. “There is 30% probability of rain”
and since the confidence scores are also represented with percentages, i.e. one can be 30% confident that
it will rain when there is 30% probability of rain, a 10-point scale is used to measure confidence level in
order to accurately capture confidence levels.
In the following, we present the results for monetary gain scores and reported confidence. In order to
assess significance we used ANOVA, following [36], and we also report effect sizes.
A. Results for all adults
1) Game Score:
• Multi-modal vs. Graphics only: We found that the use of multi-modal representations leads
to gaining significantly higher game scores (i.e. better decision-making) than the Graphics only
representation (p = 0.03, effect = +36.36). This is a 44% average increase in game score.
• Multi-modal vs. NLG only: However, there is no significant difference between the NLG only and
the multi-modal representation in terms of game score.
• NLG vs. Graphics only: We found that the NLG representations resulted in a significant 24.8%
increase in average game score (i.e. better decision-making) compared to the Graphics-only condition
(see Table IV).
• WMO-based vs. NATURAL: There was no significant difference found between the WMO and
NATURAL NLG systems. For the WMO-system, being native speaker of English (or not) does not
influence confidence levels. However, native speakers of English score significantly higher than non-
native (p < 0.006, effect = 73.23%). One reason for this might be that in different languages there areTABLE IV: Average monetary gains and confidence scores (All Adults).
Monetary gains Confidence
Graphs only 81.15 78.5%
Multi-modal 117.51 83.7%
NLG only 101.33 66%
TABLE V: Average monetary gains and confidence scores (Females).
Monetary gains Confidence
Graphs only 60.83 74.6%
Multi-modal 118.41 81.3%
NLG only 113.86 65.8%
different words which express different levels of uncertainty and they cannot be directly translated
into English. This does not hold true for NATURAL, which expresses uncertainty using weather
phenomena (e.g. “dry spells”) instead of probability mentions (e.g. “more likely than not”).
2) Confidence: For confidence, the multi-modal representation is significantly more effective than NLG
only (p < 0.01, effect = 17.7%). However, as Table IV shows, although adults felt less confident when
presented with NLG only, they were able to make better decisions compared to being presented with
graphics only.
3) Demographic factors: We further found that the following demographic factors are predictors of
the players’ understanding of uncertainty, which is translated in both confidence and game scores:
• prior experience on making decisions based on risk,
• familiarity with science models,
• correct literacy test results,
• gender.
In contrast, we found that the education level and being native speaker of English do not contribute
to players’ confidence and game scores. However, we did find that gender was a significant factor when
using different presentation strategies, as shown in the next sections.
B. Results for Female Participants
1) Game Score: We found that female participants score significantly higher at the decision task when
exposed to either of the NLG output presentations, when compared to the Graphics only presentation
(p < 0.05, effect = +53.03). This is an increase of 87%, also see Table V. In addition, the same group
scores significantly higher when presented with the multi-modal output as compared to graphics only
(p = 0.05, effect = 60.74). Interestingly, for this group, the multi-modal presentation adds little morein effectiveness of decision-making than the NLG-only condition, but the multi-modal presentations do
enhance their confidence (+15%). As expected, female participants who answered correctly the literacy
test, they also performed significantly higher than the ones who did not answer correctly (p < 0.01,
effect = +56.87). Non-educated females are also more likely to score higher if they are native speakers
of English 2 . This suggests that text-simplification techniques might be necessary in order to leverage the
positive effect of NLG for non-educated, non-native users.
2) Confidence: We furthermore found that female participants, who correctly answered the risk literacy
test, feel significantly more confident when presented with the multi-modal representations than with NLG
only (p = 0.01, effect = 16.7%). We see that, for confidence, correctly answering the literacy test is a
better predictor than education.
C. Results for Male Participants
1) Game Score: We found that males obtained similar game scores with all the types of representations.
This suggests that the overall improved scores (for All Adults) presented above, are largely due to the
beneficial effects of NLG for women. As expected, males with experience of using science models of
uncertainty, scored significantly higher than males who do not (p = 0.013, effect = 48.05%). Similarly,
the ones who often make decisions based on uncertainty score significantly higher than the ones who do
not (p < 0.001, effect = 72.83%).
2) Confidence: In terms of confidence, males (either educated or not) are more likely to be more
confident if they are presented with graphics only (81% of the time) or a multi-modal representation
(85% of the time) (p = 0.01). Similarly to the results for game score, males who use science models of
risk or uncertainty are more confident in their decisions than males who do not (p = 0.047, effect = 6.5%).
In addition, males who often make decisions based on uncertainty are more likely to feel confident with
their decisions than the ones who do not (p = 0.004, effect = 10.79%). This is also true for non-educated
males (p = 0.008, effect = 56.32%).
D. Discussion
The main question of this article is to investigate whether NL descriptions of uncertainty can improve
decision-making. Our results suggest that it does enhance decision-making and there are some findings
which can prove useful for future research and are summarized below.
2
Note that, although the results are significant (p = 0.030), the sample size is very small (only four non-native non-educated females).From the results we can infer that linguistic expressions of uncertainty (e.g. probable, very likely) might
be interpreted differently by people. For instance, for a native speaker the word possible might hold less
probability for an event to occur than a non-native speaker might think and vice versa, see e.g. results by
[21] on speakers of different languages. On the other hand, specific phenomena such as dry spells seem
to be interpreted similarly by both native and non-native speakers. This implies that generally people tend
to comprehend specific entities more accurately than expressions of uncertainties and therefore this might
lead to better decision-making. Therefore, it is recommended to use specific entities rather than linguistic
expressions of uncertainty.
The results also showed that people tend to feel significantly more confident when presented with
multi-modal representations rather than Graphs only or NLG-only representations, although in terms of
decision-making they perform similarly when presented with multi-modal and NLG representations. This
implies that the graphs might boost peoples’ confidence, although it might be easier to miss information
and make worse decisions with graphs only. For this reason, it is recommended to include graphs with
NL text.
Finally, the results obtained in this domain can have implications for other domains with similar
characteristics. People often have to make decisions in other domains such as health or energy consumption.
These domains have similar characteristics with the weather domain, since they also involve uncertainty.
For instance, energy consumption at home might be influenced by the weather as well as the family’s
changes in routine (spending fewer or more hours at home), unexpected visitors, home repairs, and so on.
Companies normally issue projected energy consumption for their customers in monetary terms, which
is calculated based on similar households in the area, the home’s size, etc. However, the projections do
not include explanations on how other factors might influence the energy rates, although they include the
numerical values of units. It is very likely that people would make better decisions on energy based on
NL descriptions of projections.
VIII. C ONCLUSIONS AND F UTURE W ORK
We present results from a game-based study on how to generate descriptions of uncertain data – an
issue which so far has been under-explored by data-to-text systems. We show that, NLG leads to better
decision-making with 24% relative increase in task success over conventional graphical representations.
However, using graphics can boost the user’s confidence.We furthermore find that there are significant gender differences between multi-modal, NLG, and
graphical versions of the task, where for women, the use of NLG results in an 87% increase in task
success over graphics. Multi-modal presentations lead to a 44% increase for all adults, compared to
graphics. People are also more confident of their judgements when using the multi-modal representations.
These are significant findings, as conventional (systems commonly used by professionals) decision-support
systems commonly rely on graphical representations only. Furthermore, previous work on data-to-text
systems has not distinguished between genders when comparing different representations of data, e.g.
[1]. It also confirms research on gender effects in multi-modal systems, as for example reported in [40],
[41], [42]. An interesting investigation for future research is the interplay between uncertainty, risk-taking
behavior, and gender, as for example reported in [43].
Another interesting direction for future work is adaptive NLG approaches which can generate text (or
multi-modal representations) based on the user’s gender, or other demographic factors which have shown
to have an effect, such as education, etc. The work presented in this article can act as a starting point for
potential user models which can inform the generation decisions.
ACKNOWLEDGEMENTS
This research received funding from the EPSRC projects GUI (EP/L026775/1), DILiGENt
(EP/M005429/1), and MaDrIgAL (EP/N017536/1).
R EFERENCES
[1] A. Gatt, F. Portet, E. Reiter, J. Hunter, S. Mahamood, W. Moncur, and S. Sripada, “From data to text in the neonatal intensive care
unit: Using nlg technology for decision support and information management,” AI Communications, vol. 22, no. 3, pp. 153–186, Aug.
2009.
[2] G. Gigerenzer and J. A. Muir Gray, Eds., Better Doctors, Better Patients, Better Decisions: Envisioning Health Care 2020. Cambridge
MIT Press, 2011.
[3] K. Beven, Environmental Modelling: An Uncertain Future? Routledge, 2009.
[4] M. Manning, M. Petit, D. Easterling, J. Murphy, A. Patwardhan, H.-H. Rogner, R. Swart, and G. Yohe, “Describing scientific
uncertainties in climate change to support analysis of risk and of options,” IPCC Workshop Report, Maynooth, Ireland, May 2004.
[5] H. Kootval, Ed., Guidelines on Communicating Forecast Uncertainty. World Meteorological Organisation, 2008.
[6] E. T. Cokely, M. Galesic, E. Schulz, S. Ghazal, and R. Garcia-Retamero, “Measuring risk literacy: The Berlin numeracy test.” Judgment
and Decision Making, vol. 7, no. 1, pp. 25–47, Jan. 2012.
[7] M. Galesic and R. Garcia-Retamero, “Statistical numeracy for health: A cross-cultural comparison with probabilistic national samples,”
in Transparent Communications of Health Risks: Overcoming Cultural Differences, R. Garcia-Retamero and M. Galesic, Eds. Berlin,
Germany: Springer, Mar. 2012, ch. 2, pp. 462–468.[8] D. Gkatzia, O. Lemon, and V. Rieser, “Natural language generation enhances human decision-making with uncertain information,” in
Proc. of the 54th Annual Meeting of the Association for Computational Linguistics (ACL), Berlin, Germany, Aug. 2016, pp. 264 – 268.
[9] “Weather game data,” https://github.com/dimi123/WeatherGame, note = Accessed: 2017-02-20.
[10] E. Reiter, “An architecture for data-to-text systems,” in Proc. of the 11th European Workshop on Natural Language Generation (ENLG),
Prague, Czech Republic, Jun. 2007, pp. 97–104.
[11] I. Konstas and M. Lapata, “Unsupervised concept-to-text generation with hypergraphs,” in Proc. of the Conference of the North American
Chapter of the Association for Computational Linguistics (NAACL), Montral, Canada, Jun. 2012, pp. 752–761.
[12] G. Angeli, P. Liang, and D. Klein, “A simple domain-independent probabilistic approach to generation,” in Proc. of the Conference on
Empirical Methods in Natural Language Processing (EMNLP), Cambridge, Massachusetts, Oct. 2010, pp. 502–512.
[13] A. Belz and E. Kow, “Extracting parallel fragments from comparable corpora for data-to-text generation,” in 6th International Natural
Language Generation Conference (INLG), Dublin, Ireland, Jul. 2010, pp. 167–171.
[14] S. G. Sripada, E. Reiter, and L. Hawizy, “Evaluation of an NLG system using post-edit data,” in International Joint Conference on
Artificial Intelligence (IJCAI), Edinburgh, Scotland, Jul. 2005, pp. 1700–1701.
[15] M. van der Meulen, R. H. Logie, Y. Freer, C. Sykes, N. McIntosh, and J. Hunter, “When a graph is poorer than 100 words: A
comparison of computerised natural language generation, human generated descriptions and graphical displays in neonatal intensive
care,” Applied Cognitive Psychology, vol. 24, no. 1, pp. 77–89, 2010.
[16] E. Reiter, S. Sripada, J. Hunter, and I. Davy, “Choosing words in computer-generated weather forecasts,” Artificial Intelligence, vol.
167, no. 1-2, pp. 137–169, Sep. 2005.
[17] S. G. Sripada, N. Burnett, R. Turner, J. Mastin, and D. Evans, “A case study: NLG meeting weather industry demand for quality and
quantity of textual weather forecasts,” in Proc. of the International Conference on Natural Language Generation (INLG), Philadelphia,
USA, Jun. 2014, pp. 1–5.
[18] D. Gkatzia, V. Rieser, A. McSporran, A. McGowan, A. Mort, and M. Dewar, “Generating verbal descriptions from medical sensor data:
A corpus study on user preferences,” in Proc. of the Health Informatics Scotland (HIS), Glasgow, UK, Sept. 2014, (Total 8 pages).
[19] D. Gkatzia, H. Hastie, and O. Lemon, “Comparing multi-label classification with reinforcement learning for summarisation of time-
series data,” in Proc. of the 52nd Annual Meeting of the Association for Computational Linguistics (ACL), Baltimore, USA, Jun. 2014,
pp. 1231–1240.
[20] N. Tintarev, Y. Melero, S. Sripada, E. Tait, R. V. D. Wal, and C. Mellish, “Minkapp: Generating spatio-temporal summaries for nature
conservation volunteers,” in Proc. of the 7th International Natural Language Generation Conference (INLG), Utica, Illinois, USA, May
2012, pp. 17–21.
[21] A. Gatt and F. Portet, “If it may have happened before, it happened, but not necessarily before,” in Proc. of the 13th European Workshop
on Natural Language Generation (ENLG), Sep. 2011, pp. 91–101.
[22] R. Power and S. Williams, “Generating numerical approximations,” Computational Linguistics, vol. 38, no. 1, pp. 113–134, March
2012.
[23] A. Chaganty and P. Liang, “How much is 131 million dollars? putting numbers in perspective with compositional descriptions,” in
Proc. of the 54th Annual Meeting of the Association for Computational Linguistics, Berlin, Germany, Aug. 2016, pp. 578–587.
[24] D. Gkatzia, O. Lemon, and V. Rieser, “How to talk to strangers: Minimising regret when generating medical reports for unknown
users,” in Proc. of the IEEE International Conference on Fuzzy Systems (FUZZ-IEEE), Vancouver, Canada, July 2016, pp. 579–586.
[25] D. Gkatzia, H. Hastie, and O. Lemon, “Multi-adaptive natural language generation using principal component regression,” in Proc. of
the 8th International Natural Language Generation Conference (INLG), Philadelphia, USA, Jun. 2014, pp. 138–142.[26] K. van Deemter, “What game theory can do for NLG: the case of vague language,” in Proc. of the 12th European Workshop on Natural
Language Generation (ENLG), Athens, Greece, Mar. 2009, pp. 154–161.
[27] M. J. Green and K. van Deemter, “Vagueness as cost reduction : An empirical test,” in Proc. of ‘Production of Referring Expressions’
Workshop at 33rd Annual Meeting of the Cognitive Science Society, Boston, USA, Jul. 2011, (Total 6 pages).
[28] D. Gkatzia, “Content selection in data-to-text systems: A survey,” in arXiv:1610.08375 [cs.CL], 2016.
[29] L. Zadeh, “Fuzzy logic, neural networks, and soft computing,” Communication of the ACM, vol. 37, no. 3, pp. 77–84, Mar. 1994.
[30] F. Herrera, S. Alonso, F. Chiclana, and E. Herrera-Viedma, “Computing with words in decision making: Foundations, trends and
prospects,” Fuzzy Optimization and Decision Making, vol. 8, no. 4, pp. 337–364, Dec. 2009.
[31] A. Ramos-Soto, A. Bugarı́n, and S. Barro, “On the role of linguistic descriptions of data in the building of natural language generation
systems,” Fuzzy Sets Syst., vol. 285, no. C, pp. 31–51, Feb. 2016.
[32] P. Conde-Clemente, J. M. Alonso, and G. Trivino, “Toward automatic generation of linguistic advice for saving energy at home,” Soft
Computing, pp. 1–15, Nov. 2016.
[33] J. M. Alonso, C. Castiello, M. Lucarelli, and C. Mencar, “Modeling interpretable fuzzy rule-based classifiers for medical decision
support,” Medical Applications of Intelligent Data Analysis: Research Advancements (IGI GLOBAL, DOI:10.4018/978-1-4666-1803-
9.ch017), pp. 255–272, 2012.
[34] N. Marı́n and D. Sánchez, “On generating linguistic descriptions of time series,” Fuzzy Sets Syst., vol. 285, no. C, pp. 6–30, Feb. 2016.
[35] D. Byron, A. Koller, J. Oberlander, L. Stoia, and K. Striegnitz, “Generating instructions in virtual environments (GIVE): A challenge
and an evaluation testbed for NLG,” in Proc. of the Workshop on Shared Tasks and Comparative Evaluation in Natural Language
Generation, 2007.
[36] L. Stephens, K. Mylne, and D. Spiegelhalter, “Using an online game to evaluate effective methods of communicating ensemble model
output to different audiences,” in American Geophysical Union, Fall Meeting, Dec. 2011 (Poster).
[37] D. Gkatzia, A. Cercas Curry, V. Rieser, and O. Lemon, “A game-based setup for data collection and task-based evaluation of uncertain
information presentation,” in Proc. of the 15th European Workshop on Natural Language Generation (ENLG). Brighton, UK:
Association for Computational Linguistics, Sept. 2015, pp. 112–113.
[38] A. Gatt and E. Reiter, “SimpleNLG: A realisation engine for practical applications,” in ENLG, Mar. 2009, pp. 90–93.
[39] E. M. Stephens, T. L. Edwards, and D. Demeritt, “Communicating probabilistic information from climate model ensembleslessons
from numerical weather prediction,” Wiley Interdisciplinary Reviews: Climate Change, vol. 3, no. 5, pp. 409–426, Aug. 2012.
[40] M. E. Foster and J. Oberlander, “Data-driven generation of emphatic facial displays,” in Proc. of the 11th Conference of the European
Chapter of the Association for Computational Linguistics (EACL), Trento, Italy, Apr. 2006, pp. 353–360.
[41] V. Rieser and O. Lemon, “Learning effective multimodal dialogue strategies from wizard-of-oz data: Bootstrapping and evaluation,” in
Proc. of Annual Meeting of the Association for Computational Linguistics (ACL), Columbus, USA, Jun. 2008, pp. 638–646.
[42] B. Weiss, S. Möller, and M. Schulz, “Modality preferences of different user groups,” in Proc. of the Fifth International Conference on
Advances in Computer-Human Interactions (ACHI), Valencia, Spain, Feb. 2012, pp. 354–359.
[43] R. Sarin and A. Wieland, “Risk aversion for decisions under uncertainty: Are there gender differences?” Journal of Behavioral and
Experimental Economics, vol. 60, pp. 1–8, 2016.You can also read