Louisiana's Multi-Regional Statewide Nursing Workforce Forecasting Model
←
→
Page content transcription
If your browser does not render page correctly, please read the page content below

Louisiana’s
Multi-Regional
Statewide
Nursing
Workforce
Forecasting
Model

                                                            Technical Report
                                                                        2013

                                                      For More Information Contact:
                                                          Cynthia Bienemy, Ph.D., RN
                                               Director, Louisiana Center for Nursing
                                                                  lcn@lsbn.state.la.us
                                                                        225.755.7563

Funded by the Louisiana Health Works Commission and the Louisiana State Board of Nursing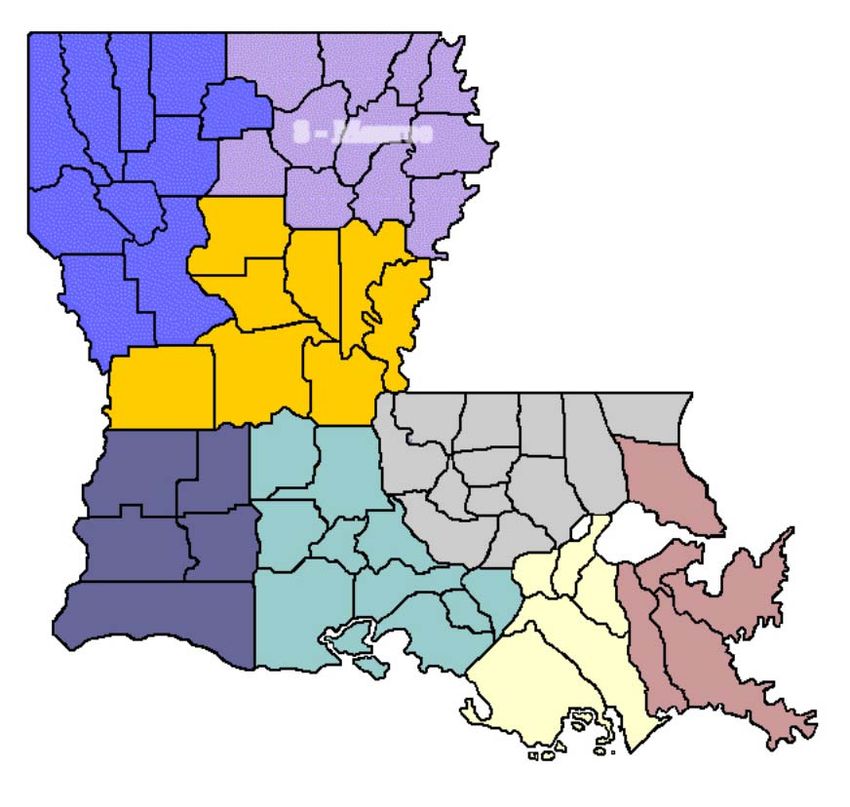
Project Acknowledgements
   The Center for Health Affairs Northeast Ohio Nursing Initiative Consultants
   Lisa Anderson, MSN, RN
   Patricia Cirillo, PhD
   Craig Moore, PhD

   Louisiana Center for Nursing
   Louisiana Health Works Commission
   Louisiana State Board of Nursing
   Louisiana State Board of Practical Nurse Examiners
   Louisiana Nursing Supply and Demand Council

   We wish to recognize the following individuals for their contribution:

   M. Lynn Ansardi, RN
   Executive Director for the Louisiana State Board of Practical Nurse Examiners

   Cynthia Bienemy, PhD, RN
   Director of the Louisiana Center for Nursing

   Jamey Boudreaux
   Executive Director, Louisiana-Mississippi Hospice and Palliative Care Organization

   Cecille Castello, RN
   DHH Section Chief for Health Standards

   Lisa Deaton, BSN, RN
   Vice Chair of the Nursing Supply and Demand Council

   Warren Hebert, RN, CAE
   CEO, HomeCare Association of Louisiana

   Cordt Kassner, PhD
   Principal, Hospital Analytics

   Clair Millet, RN, MN, APRN, PHCNS-BC
   Director of Nursing, Louisiana DHH Office of Public Health

   Barbara Morvant, MN, RN
   Executive Director of the Louisiana State Board of Nursing

   John Steckler
   VP, ShareCor, Louisiana Hospital Association

   Sarah Sullivan, BS
   Administrative Assistant, Louisiana Center for Nursing

   Karen Zoeller
   Chair of the Louisiana Health Works Commission
   VP, Policy Development, Louisiana Hospital Association

                             Louisiana’s Multi-Regional Statewide Nursing Workforce Forecasting Model
Louisiana’s Multi-Regional Statewide Nursing
               Workforce Forecasting Model
                   Executive Summary

The Louisiana Center for Nursing (LCN), a division of the Louisiana State Board of Nursing
(LSBN), received funding from the Louisiana Health Works Commission (LHWC) and LSBN in
2012 to develop a nursing workforce forecasting model. The Forecasting Model will be used to
predict nursing workforce supply and demand for Registered Nurses (RNs), Advanced Practice
Registered Nurses (APRNs), and Licensed Practical Nurses (LPNs). This Forecasting Model
provides a more precise way of assisting policymakers, nurse leaders, and nurse educators in
their efforts to plan and prepare a future nursing workforce for decades to come. The model
incorporates a number of data sets including population demographics, economic conditions,
level of patient care mix (acute and long-term care), as well as the current nursing workforce
supply and demand.

The Northeast Ohio Nursing Initiative (NEONI) Forecasting Model was used as a template for
Louisiana’s Multi-Regional Statewide Nursing Workforce Forecasting Model. The NEONI
Group, composed of Dr. Craig Moore, economist, and private consultant, Dr. Patricia Cirillo,
statistician and President of Cypress Research Group in Northeast Ohio, and Lisa Anderson,
MSN, RN, Vice President with the Center for Health Affairs in Cleveland, OH, in collaboration
with Dr. Cynthia Bienemy, Director for the Louisiana Center for Nursing, developed Louisiana’s
Multi-Regional Statewide Nursing Workforce Forecasting Model. The NEONI Forecaster,
although a very dynamic forecasting tool, is currently limited to 17 counties within Northeast
Ohio, whereas, Louisiana’s Multi-Regional Statewide Nursing Workforce Forecasting Model is
believed to be the only nursing workforce forecasting model that has the ability to predict supply
and demand for RNs, APRNs, and LPNs at both the regional and statewide level, and identify
gaps (either a shortage or a surplus) through the year 2020.

In recognition that population, technological advances in health care, regulatory changes which
impact healthcare, and other market forces will vary unpredictably in the next seven years, the
model is not static, it is dynamic. That is, a number of key assumptions regarding the future of
healthcare and changes in the nursing workforce can be easily changed in the model to provide a
range of future forecasts. Used in this way, the model becomes a policy tool that can help
identify the most effective way to manage any anticipated shortages in the availability of nurses.

Nursing Supply and Demand Forecast
If the current conditions remain constant, that is, if the population demographics, number and
type of nurse workforce, level of exporting care to patients outside of the region, and the level of
demand for care by the population (intensity factors) remain the same, the current forecast shows
that there will be large regional differences in shortages and surpluses across Louisiana for RNs,
APRNs, and LPNs.

                                                 1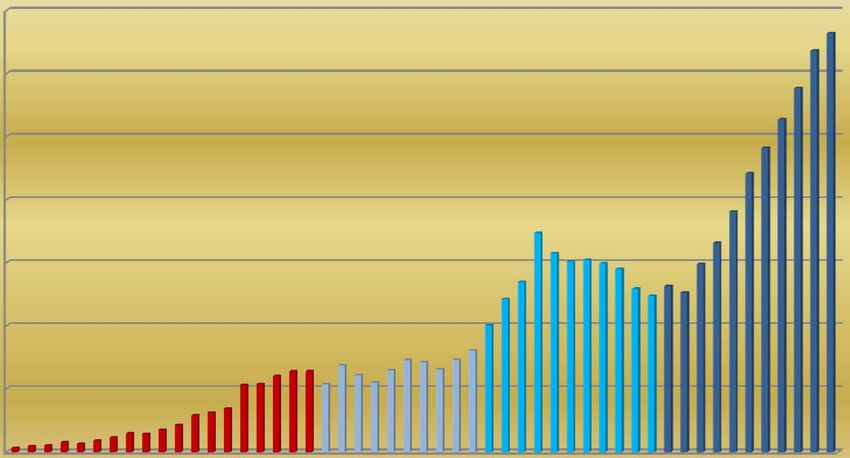
Major Findings
Registered Nurses (RNs)
Nearly 60 percent of RNs are employed in Louisiana hospitals.
Almost 10 percent of RNs in Louisiana are unemployed or choose not to work.
A statewide shortage for RNs is expected to continue through 2016. In 2017, the
supply of RNs will just meet the demand until 2020 based on current conditions.*
2013 shows a shortage of full-time equivalent (FTE) RNs (41,397 supply) compared
to demand (44,472) and varies significantly by region.
Shortages will exist through 2020 for RNs in the following regions: Baton Rouge,
Lafayette, and New Orleans.
There will be a surplus of RNs in Alexandria, Houma, and Lake Charles through
2020.
*Changes in health care policy/health care reform, patient care delivery, nurse
intensity, or population shift will affect demand for RNs, APRNs, and LPNs
Advanced Practice Registered Nurses (APRNs)
The demand for APRNs (FTEs) in 2013 was estimated at 5,282, with a supply of
3,959, leaving a gap of 1,323 FTEs. The ultimate size of this gap over the next
decade will depend on the changing patterns of APRN utilization and healthcare
policy as we go forward.
Based on the current intensity (nurse-to-healthcare-unit ratio) for APRNs in Louisiana
and a growth rate of 4% annually for APRNs in both the inpatient and ambulatory
care settings, the demand for APRNs will be almost 7,000 FTEs by 2020. If, state-
wide, the number of new APRNs entering the workforce remains at about 10% (the
recent rate in Louisiana), the state-wide shortage of APRNs will continue at its
current level until 2020.
There will be a demand for APRNs through 2020 in the following regions: Baton
Rouge, Lafayette, New Orleans, and Shreveport.
Licensed Practical Nurses (LPNs)
The majority of LPNs are employed in long-term care facilities (5,411) and hospitals
(4,569).
About 10 percent of LPNs are unemployed.
The LPN ratio of nurses to patients is much higher in Louisiana hospitals, especially
rural facilities, than other states in the country.
There will be a shortage of LPNs through 2020 in the following regions: Baton
Rouge, New Orleans, and Houma.
A surplus in the number of FTE LPNs will extend through 2020 in Alexandria,
Lafayette, and Monroe.
Statewide, the demand for LPNs will extend through 2013. Beginning in 2014 and
extending through 2020, the supply of LPNs will just meet the demand.
2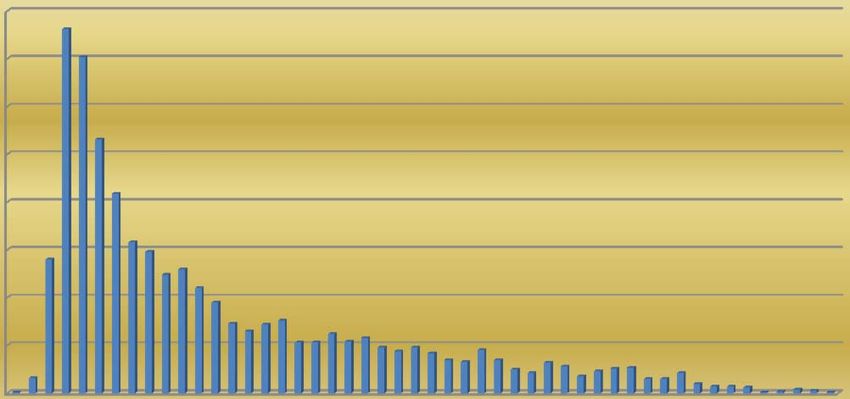
Recommendations:
Present the forecasting model to stakeholders across the state to share how the model
can be used by educators, nursing administrators, healthcare facilities, and legislators
for strategic planning, workforce planning, and policy development.
Update the Multi-Regional Statewide Nursing Workforce Forecasting Model each
year using the most current licensure renewal data (nursing supply) and education
capacity data.
Seek funding to:
Develop comprehensive regional profiles of the current supply, demand,
and education capacity for RNs, APRNs, and LPNs for the eight regional
labor market areas in Louisiana
Validate and modify the assumptions in the Forecasting Model based on
the findings obtained from the regional analysis of the 2013-2014 nursing
supply, education capacity, demand, and new graduate data
Predict nursing supply and demand through 2020 at the regional and
statewide level using the updated Louisiana Multi-Regional Statewide
Nursing Workforce Forecasting Model
Use Geographic Information System (GIS) Mapping to visually illustrate
regional and state-wide nursing workforce profiles
Develop recommendations for workforce development and strategic
planning for each region and the state as a whole based on ‘what if’
scenarios generated by the Louisiana Multi-Regional Statewide Nursing
Workforce Forecasting Model.
3
The Louisiana Multi-Regional Statewide Nursing
Workforce Forecasting Model
The Louisiana Nursing Workforce Forecasting Model is a tool that provides a benchmark
forecast of the need for registered nurses (RNs), advanced practice registered nurses
(APRNs), and licensed practical nurses (LPNs), through the year 2020. The model is designed
to provide forecasts for RNs, APRNs, and LPNs, both at the state level, and at the regional level.
Louisiana’s eight Regional Labor Market Areas (RLMAs) were used for forecasting at the
regional level.
The model estimates both the future demand for health care services to Demand for Nurses –
be provided by nurses and the supply of nurses available to meet that Supply of Nurses=
demand. The model contrasts the supply and demand for RNs, APRNs, Shortage or Surplus
and LPNs within each region and for the entire state, and identifies gaps of Nurses
(either a shortage or a surplus) from 2013 through the year 2020.
In recognition that population, technological advances in health care, regulatory changes which
impact healthcare, and other market forces will vary unpredictably in the next seven years, the
model is not static, it is dynamic. That is, a number of key assumptions regarding the future of
healthcare and changes in the nursing workforce can be easily changed in each model to provide
a range of future forecasts. Used in this way, the models become policy tools that can help
identify the most effective way to manage any anticipated shortages in the availability of nurses.
The model is a manifestation of the examination of the relationships of various factors (statistical
variables) related to both the supply and demand for nurses in Louisiana. This report describes
the sources of data which served as input into the models, how the data relate to both the supply
and demand, and assumptions used in the modeling and output process.
Healthcare Settings
A core piece of the model relies on the number of nurses required to care for patients within
various settings also known as the ‘intensity factor’. Because the ‘intensity factor’ varies
tremendously by healthcare setting, the model separates the demand for nurses by setting. The
various settings delineated in the model are:
Hospital Inpatient Care
Emergency Department
Ambulatory Care
Nursing Facilities/Nursing Homes
Home Health
Community Health
Public Health
Nursing Education
Other – healthcare related settings other than the eight settings listed above.
4The Regions
An essential first step in developing the forecasting model was determining the best regional
division for the state. This was done using information such as commuter patterns for nurses
working in the region, industry clusters that characterize the region, and major exports of
products and services. After considering alternative boundaries and the need for comparability,
Louisiana’s eight Regional Labor Market Areas (RLMAs) were selected as the regions that
would be used to develop the models. Users of the model can therefore focus on a single region
alone, as the data input for each region was specific to that region.
A map and definition of each region based on Parish is shown below.
Eight Regions for the Nursing Workforce Forecasting Model – State of Louisiana
Parishes in Regions:
1 - New Orleans: Jefferson,
Orleans, Plaquemines, St.
Bernard, St. Charles, St. James,
St. John the Baptist, St.
Tammany
2 - Baton Rouge: Ascension,
8 - Monroe East Baton Rouge, East
7 - Shreveport Feliciana, Iberville, Livingston,
Pointe Coupee, St. Helena,
Tangipahoa, Washington, West
Baton Rouge, West Feliciana
3 - Houma: Assumption,
6 - Alexandria Lafourche, Terrebonne
4 - Lafayette: Acadia,
Evangeline, Iberia, Lafayette, St.
Landry, St. Martin, St. Mary,
Vermilion
5 - Lake Charles: Allen,
2 - Baton Rouge Beauregard, Calcasieu,
Cameron, Jefferson Davis
5 - Lake 6 - Alexandria: Avoyelles,
Catahoula, Concordia, Grant,
Charles LaSalle, Rapides, Vernon, Winn
4 - Lafayette
1 - New 7 - Shreveport: Bienville,
Bossier, Caddo, Claiborne,
Orleans DeSoto, Lincoln, Natchitoches,
3 -Houma Red River, Sabine, Webster
8 – Monroe: Caldwell, East
Carroll, Franklin, Jackson,
Madison, Morehouse, Ouachita,
Richland, Tensas, Union, West
Carrol1
Adapted from the Louisiana Workforce Commission RLMAs
http://www.laworks.net/Downloads/lmi/RLMAsDefined.pdf
5Model Structure
Each model has two components: the demand for healthcare provided by nurses and the supply
of nurses available to provide that care. The overall model for each nurse type (RNs, APRNs,
and LPNs) is comprised of nine separate Excel spreadsheets. Each regional model ‘stands alone’
(the data which drives the model’s components are contained within each file). The state model
is dynamic with each of the regional models; changes to a regional model’s assumptions are
reflected in the state model for each nurse type.
The Demand Model
The demand side of the model marries three general pieces of information:
population demographics, in particular the size of the population;
the amount of healthcare (by setting) required by the population; and,
the number of nurses required to provide each ‘unit’ of healthcare, which is described
below.
Population Demographics
The population in each of the regions in the state is analyzed by age, gender, and degree of
urbanization because these three factors are highly related to the utilization of healthcare. The
analysis is done at the Parish level and population projections are made through the year 2020
using the 2010 decennial census figures by age and gender for each Parish as the basis for
demographic projections forward2. A standard cohort survival model was used that aged the
population each year and applied standard survival rates from the U.S. Department of Health and
Human Services, Centers for Disease Control3. New births were estimated using the birth rates
per 1,000 females between the ages of 15 and 44 in each Parish from Louisiana state data. The
population projections were then aggregated to the regional level and placed into nine age
groups: 0 to 4, 5 to 14, 15 to 17, 18 to 24, 25 to 44, 45 to 64, 65 to 74, 75 to 84, and 85+ by
gender. They were further divided into “Urban Parishes” and “Rural and Suburban Parishes”
within each region. Parishes which contained the major metro area for that region were
considered “urban.” All others were considered “non-urban.” The projections assume no net
population migration.
The age categories are based on the Health Resources Service Administration’s (HRSA) national
model4. They were found to be the break points where the demand for health care changed
significantly with age (see Appendix A).
Amount of Healthcare Required By a Population
The demand for healthcare for each age/gender/degree of urbanization population sector is
determined by marrying the population size for each sector with its anticipated use of healthcare
(“demand for nurses”). These are known and calculated for each population sector within each
of the following healthcare settings:
61. Inpatient Care measured in patient days
2. Emergency Department Visits
3. Ambulatory Visits
4. Nursing Facilities measured in resident days
5. Home Health Visits
6. Community Health measured in nurses per 10,000 population
7. Public Health measured in nurses per 10,000 population
8. Nursing Education measured in nurses per 10,000 population
9. Other – healthcare related settings other than the eight settings listed above per 10,000
population.
The link between demographics and the demand in each of the healthcare settings in each model
is used by applying a set of expected number of units (inpatient days, visits, etc.) of healthcare
per 1,000 persons in a particular category of age, gender, and degree of urbanization. The
demand figures for each setting come from a variety of sources compiled and analyzed by
HRSA. Each of these is outlined below.
Healthcare “Units” by Population Subsegments
Below are the data used to estimate the amount of healthcare “units” required by a population of
a set size (generally, 1,000) in a set period of time (generally one year). The sources vary by
healthcare setting and are based on national data which dates from 2005-2007. It is important to
note that the intensity factors used in the models can be easily modified to reflect any new
information gained regarding 2013 intensity factors, or future impacts on intensity factors.
Table 1. Inpatient Days, Per 1,000 People, Per Year
Female Male Estimates of inpatient days were
Age Urban Non- Urban Non- taken from the 2005 Nationwide
Urban Urban Inpatient Samplea divided by
0-4 1030 466 1084 509 Census Bureau population
5-17 97 42 84 30 estimates (Table 1). They were
18-24 435 337 168 68 compared with figures from the
25-44 477 271 287 137 American Hospital Associationb
45-64 637 343 726 296 and adjusted by using a scalar
65-74 1614 791 1627 820 that brought the two sets of
75-84 2366 1559 2883 1504 figures into alignment in the
85+ 4299 3548 5089 2633 aggregate.
7Table 2. Emergency Visits, Per 1,000 People Per Year
Female Male Estimates of annual emergency
Age Urban Non- Urban Non- visits per 1,000 people were made
Urban Urban from the 2005 National Hospital
0-4 645 496 703 605 Ambulatory Medical Care
5-17 294 278 307 275 Surveyc divided by Census
18-24 594 614 404 397 Bureau population estimates
25-44 451 409 378 307 (Table 2). Again, a comparison
45-64 333 260 295 214 with data from the American
65-74 370 311 367 367 Hospital Associationb was made
75-84 499 424 509 470 and a scalar applied to align the
85+ 807 689 1081 772 aggregate figures.
Table 3. Ambulatory Visits, Per 1,000 People Per Year
Female Male Estimates from the 2005
Age Urban Non- Urban Non- National Hospital Ambulatory
Urban Urban Medical Care Surveyc for
0-4 4510 3849 5020 4624 outpatient care and the National
5-17 2236 1650 2300 1712 Ambulatory Medical Care
18-24 2743 2044 1151 886 Surveyd were divided by Census
25-44 3685 2249 2017 1697 Bureau estimates to determine the
45-64 5046 3391 3741 2566 annual ambulatory visits per
65-74 7961 4945 6403 5350 1,000 persons. These rates
75-84 8031 7088 8072 5662 increase very rapidly with age as
85+ 7516 8093 9716 5361 shown in Table 3).
Table 4. Number of Persons in Nursing Homes, Per 1,000 People Per Year
Female Male Estimates from the National
Age Urban Non- Urban Non- Nursing Home Surveye divided
Urban Urban by Census Bureau population
0-44 0.5 0.2 0.6 0.2 figures produced point-in-time
45-64 1.9 1.2 2.4 0.9 estimates of the number of
65-74 11.5 5.1 9.7 3.5 persons in nursing homes per
75-84 44.9 22.3 30.5 13.9 1,000 people (Table 4).
85+ 222.9 123.5 112.2 40.2
8Table 5. Number of Home Health Visits, Per 1,000 People Per Year
Female Male
Age Urban Non- Urban Non- Home Health visits were
Urban Urban estimated from the 2005 Medical
0-17 379 211 512 824 Expenditure Panel Surveyf.
18-44 881 1048 424 278 Utilization patterns are again,
45-64 1898 519 815 2834 highly correlated with age (Table
65-74 6185 6426 2675 5247 5).
75-84 13895 11063 6179 11818
85+ 25093 24665 15238 21705
Figures for Public Health, Community Health, Nursing Education, and nurses employed in other
non-health care jobs were estimated using the 2012 annual nurse registration data5,6 from
Louisiana and the 2010 census figures.
The Number of Nurses Required to Provide each ‘Unit’ of Healthcare: Intensity
Factors
Once the projected demand was determined in each setting, that information was used to
estimate the number of nurses required to meet that demand. This was done by applying an
intensity factor, which is simply a nurse-to-healthcare-unit ratio, where the number of nurses is
expressed as a Full-Time Equivalent (FTE) and the healthcare unit is measured for each
healthcare setting (e.g., inpatient days for acute care settings).
The intensity factors were determined by using the actual ratio of
Intensity Factor =
nurses working in each healthcare setting in 2012 taken from state
nurse licensure data (RN, APRN, and LPN) to the estimated demand Number of Nurses
for that year (2012). That is, it is known how many nurses were Working In Setting
working in various settings in 2012, and how many “units” of care were _________________
provided in various settings in 2012. This provides the number of
Amount of Care
nurses measured in FTEs in each healthcare setting. These were then Provided in Setting
added together at the regional level to determine the statewide total
need for nurses in each year.
Intensity factors were estimated at the national level by HRSA for each of the healthcare settings
in 20044. The figures from HRSA have been used here to make sure the intensity factors
estimated based on the current nurse licensure data from Louisiana are reasonable (Table 6). For
example, the total FTE nurses working inpatient care involving hospital patients in Louisiana in
2012a were divided into the estimated annual demand per 1,000 patient days of care across the
state. The result was 6.91 as the intensity factor for 2012 for that setting. The HRSA estimate
for the U.S. in 2004 for inpatient care was 6.2 and projected to be 7.17 in 2010. Thus, the
estimated intensity factor for inpatient care in Louisiana for 2012 seems quite reasonable given
how close it is to the national HRSA figure.
9Calculations were done for each healthcare setting and for each type of nurse. The following
table shows the benchmark intensity factors used in each of the models based on the healthcare
setting and the type of nurse. Note that part of the utility of the model is that users may change
these intensity factors; the figures below are the ‘baseline’ or starting point for 2013.
Table 6. Intensity Factors Based on 2012 Nurse Registration Data
Setting RN LPN APRN
Ambulatory Care 0.24 0.23 0.11
Community Health 1.77 0.42 0.03
Emergency Visits 1.00 n/a 0.05
Home Health 0.36 0.23 0.001
Inpatient 6.91 1.97 0.72
Nursing Education 3.11 n/a 0.17
Nursing Facilities 0.06 0.19 0.002
Public Health 1.12 0.42 0.03
Adjustments to Demand
There are a few final adjustments to the forecast for demand for healthcare in each region. First,
for inpatient days, there are some regions where patients travel to another region for surgery or
other complex treatment. For Houma, Alexandria, Lake Charles, and Monroe, an adjustment is
made to reduce inpatient demand by 10 to 15 percent. In New Orleans, Baton Rouge, Lafayette,
and Shreveport, there is an export factor added to demand to account for the inflow of these
patients from the other four regions7. Further, it is clear that when the same intensity factor is
applied across all regions the number of nurses needed in inpatient care is not consistent with the
statewide percentage of the nurse workforce working in inpatient care. In the large metropolitan
areas like New Orleans, Baton Rouge, Lafayette, and Shreveport, the intensity factor for LPNs is
lower than in Alexandria, Monroe, Houma, and Lake Charles, where the data indicates that more
LPNs are used in inpatient care and the intensity factors are higher than the state average. The
initial intensity factors based on the state average have been calibrated to bring the number of
nurses working in inpatient care in each region in line with the expected number based on the
licensure data.
User Adjustment to Demand
As aforementioned, many of the baseline assumptions in the model can be modified in order to
see changes in demand or supply (and therefore, the gap between the two). One of those
changeable assumptions is the percent of patients coming from outside the region for
treatment regardless of where they come from such as another region, state, or anywhere else.
This allows for the estimation of change in nurse supply/demand based on scenarios such as a
large health system strategic plan which calls for the expansion of services to a larger market and
expects to draw patients from outside of the region. The impact of their strategic plan can be
seen using the model and plans for changes in the nurse workforce can be anticipated and
managed.
10Another changeable assumption is the migration of older households that may move into the
region. Current population studies for the state do not show a large influx of older people at this
time, but this could change as the economy continues to rebound. However given how sensitive
the need for healthcare is based on age, any unexpected change in the number of older citizens
would have a direct impact on the amount of healthcare needed.
The Supply Model
The supply side of the model is based on the number of nurses working in each region by their
age. It marries three pieces of information in each region:
the number of newly licensed nurses (RNs, APRNs, and LPNs);
the demographics of the nurse workforce (in particular, age); and
the work patterns of the nurse workforce (in particular, the number of hours worked).
Number of Newly Licensed Nurses
Information on the nurse workforce was obtained through examination of the early 2013 nurse
(RN, APRN, and LPN) licensure renewal data5,6. It is assumed that these figures from the
beginning of 2013 reflect the nurse workforce at the end of 2012 because most of the graduates
from nursing programs in 2012 will have passed their licensure exams and will have found jobs.
In the licensure renewal process, nurses provide their age, their licensure level (RN, APRN, or
LPN), the setting in which they work, their home zip code, and the zip code of their employer.
Beginning with the nurse licensure renewal data in early 2013, the number of nurses is projected
out through 2020. The number of nurses expected in each year is adjusted by the number of
hours worked given their age using the hours worked reported in the nurse licensure data by age.
This estimates the supply of nurses measured in FTEs.
Nurse Demographics (Age)
Each model has a “Master Supply” section that contains the number of nurses in each year from
2010 projected through 2020. The key data are from the latest 2013 licensure renewal data. The
supply is broken down into the number of nurses (RNs, APRNs, and LPNs - each have their own
models) by age from 22 years through 75 years in one-year increments. The number of nurses is
converted to FTEs based on their age and work setting (historical data shows how many hours
nurses tend to work based on their age and work setting).
Aging the Nurse Workforce
Once the number of nurses in each age category is established, they are progressed to the next
oldest year to project the number in the future, accounting for any expected changes in work
patterns (hours-worked) based on age. Those who are 75 years are assumed to be fully retired in
the year they reach age 76. This is done for each year to 2020. The number of nurses is
converted to FTEs using the method described above. This gives a reasonable idea of the number
11of FTEs available in each region and statewide by type of nurse through 2020 based on the
current number of licensed nurses.
As each age group of nurses becomes older, the number of FTEs generated by that group
decreases and more nurses are retired. This leaves potential job openings for new nurses as long
as there is projected demand in the region. The model allows us to replace those nurses with a
specific number of newly licensed nurses. Based on nurse licensure data in 2012, the state
currently injects 2,600 newly licensed RNs into the state supply, 350 APRNs, and 1,100 LPNs.
These are all newly licensed nurses in Louisiana, regardless of where they were educated.
It is helpful to understand how the current supply of nurses in the state is distributed and how
much longer they are likely to work. See Appendix B for further discussion on this topic.
Nurse Work Patterns
For RNs, the hours worked for all nurses currently working was analyzed by their age statewide5.
A statistical relationship was identified that explains about 97% of the variation in hours worked
by their age. This is a very strong relationship and provides an estimate of the expected hours
worked for each age. That number of hours is then divided by 40 hours per week as the
benchmark for a full-time nurse. The resulting percent is then multiplied times the number of
nurses in each age category to estimate the FTEs available. Below is a graph that shows the
relationship between age and hours worked for RNs and the equation that was used (Figure 1).
The dependent variable, y, is hours worked per week. The horizontal axis (x) is the age that
begins at 20 and ends at just less than 80.
Figure 1. Number of Hours Worked, RNs, By Age
Model Fitting
45.00
40.00
35.00
30.00
25.00
Hours
20.00
15.00 y = -0.0006x3 + 0.0753x2 - 3.0109x + 76.638
R² = 0.9688
10.00
5.00
-
0 10 20 30 40 Age 50 60 70 80
Note: Demonstration of the strength of the relationship between the age of RNs and hours worked.
12As the age of current RN workforce progresses in the model, an estimate can be made of the
total number of hours nurses will be working by that workforce in that point in time which is
defined as an FTE nurse. This can be achieved by exploiting the very close relationship of the
age of the nurse and the hours worked. That is, the number of nurses in FTEs that will be
working each year can be predicted based on their current ages because it is known how many
hours they will work in the future based on their age. Figure 1 demonstrates the strength of the
relationship between the age of RNs and hours worked.
For LPNs, the licensure data6 does not include hours worked per week. To make this estimate,
the newly released “The U.S. Nursing Workforce: Trends in Supply and Education”g report from
HRSA was reviewed. The study includes estimates of average hours per week worked by both
RNs and LPNs by age category based on Census data from 2010 and the American Community
Survey (ACS) from 2008 through 2010h. The estimates from analysis of Louisiana data and the
Census analysis are almost identical for RN data. The LPN relationship shows that LPNs tend to
work more hours per week after the age of 60 than RNs. The hours worked prior to that age are
about the same as for RNs. Therefore, in the Louisiana LPN models, an adjustment was made to
the hours worked as a percent of full-time based on the HRSA relationship described above.
These data are divided by 40 hours per week and the resulting ratio is then used to convert the
number of nurses to FTEs.
For APRNs the same analysis was done as for RNs5. The age range of APRNs begins at age 25
rather than age 20, because they have more years in training and experience prior to becoming
licensed as an APRN. The chart and relationship below shows the estimated hours worked per
week by age (Figure 2). In general it shows higher levels of hours worked during middle age
than RNs and the hours fall off more slowly after age 60. There is also more variation across
APRNs as they get older. Thus, the relationship explains about 83% of the variation in hours
worked based on age.
Figure 2. Number of Hours Worked, APRNs, By Age
Model Fitting
45
40
35
30
25 y = -0.02x2 + 0.8397x + 33.833
Hours
20 R² = 0.8255
15
10
5
0
26 31 36 41 46 51 56 61 66 71 78
AGE
Note: The chart shows the relationship between age of APRNs and hours worked per week.
13Using these relationships, the expected hours per week were divided by 40 to estimate the FTEs
for APRNs based on their age and that ratio was used to convert APRNs to FTEs in each model.
Nursing Workforce and FTEs
RNs
The number of FTEs is significantly lower than the number of licensed nurses. This is not only
because a number of licensed nurses work part-time, but also because only 88% of licensed
nurses are actively working full-time or part-time in nursing. The rest are out of the active labor
force because of retirement, family obligations, return to school, unemployment, being employed
in a field outside of nursing, or seeking a job outside of nursing. Further, there are nurses who
are active in administrative positions, involved in research, or in a job that is outside the major
healthcare settings listed such as working as a school nurse or as a consultant. The following
table shows a detailed breakdown of licensed RNs by employment category and indicates which
are in the forecasting model (shown in gray) and those that are not.
Table 7. Louisiana RNs, 2012
Number of Proportion
Setting* RNs of Total
Academic Setting 997 1.9%
Ambulatory Care 3,533 6.8%
Community Health 812 1.6%
Home Health 3,383 6.6%
Hospital 30,091 58.3%
Nursing Home/Extended Care/Assisted Living 1,694 3.3%
Public Health 515 1.0%
Other-Health Related 4,604 8.9%
Licensed RNs Employed in the Model: 45,629 88.5%
Adjustment to FTEs in the models reduce this figure to: 39,016 --
Unemployed looking for a job as a nurse - unemployed/active
RN workforce 1,562 3.0%
Active RN Workforce 47,191 91.5%
Unemployed not seeking work as a nurse 2,628 5.1%
Retired RNs 615 1.2%
Working in nursing only as a volunteer 188 0.4%
Subtotal: Unemployed Licensed RNs Choosing Not to Work 3,431 6.7%
Other-Non-Healthcare-Related RNs working 963 1.9%
Total Licensed RNs 51,585 100.0%
*Self-reported in annual registration data, 2012.
14As the table above shows, the Louisiana workforce model includes about 88% of licensed RNs5.
Further, those who are unemployed and looking for a nursing job are part of the workforce. The
rest either choose not to work, or are working in a non-healthcare-related job. This converts to
just over 39,000 FTEs for the number of RNs working because of (1) their age distribution and
(2) the 5,213 (11.4% of the RNs employed) who work part-time.
APRNs
As shown in Table 8, there are 4,133 licensed APRNs in the state5. A little more than 41% of
employed APRNs work in an array of ambulatory and community settings and a little over 40%
work in the hospital. Approximately 85% of the APRNs were working full-time and 15% were
working part-time. The number of employed APRNs (full-time and part-time) were converted to
FTEs. Unemployment or choosing not to work is just about 3% while APRNs working in a role
other than healthcare is less than 1%.
The demand for APRNs is expected to grow as shortages are anticipated in the primary care
workforce and changes in provider reimbursement are expected to create demand for more cost-
efficient primary care providers (Appendix C).
15Table 8. Louisiana APRNs, 2012
Number of Proportion
Setting*
APRNs of Total
College Student Health Clinic 16 0.4%
Emergency Department 86 2.1%
HIV/AIDS Clinic 7 0.2%
Hospital 1,664 40.3%
Medicine Clinic 25 0.6%
Nursing Home 57 1.4%
Outpatient Clinic 653 15.8%
Pediatric Clinic 60 1.5%
Physician Office 425 10.3%
Private Clinic 193 4.7%
Rural Clinic 205 5.0%
School Clinic 47 1.1%
School of Nursing 78 1.9%
Urban Clinic 19 0.5%
Women's Health Clinic 37 0.9%
Other – Health Related 292 7.1%
Unknown 99 2.4%
Licensed APRNs Employed in Healthcare Settings in the Model: 3,963 95.9%
Adjustment to FTEs in the models reduce this figure to: 3,609
Unemployed looking for a job as a nurse - unemployed/active
APRN workforce 63 1.5%
Active APRN Workforce 4,026 97.4%
Unemployed not seeking work as a nurse 51 1.2%
Retired APRNs 10 0.2%
Working in nursing only as a volunteer 10 0.2%
Subtotal: Unemployed Licensed APRNs Choosing Not to Work 71 1.7%
Other-Non-Healthcare-Related APRNs working 36 0.9%
Total Licensed APRNs 4,133 100.0%
*Self-reported in annual registration data, 2012. The APRN data are not part of the previous RN
data table and were calculated separately.
16LPNs
The LPN workforce is distributed across healthcare settings and other categories differently6.
Table 9 shows a breakdown of the LPN workforce statewide. LPNs have a much higher
unemployment rate than RNs. Another difference is that one of the categories used in the LPN
licensure data to identify what type of job they are doing is called “Agency/Contract”. A
breakdown of the LPNs in this category is shown in the last rows of the table and these numbers
have been allocated to the appropriate healthcare settings. Also, there are no LPNs working in
Emergency Departments or in Nursing Education. LPNs are much more concentrated in Nursing
Facilities and Ambulatory Treatment such as clinics and doctors’ offices. Louisiana has a higher
intensity factor for LPNs in hospitals doing inpatient care than most other states, suggesting
Louisiana hospitals employ more LPNs proportionately than the national average.
Table 9. Louisiana LPNs, 2012
Setting* Number of Proportion
LPNs of Total
Academic Setting - 0%
Ambulatory Care 3,401 16.3%
Community Health 193 0.9%
Home Health 2,146 10.3%
Hospital 4,569 21.9%
Nursing Home 5,411 25.9%
Public Health 193 0.9%
Other Health Related 2,414 11.6%
Unemployed 2,069 9.9%
Total LPNs in Workforce Model 20,396 97.7%
Adjustment to FTEs in the models reduce this figure to: 19,838
Choosing not to work 51 0.2%
Other-Non- Healthcare-Related LPNs working 425 2.0%
Total Licensed LPNs 20,872 100.0%
There were 551 LPNs who reported ‘Agency/Contract’ as their work setting. They were allocated into
the settings above as such: Hospital (175); Nursing Home (62); Home Health (122);
Ambulatory Care/Office (42); Other (150).
*Self-reported in the registration data.
Another important point is that the LPN licensure data is based on the region of residence and
not on the region of employment. This is due to differences in data captured in the LPN
licensure renewal process. With regard to 2013 registrations, work location for all LPNs was not
available (this information was available for RNs and APRNs). Therefore, the regional models
for LPNs are based on where the nurses live, not work. Hence, it is not possible to accurately
allocate where (what region) LPNs work, nor accurately remove those LPNs from the regions
based on unemployment rates for LPNs. This is discussed further in the next section (Updating
the Supply Forecast). The end result is that the LPN models, unlike the RN and APRN
models, include those nurses who are unemployed and looking for work in healthcare. So,
17it is important when using the models to remember that the supply figures in the RN and APRN
models do not include the reservoir of nurses looking for work in healthcare. In the case of RNs
this is about 3% and for APRNs it is about 1.5%. The supply figures in the LPN models, on the
other hand, already include these nurses. Thus when there is a surplus of LPNs in a region, part
of that surplus includes unemployed nurses.
Updating the Supply Forecast
The Louisiana Multi-Regional Statewide Nursing Workforce Forecasting Model is designed so
that baseline data for each year can be replaced with the most recent nurse licensure data. That
way, any real changes to the size or type of the nurse work force will be reflected in the model
going forward to 2020.
Each year when the new licensure data5,6 becomes available, the models will be updated. This
will be done by taking the number of nurses in each region by their age and entering it into the
prior year. Again, this is because the number of licensed nurses at the beginning of the year is
used as the figure for the number at the end of the prior year. Performing this function is a
simple operation in Excel. So, for example, in early 2014 when the new licensure renewal data
for nurses is available, the number in each region by each year of age is inserted over the figures
for 2013 and the models will automatically reforecast the change in supply. Any nurses who do
not renew their license are automatically accounted for in the new licensure data.
It is important to understand why new graduates are entered into the model each year using the
licensure information. Nurses entering the workforce are spread out across various age
categories. One cannot assume that they are all in their early 20s or estimate how many are
expected in each age group. This is especially true of APRNs. In 2012 there were 413 newly
licensed APRNs and only 13% of them were between the age of 25 and 29. Almost half, 47%,
were between 30 and 39 years old and the remaining 40% were 40 years and older. While RNs
and LPNs are more concentrated in the lower age groups, they are also spread across a wide
range of ages. Given the distribution of age in an entering cohort of nurses, it is impossible to
assign them to their proper age group for each future year in each model. Figure 3 shows the age
distribution of RNs at the time of obtaining their first license. Further, there is no way of
predicting which region they will become employed in. This is the reason the models are
updated with the licensure renewal data each year. The new data indicates the current age
distribution of the workforce by the region they are employed in and any new nurses are placed
in the appropriate age category and region.
18Figure 3. Age of RNs at Initial Licensure, 2012
400
350
300
250
200
150
100
50
0
20 22 24 26 28 30 32 34 36 38 40 42 44 46 48 50 52 54 56 58 60 62 64 66 68
Note: Age distribution of RNs at the time of initial licensure.
By design, the models present nurse forecasts by region. However, there is no way to estimate
where newly licensed nurses will choose to work (either by setting and/or region). The number
of newly licensed nurses that are in each region is known by residence, but what is not known is
where they will choose to work. For RNs and APRNs, this is not a problem because the regional
designation used for each nurse is based on where they are actually employed rather than where
they reside (that is, there is no need to estimate where they work based on where they reside;
where they work is known). This eliminates several other potential problems which are known to
be true:
1. A significant number of nurses live in one region and work in another,
2. Some nurses live outside the state and are licensed and work in Louisiana,
3. Some new nurses give various addresses depending on where they went to college and
when they took their licensure exam.
For LPNs the licensure data does not identify where the nurses’ primary job is located 6. This
raises a problem due to nurses commuting between regions. To adjust regional supply figures, a
matrix showing where a large sample of LPNs (n = 9,470)6 live and work was generated (Table
10). The commuting patterns for the sample of LPNs were compared to the commuting patterns
of RNs between regions and the two were very similar5.
19Table 10. Louisiana, Commuting Matrix of LPNs
Work Region
Residence New Baton Lake
Region Orleans Rouge Houma Lafayette Charles Alexandria Shreveport Monroe
New Orleans 95.4% 3.4% 0.6% 0.1% 0.1% 0.0% 0.1% 0.1%
Baton Rouge 8.9% 89.6% 0.3% 0.5% 0.1% 0.4% 0.0% 0.3%
Houma 7.5% 6.3% 82.8% 3.4% 0.0% 0.0% 0.0% 0.0%
Lafayette 1.1% 1.4% 0.8% 92.9% 2.4% 0.9% 0.2% 0.2%
Lake Charles 0.3% 0.7% 0.3% 5.0% 88.8% 4.2% 0.4% 0.3%
Alexandria 0.6% 2.2% 0.2% 3.1% 2.6% 85.4% 2.5% 3.3%
Shreveport 0.2% 0.1% 0.0% 0.3% 0.1% 1.0% 94.9% 3.5%
Monroe 0.2% 0.1% 0.1% 0.4% 0.1% 2.4% 6.7% 90.0%
Note: Matrix showing where LPNs live and work.
The rows in the table indicate where the sample of LPNs live and the columns indicate where
they work. The main diagonal in grey shows the percent of LPNs that both live and work in the
same region. So, for example, while 95.4% of LPNs both live and work in New Orleans, 8.9%
commute in from Baton Rouge, and 7.5% come from Houma. When the nurses commuting from
all the other regions are added and those who commute from New Orleans to other regions are
taken out, the net result is that New Orleans has 14.1% more LPNs working there than are living
there.
These figures are used in each regional LPN model to either increase the total FTEs available or
reduce the number of FTEs available depending on whether the region has a net inflow or
outflow of nurses. This adjusted supply is then compared with regional demand to identify the
number of job openings in each year for LPNs in each region and across the state. In sum, the
commuting patterns of LPNs are used to adjust the number of LPNs working in a region as
compared to where they reside.
Comparing Supply and Demand
Once the demand for healthcare is estimated for each health care setting, it is used to create a
profile of the FTE nurses needed in each year. There is a separate table and tab in each regional
model that breaks down demand into healthcare categories. The total demand is then added
across all healthcare settings for each year. The supply of FTE nurses available in each region is
then compared to the demand. The total demand and supply of nurses is measured in FTEs. The
supply of nurses in each year is subtracted from demand to show the number of estimated
unfilled FTEs.
20Statewide Models
There is a set of eight regional models for each level of nursing workforce. There is also a
statewide model for each level of nurse that automatically polls the regional models and
aggregates supply and demand.
The state model for each type of nurse determines the supply of nurses by taking the total FTEs
for each year in each regional model and summing them. This sets a baseline of the existing
nurse workforce that is presently in place and adjusts it as nurses get older and work less hours.
The estimated annual additional FTEs from new licensees and those recruited from outside of the
region are added to the baseline supply in each year from each regional model. Thus, the total
supply of nurse FTEs is estimated statewide in each year to 2020.
The model also includes a figure which shows the estimated unfilled FTEs for each region in
each year across the state. That is, the tables and graphs in the statewide models identify where
the greatest need will be for the nurses joining the workforce in each year.
Major Findings:
If the current conditions remain constant, that is, if the population demographics, number and
type of nurse workforce, level of exporting care to patients outside of the region, and the level of
demand for care by the population (intensity factors) remain the same, the current forecast shows
that there will be large regional differences in shortages and surpluses across Louisiana for RNs,
APRNs, and LPNs.*
*For the purposes of this report, a surplus is considered to be anything exceeding 5% of the
annual demand. The numerical cut-off for balancing supply and demand will need to be
determined by each region.
Registered Nurses (RNs)
Nearly 60 percent of RNs are employed in Louisiana hospitals.
Almost 10 percent of RNs in Louisiana are unemployed or choose not to work.
A statewide shortage for RNs is expected to continue through 2016. In 2017, the
supply of RNs will just meet the demand until 2020 based on current conditions.*
2013 shows a shortage of full-time equivalent (FTE) RNs (41,397 supply) compared
to demand (44,472) and varies significantly by region.
Shortages will exist through 2020 for RNs in the following regions: Baton Rouge,
Lafayette, and New Orleans.
There will be a surplus of RNs in Alexandria, Houma, and Lake Charles through
2020.
*Changes in health care policy/health care reform, patient care delivery, nurse
intensity, or population shift will affect demand for RNs, APRNs, and LPNs
21Advanced Practice Registered Nurses (APRNs)
The demand for APRNs (FTEs) in 2013 was estimated at 5,282, with a supply of
3,959, leaving a gap of 1,323 FTEs. The ultimate size of this gap over the next
decade will depend on the changing patterns of APRN utilization and healthcare
policy as we go forward.
Based on the current intensity (nurse-to-healthcare-unit ratio) for APRNs in Louisiana
and a growth rate of 4% annually for APRNs in both the inpatient and ambulatory
care settings, the demand for APRNs will be almost 7,000 FTEs by 2020. If, state-
wide, the number of new APRNs entering the workforce remains at about 10% (the
recent rate in Louisiana), the state-wide shortage of APRNs will continue at its
current level until 2020.
There will be a demand for APRNs through 2020 in the following regions: Baton
Rouge, Lafayette, New Orleans, and Shreveport.
Licensed Practical Nurses (LPNs)
The majority of LPNs are employed in long-term care facilities (5,411) and hospitals
(4,569).
About 10 percent of LPNs are unemployed.
The LPN ratio of nurses to patients is much higher in Louisiana hospitals, especially
rural facilities, than other states in the country.
There will be a shortage of LPNs through 2020 in the following regions: Baton
Rouge, New Orleans, and Houma.
A surplus in the number of FTE LPNs will extend through 2020 in Alexandria,
Lafayette, and Monroe.
Statewide, the demand for LPNs will extend through 2013. Beginning in 2014 and
extending through 2020, the supply of LPNs will just meet the demand.
22Regional and Statewide Nursing Workforce Forecasts for Louisiana
Forecasts represent
predictions based on the
current conditions.
8 - Monroe Changes in health policy,
7 - Shreveport patient care delivery, nurse
intensity, or population
shift, and implementation
of all, or components of
6 - Alexandria the Affordable Care Act,
will affect demand for
RNs, APRNs, and LPNs in
Louisiana.
2 - Baton Rouge
5 - Lake
Charles
4 - Lafayette
1 - New
Orleans
3 -Houma
Forecasts by Regional Labor Market Area (RLMA):
Region 1 (New Orleans RLMA): Jefferson, Orleans, Plaquemines, St. Bernard, St. Charles, St.
James, St. John the Baptist, St. Tammany Parishes
Forecast
RNs – There will be a demand for RNs through 2020
APRNs – There will be a demand for APRNs through 2020
LPNs – There will be a demand for LPNs through 2020
Region 2 (Baton Rouge RLMA): Ascension, East Baton Rouge, East Feliciana, Iberville,
Livingston, Pointe Coupee, St. Helena, Tangipahoa, Washington, West Baton Rouge, West
Feliciana Parishes
Forecast
RNs – There will be a demand for RNs through 2020
APRNs – There will be a demand for APRNs through 2020
LPNs – There will be a demand for LPNs through 2020
23Region 3 (Houma RLMA): Assumption, Lafourche, Terrebonne Parishes
Forecast
RNs – There will be a surplus of RNs through 2020
APRNs – There will be a demand for APRNs through 2016. Beginning in 2017 and
extending through 2020, supply will just meet the demand for APRNs.
LPNs – There will be a demand for LPNs through 2020
Region 4 (Lafayette RLMA): Acadia, Evangeline, Iberia, Lafayette, St. Landry, St. Martin, St.
Mary, Vermilion Parishes
Forecast
RNs – There will be a demand for RNs through 2020
APRNs – There will be a demand for APRNs through 2020
LPNs – The supply of LPNs will exceed the demand through 2020
Region 5 (Lake Charles RLMA): Allen, Beauregard, Calcasieu, Cameron, Jefferson Davis
Parishes
Forecast
RNs – A surplus for RNs will begin in 2013 and extend through 2020.
APRNs – There will be a demand for APRNs through 2017. Beginning in 2018, the
supply of APRNs will just meet the demand through 2020.
LPNs – There will be a surplus of LPNs through 2016, followed by a closing of the gap
between supply and demand beginning in 2017, subsequently leading to a
demand for LPNs in 2018 which will extend through 2020.
Region 6 (Alexandria RLMA): Avoyelles, Catahoula, Concordia, Grant, LaSalle, Rapides,
Vernon, Winn Parishes
Forecast
RNs – There will be a surplus of RNs through 2020.
APRNs – The supply of APRNs just meets demand through 2013. Beginning in 2014 the
supply of APRNs will exceed demand through 2016. In 2017 the gap between
supply and demand will begin to close leading to a demand for APRNs in 2018
extending through 2020.
LPNs – There will be a surplus of LPNs through 2020.
Region 7 (Shreveport RLMA): Bienville, Bossier, Caddo, Claiborne, DeSoto, Lincoln,
Natchitoches, Red River, Sabine, Webster Parishes
Forecast
RNs – Beginning in 2013, the supply of RNs will just meet demand through 2014. There
will be a surplus of RNs in 2015 which will extend through 2020.
APRNs – The demand for APRNs will exceed supply through 2020.
LPNs – Supply will just about meet the demand for LPNs through 2014, but beginning in
2015 the demand for LPNs will exceed the supply through 2020
24Region 8 (Monroe RLMA): Caldwell, East Carroll, Franklin, Jackson, Madison, Morehouse,
Ouachita, Richland, Tensas, Union, West Carroll Parishes
Forecast
RNs – In 2013, the supply of RNs will just meet demand. There will be a surplus of RNs
beginning in 2014 extending through 2020.
APRNs – For APRNs, supply will exceed demand beginning in 2013 continuing through
2020.
LPNs – A surplus of LPNs is predicted to extend through 2020.
Statewide:
Forecast
RNs – There will be a demand for RNs through 2016. The gap between supply and
demand will begin to close in 2017, at which time the supply will just meet the
demand for RNs through 2020 based on current conditions.
APRNs – There will be a statewide demand for APRNs through 2020.
LPNs – The demand for LPNs will extend through 2013. Beginning in 2014 and
extending through 2020, the supply of LPNs will just meet the demand.
25References and Primary Data Sources
1. Louisiana Health Works Commission Regional Labor Market Area Map
http://www.laworks.net/Downloads/lmi/RLMAsDefined.pdf
2. The 2010 Decennial Census of Population for Louisiana, population characteristic
including age, and gender by Parish, U.S. Department of Commerce, Bureau of
the Census, Washington, DC.
3. Data from The Centers for Disease Control and Prevention, National Center for
Health Statistics mortality data and US Census Bureau population data, 2007.
4. The HRSA Nursing Supply Model: Updated Technical Report and User Guide.
Report prepared for the Bureau of Health Professions, Health Resources and
Services Administration, April 2009.
5. Licensure Renewal registration data for RNs and APRNs from the Louisiana State
Board of Nursing for 2012 and 2013.
6. Licensure Renewal data for LPNs from the Louisiana State Board of Practical
Nurse Examiners for 2012 and 2013.
7. Louisiana Health Information Network (LHIN) 2009 Louisiana State Inpatient
Database, a service of ShareCor that brings together the data collection efforts of
Louisiana healthcare facilities, the Louisiana Hospital Association,
the Metropolitan Hospital Council of New Orleans, Thomson Reuters, and public
and private data and technology organizations to create a statewide information
resource of patient-level health care data. This data enables research on a broad
range of health policy issues, including cost and quality of health services, medical
practice patterns, access to health care programs, and outcomes of treatments.
Secondary Data Sources not Directly Relied Upon for Estimates
a. The 2005 Nationwide Inpatient Sample (NIS) - one of a family of databases and software
tools developed as part of the Healthcare Cost and Utilization Project (HCUP), a Federal-
State Industry partnership sponsored by the Agency for Healthcare Research and Quality
(AHRQ). The NIS is the largest nationwide all-payer hospital inpatient care database in
the U.S. Each year the NIS contains data from approximately eight million hospital stays
– all discharge records from approximately 1,000 hospitals selected from HCUP State
Inpatient Databases (SID) data. For a complete description of the survey, see “HCUP,
Design of the Nationwide Inpatient Sample (NIS), 2005”, June 13, 2007, Healthcare Cost
and Utilization Project, Agency for Healthcare Research and Quality, 540 Gaither Road,
Rockville, MD 20850.
b. American Hospital Association Annual Survey, an annual survey of hospitals in the
United States and associated territories, produces an Annual Survey Database. This
26database includes data elements containing demographic, utilization, financial, and other
hospital characteristics of interest to health care researchers. For a full description, see
“Overview of the HCUP American Hospital Association, Annual Survey SAS®
Databases 1987-2010”, December 9, 2011.
c. National Hospital Ambulatory Medical Care Survey (NHAMCS) is a national survey
designed to collect data on the utilization and provision of ambulatory care services in
hospital emergency and outpatient departments. Findings are based on a national sample
of visits to the emergency departments and outpatient departments of non-institutional
general and short-stay hospitals. For a full description see www.cdc.gov/nchs/ahcd.htm
d. National Ambulatory Medical Care Survey (NAMCS) is a national survey designed to
meet the need for objective, reliable information about the provision and use of
ambulatory medical care services in the United States. Findings are based on a sample of
visits to non-federal employed office-based physicians who are primarily engaged in
direct care. For a full description see www.cdc.gov/nchs/ahcd.htm
e. National Nursing Home Survey (NHHS) is a continuing series of national sample surveys
of nursing homes, their residents and their staff. For a full description see
www.cdc.gov/nchs/nnhs.htm
f. Medical Expenditure Panel Survey (MEPS) is a set of large-scale surveys of families and
individuals and their medical providers, and employers across the United States which is
conducted annually. For a full description see www.ahrq.gov/resear/data/mes/index/html
g. “The U.S. Nursing Workforce: Trends in Supply and Education”, Health Resources
and Services Administration, Bureau of Health Professions, National Center for
Health Workforce Analysis, April 2013.
h. 2008-2010 American Community Survey 3-Year Estimates is an annual survey of
socioeconomic information every year covering more than 40 topics. The estimates are
available in detailed tables for the nation, all 50 states, the District of Columbia, Puerto
Rico, every congressional district, every metropolitan area, and all counties and places
with populations of 20,000 or more.
i. Biviano MB, Tise S, Fritz, M, Spencer W, and Dall TM. (2007). “What is Behind
HRSA’s Projected U.S. Supply, Demand, and Shortages of Registered Nurses?”
j. The Nursing Demand Model: Development and Baseline Forecasts. Report prepared
for the Bureau of Health Professions, Health Resources and Services Administration,
September 2004.
k. Louisiana State Board of Nursing 2011 Annual Report
l. Louisiana State Board of Nursing 2012 Annual Report
27You can also read