Failure Mechanism and Strength Prediction Model of T-Joint of Composite Sandwich Structure
←
→
Page content transcription
If your browser does not render page correctly, please read the page content below
metals
Article
Failure Mechanism and Strength Prediction Model of T-Joint of
Composite Sandwich Structure
Yang Liu, Mingxuan Li, Xiaofeng Lu * and Xiaolei Zhu *

                                          School of Mechanical and Power Engineering, Nanjing Tech University, Nanjing 211816, China;
                                          liuyang-pro@njtech.edu.cn (Y.L.); lmx9989w@njtech.edu.cn (M.L.)
                                          * Correspondence: xflu@njtech.edu.cn (X.L.); zhuxiaolei@njtech.edu.cn (X.Z.)

                                          Abstract: Composite sandwich structures are widely used in many fields. T-joint plays a significant
                                          role in the composite sandwich structural connection. In this paper, a type of adhesive T-joint was
                                          manufactured and tested under bending and shearing load. According to the experiment, the finite
                                          element model was established to reveal the failure process. A strength prediction model was
                                          proposed based on the simulation. The results showed that the T-joint’s lower connector and the
                                          web’s lower face panel controlled its maximum load-bearing capacity, and the failure mode is the
                                          fiber compressive damage. The predicted ultimate bearing capacity of the T-joint showed a good
                                          agreement with the simulation, and the maximum relative error was less than 3%.

                                          Keywords: T-joint; failure mechanism; sandwich structure; strength prediction

                                1. Introduction

                                               The composite sandwich structure has become a potential lightweight alternative
Citation: Liu, Y.; Li, M.; Lu, X.; Zhu,   option in aviation, aerospace, navigation, construction, vehicle engineering, rail transit, and
X. Failure Mechanism and Strength         other fields due to its excellent specific stiffness, specific strength, functional integration,
Prediction Model of T-Joint of            and designability. In the marine industry, the lightweight of the superstructure can lower
Composite Sandwich Structure.
                                          the ship’s center of gravity, improve the ship’s navigation performance, and save fuel. Due
Metals 2021, 11, 1197. https://
                                          to the large scale and complex structure, it is inevitable to apply various connections in
doi.org/10.3390/met11081197
                                          the superstructure. Due to the unweldability of fiber-reinforced composites, the bonding
                                          technology of composites is the key to restricting the application of composites. Due to the
Academic Editor: Bin Liu
                                          unique structure form of the composite sandwich structure, the mechanical properties of
                                          the joints have become a hot spot [1].
Received: 10 June 2021
Accepted: 22 July 2021
                                               Composite structures were widely used in load-bearing structures. The composite
Published: 27 July 2021
                                          sandwich panels could meet bearing requirements with a lighter mass than aluminum alloy
                                          or steel. The sandwich panel was the main body of composite structures. Its mechanical
Publisher’s Note: MDPI stays neutral
                                          properties seriously affect the overall performance of the structure. Hou et al. [2], Bedon [3],
with regard to jurisdictional claims in
                                          Zhao et al. [4], and Fan et al. [5] subjected the sandwich panels with different lattice cores
published maps and institutional affil-   to edgewise compression loading. Failure modes were observed. The interfacial properties
iations.                                  between core and face sheets affect the overall property of the panels significantly. With
                                          different interfacial strengths, global buckling, interface debonding, local buckling, or
                                          strength fracture may occur. Bending load is another major load that the structure needs
                                          to bear. Lu [6], Li [7], Serna et al. [8], Liu [9] and Sun et al. [10] investigated the sandwich
Copyright: © 2021 by the authors.
                                          panels’ mechanical responses under bending load. The results showed that the different
Licensee MDPI, Basel, Switzerland.
                                          combinations of face and core would make the failure modes various. When the interface is
This article is an open access article
                                          strong enough, the face sheets’ strength can be fully exploited. The core in bending serves
distributed under the terms and           as support between two face sheets. The sandwich panels with good bending and edgewise
conditions of the Creative Commons        compressing properties would provide a good load-bearing capacity if the connections are
Attribution (CC BY) license (https://     strong enough.
creativecommons.org/licenses/by/               The primary connection forms of composite materials include mechanical connection,
4.0/).                                    adhesive connection, suture connection, Z-PIN connection, mixed connection, etc. Due

Metals 2021, 11, 1197. https://doi.org/10.3390/met11081197                                                  https://www.mdpi.com/journal/metals
Metals 2021, 11, 1197                                                                                             2 of 19

                        to the limitation of equipment, suture connection and Z-pin connection are only used as
                        auxiliary means, which cannot meet the requirements of mass manufacturing in terms of
                        construction efficiency [11]. As the bonding technology of composite materials becomes
                        more and more mature, its application in production and daily life is increasing. This
                        benefits from the researchers’ in-depth study on the bonding technology of composite
                        materials [12]. On the other hand, the bonding performance of adhesive materials is getting
                        better, while the price is reduced, which makes its cost performance significantly improved.
                        The research on the bonding of composite materials began in the 1940s. Aimmanee et al. [13]
                        established a mathematical model of variable stiffness bonded pipe joints to study the
                        influence of geometric shape on the bonding stress of the joints.
                              T-joint is a typical joint in structural connection, which plays the role of connecting
                        two plates or beams in different directions, such as the connection between the cabin deck
                        and the bulkhead of a ship. The joint structure is discontinuous, and the loading condition
                        is complicated. T-joints bear both shear loads and additional bending moments due to
                        eccentric loading. Therefore, the performance of the T-joint is critical to the structural
                        performance. Researchers have carried out many studies on T-joints of composite structure,
                        of which the most common method is to test the mechanical properties of T-joints. The early
                        studies were mainly focused on the failure process and failure mode in the experimental
                        procedure. With the development of finite element technology, the numerical simulation
                        method has shown significant advantages in strength check, damage mode discussion,
                        structural optimization design, and other aspects of composite connection structure. More
                        and more researchers choose to study composite material T-joint by combining experi-
                        ments and numerical simulation [14,15]. Koricho et al. [16] studied the transverse bending
                        mechanical properties of carbon fiber fabric/epoxy composite T-joint by combining exper-
                        imental and numerical simulation. T-joint was made by RTM (resin transfer modeling)
                        process. The failure mode is fiber tensile failure. The experiment and the finite element
                        simulation are in good agreement with each other. According to the experiment and the
                        simulation, the error of strength of the T-joint is about 20%, and the error of stiffness is less
                        than 3%.
                              Bigaud et al. [17–20] designed and prepared a composite T-joint and revealed the
                        influence of the failure mode of the T-joint on the ultimate bearing capacity of the structure
                        under tensile load. Mohammad et al. [21] tested the mechanical properties of composite
                        sandwich structure T-joints under different aging environments. Wu et al. [22] established
                        a finite element model of composite T-joint under tensile load based on the Tsai-Wu fail-
                        ure criterion and the cohesive model. Failure mechanism, ultimate bearing capacity, and
                        in-plane and interlayer damage behavior of the T-joint were simulated and analyzed. The
                        results show that the bearing capacity of the composite T-joint is mainly determined by
                        the failure mode, which can be realized by reducing the filling rate of the T-joint fillet or
                        changing the initiation and propagation path of delamination cracks between fillet and rib.
                        Burns et al. [23] designed and fabricated a composite T-joint bearing bending load. By opti-
                        mizing the lay-up angle, the interlaminar tensile stress was minimized. Compared with the
                        original structure, the initial bending load of failure of the optimal structure was increased
                        by 40%, and the elastic strain energy was increased by 75%. Hisada et al. [24] examined the
                        relationship between the strain distribution and the failure pattern of the deltoid in T-joint.
                        Three types of deltoid structures were used. A deltoid configuration to suppress process-
                        induced failure was established based on the experiment results and analysis to enhance
                        the T-joint’s property. Abbasi et al. [25] investigated the properties of through-thickness
                        weaving of thin metal filaments reinforced T-shaped laminate joints. Stiffener pull-off tests
                        were performed on the cured T-joints. The results demonstrate that through-thickness
                        weaving of continuous metallic filaments is highly effective at strengthening T-joints made
                        of laminated composites. Mohsen et al. [26] investigated the failure assessment and stress
                        distribution on the adhesive region in a composite T-joint under bending load case using
                        the cohesive zone method (CZM). Different adhesives and geometrical parameters are
                        considered in the investigation of micromechanical properties of reinforced fiber composite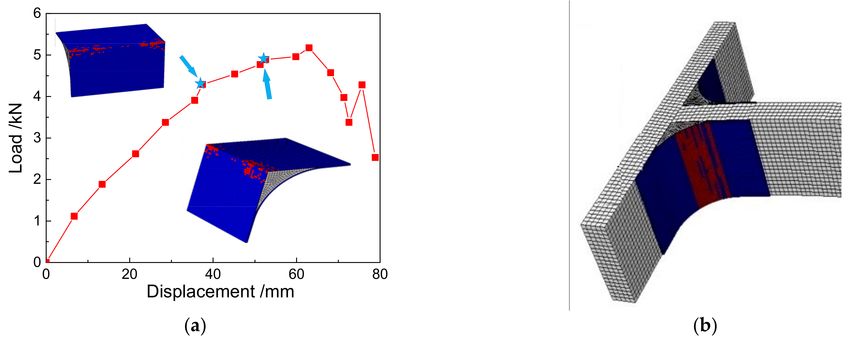
Metals 2021, 11, 1197                                                                                           3 of 19

                        adherends. The results show that the fiber volume fraction of composite adherends has
                        a significant effect on failure behavior. Ravindran et al. [27] presented an experimental
                        study into the strengthening of composite T-shaped joints using carbon nanoparticles. The
                        experiment reveals that the strengthening effect of carbon nanofibers is the best. Carbon
                        nanofibers could enhance the interlaminar fracture toughness properties. Therefore the
                        T-joint properties are improved. Guo et al. [28] investigated the failure mechanism and
                        strength improvement of a composite sandwich T-joint bonded and reinforced by fasteners
                        made of thermoplastic composite. Numerical simulation and experiment revealed that the
                        fasteners could reinforce bonded interface to avoid shear failure. The bonding strength
                        of the reinforced T-joint showed a nearly 19% increase compared to the T-joint without
                        fasteners. Bai et al. [29] investigated the mechanical behavior of the RTM (resin transfer
                        molding)-made composite T-joints under tensile loading. Initial failure and damage evolu-
                        tion behaviors of the T-joint were revealed. Progressive damage models were established
                        based on the Hashin, Chang-Chang, Hou criteria and the mixed criterion. Simulation
                        based on the mixed criterion showed the best correlation with the experiments because the
                        interlaminar delamination could be identified. Khosravani et al. [30] investigated the hon-
                        eycomb sandwich T-joints with different strain rates experimentally and numerically. The
                        influence of different loading conditions on failure and fracture of honeycomb sandwich
                        T-joints was revealed. Hou et al. [31] established a multi-objective design optimization
                        methodology on geometry and lay-ups for carbon fiber reinforced plastics (CFRP) T-joints
                        in automobiles. The CFRP T-joint was subjected to an out-of-plane bending load. The result
                        of the bending test of the optimized hat-shaped composite T-joint verified the optimization
                        methodology. Omidali et al. [20] investigated the common lightweight T-joint with trian-
                        gle fillets and modified the geometry based on FEM to increase the tension load-bearing
                        capacity. The results showed that a change in joint geometry could dramatically enhance
                        strength. Adhesion interfaces were modeled with contact elements along with the Cohesive
                        Zone Model in ANSYS. The results of numerical analyses were in good agreement with
                        experimental tests. Khosravani et al. [21] investigated composite honeycomb sandwich
                        T-joint connections experimentally. Quasistatic tension experiments revealed the effect of
                        loading and aging on the adhesively bonded joints. The results showed that all sandwich
                        specimens fail by brittle fracture of the adhesive. The aging effect on the strength is mainly
                        caused by the exposure time rather than the temperature range.
                              To sum up, the research on composite T-joint mainly focuses on the mechanical joint,
                        hybrid joint, and adhesive joint. When applied to the ship superstructure, the mechanical
                        joint cannot achieve good radar stealth performance, and the weight of the connection
                        is too large. Mechanical joint requires cutting holes in the composite laminates to be
                        connected, which will cause damage around the hole and reduce the strength and fatigue
                        resistance of the overall connection structure. In contrast, composite bonding avoids the
                        drawbacks of mechanical joint. While ensuring the strength of the structure, it also meets
                        the requirements of a lightweight structure.
                              This study aims to investigate the failure mechanism of the new type of adhesive
                        T-joint under bending and shearing load. A rapid and effective prediction model of the
                        T-joint was established to provide a reference for engineering designers about the T-joint’s
                        mechanical properties. This predictive model is based on 2D structure in which the flange
                        plate forms the rigid base, and the web together with two connectors are represented
                        as beams connected with rotary joints. So a bunch of costs and time could be saved in
                        the design process. The T-joint used in the superstructure was manufactured by vacuum
                        assisted resin injection (VARI) process and tested according to its actual working condition.
                        A progressive damage Finite element (FE) analysis model was proposed to reveal its failure
                        mode and ultimate load-bearing capacity. Different failure modes were distinguished in
                        this model. The research in this paper could provide technical support for lightweight
                        construction on ships.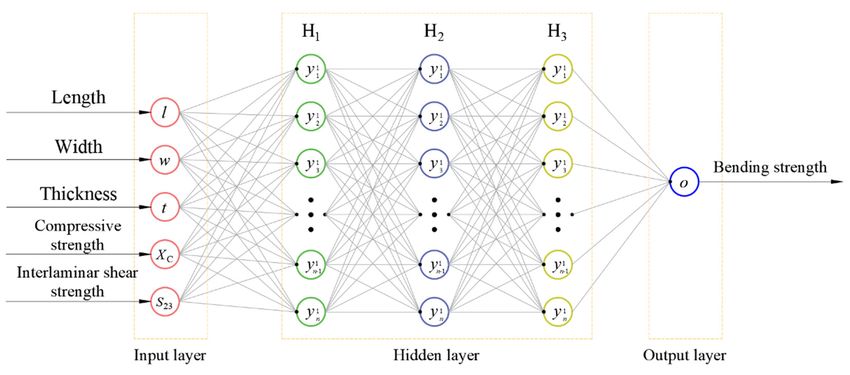
Metals 2021, 11, 1197                                                                                                             4 of 19

                                  2. Materials and Methods
                                  2.1. Experiment
                                       T-joint of the composite sandwich structure consists of flange plate, web, upper
                                  and lower connectors, as shown in Figure 1. The flange plate and web are double-layer
                                  corrugated composite plates made of glass fiber reinforced polymer (GFRP) and polyvinyl
                                  chloride (PVC) foam and were prepared by vacuum assisted resin injection (VARI) process,
                                  as shown in Figure 2. In order to ensure the geometric accuracy of the upper and lower
                                  connectors, the preparation mold of the connector is designed, as shown in Figure 3a. The
                                  mold surface is wrapped with a high-temperature demolding cloth for easy demolding of
                                  connecting parts. The preparation process is shown in Figure 3b,c. The preparation process
                                  is shown in Figure 3b,c. It can be seen in Figure 3c that the connectors are made of GFRP
                                  and PVC foam. The PVC foam was cut to the needed shape and taken as the light core of
                                  the connectors. The glass fiber sheet and the resin constituted the outer and inner skin to
                                  carry the main load. Auxiliary materials were placed on the glass fiber sheets and would
                                  be removed after resin curing. The vacuum bag was sealed on the platform by sealant tape
                                  and could press all material inside with the help of a vacuum pump. The resin was injected
                                  into the bag at the same time. The T-joint was made of 200 g/m2 plain-woven glass fiber
                                  cloth and resin of Merican 30-200P. The laminate structure and material of flange plates,
                                  webs, upper and lower connectors are shown in Table 1.

         Figure 1. T-joint of composite structure: (a) geometry; (b) components of the T-joint; (c) geometry of the connectors.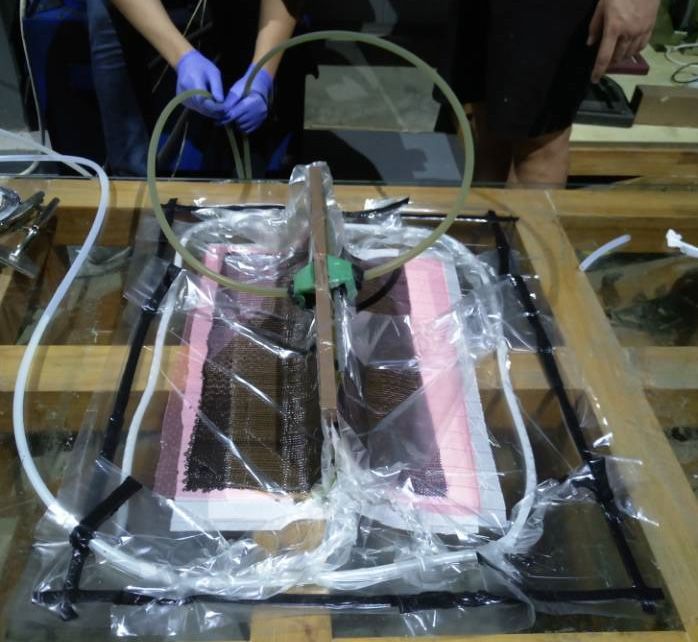
Metals 2021,
Metals       11, x1197
       2021, 11,   FOR PEER REVIEW                                                                                                          55 of
                                                                                                                                               of 19
                                                                                                                                                  19
  Metals 2021, 11, x FOR PEER REVIEW                                                                                                    5 of 19

                                                            (a)                                                   (b)(b)

                                                                                       (c)
                                                                                        (c)
                                    Figure2.
                                  Figure    2. Preparation
                                               Preparation process
                                                             process of
                                                                      of double-layer
                                                                         double-layercorrugated
                                                                                      corrugatedplate:
                                                                                                 plate:(a)
                                                                                                        (a)fiber
                                                                                                             fiberlaying;
                                                                                                                    laying;(b) auxiliary
                                                                                                                             (b)         mate-
                                                                                                                                 auxiliary material
                                  Figure
                                    rial   2. Preparation
                                         laying; (c) resin   process of double-layer corrugated plate: (a) fiber laying; (b) auxiliary mate-
                                                           injection.
                                  laying; (c) resin injection.
                                  rial laying; (c) resin injection.

                                  (a)                                                                    (b)
                                (a)                                                                        (b)

                                                                     (c)
                      Figure 3. Preparation of T-joint: (a) mold of T-joint; (b) resin injection; (c) stacking sequence.
                                                                      (c)
                    Figure
                    Figure 3.
                           3. Preparation
                              Preparation of
                                          of T-joint:
                                             T-joint: (a)
                                                      (a) mold
                                                          mold of
                                                               of T-joint;
                                                                  T-joint; (b)
                                                                           (b) resin
                                                                               resin injection;
                                                                                     injection; (c)
                                                                                                (c) stacking
                                                                                                    stacking sequence.
                                                                                                             sequence.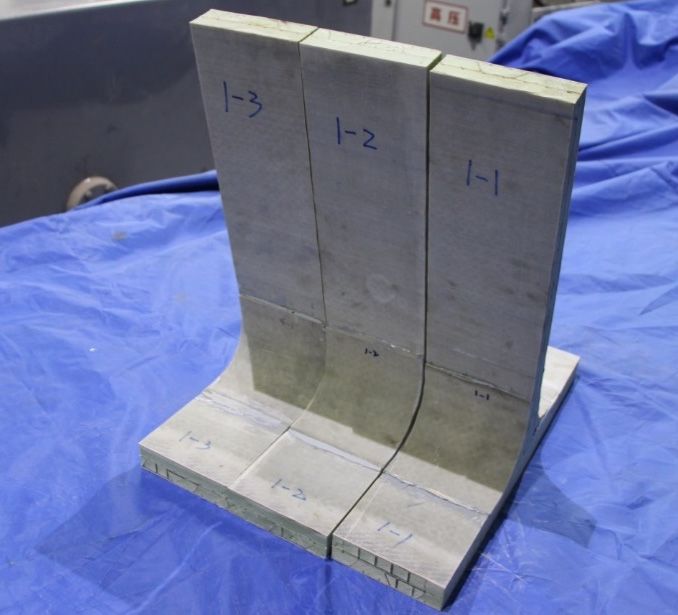
Metals 2021, 11, x FOR PEER REVIEW 6 of 19
Metals2021,
Metals 2021,11,
11,1197
x FOR PEER REVIEW 66ofof19
19
Table 1. Layout of connectors.
Table 1.1.Layout
Table Layoutofofconnectors.
connectors.
No. Part Name Layer Fiber Resin
No.
1 Outside of Part Name
upper connector Layer
10 Fiber Resin
No. Part Name Layer Fiber Resin
1 Outside of upper connector 10
12 Inside of upper connector
Outside of upper connector 510
22
3
Inside
Insideofof
Outside
upper connector
of upper
lowerconnector
connector
5
105
33 Outsideofoflower
Outside lower connector
connector 1010 200 g/m22 plain
44 Inside
Insideofoflower
lower connector
connector 55 200 g/m
200
woven
plain
plain
g/m2cloth Merican 30-200P
Merican 30-200P
4 Inside of lower connector 5 woven cloth Merican 30-200P
55 Face
Facepanel
panelofof the
the sandwich
sandwich 10
10 woven cloth
65
6
Face panel ofofthe
Corrugation
Corrugation thesandwich
of the sandwich
sandwich
104
4
76 Middle layerof
Corrugation ofthe
the sandwich
sandwich 44
7 Middle layer of the sandwich 4
7 Middle layer of the sandwich 4
The
Theupper
upperand andlower
lowerconnectors,
connectors,flange
flangeplate,
plate,andandweb
webareareconnected
connectedby byaasecondary
secondary
bonding
bonding process, as shown in Figure 4. The components of the T-joint wereplaced
Theprocess,
upper andas shown
lower in Figure
connectors, 4. The
flangecomponents
plate, and of
web the
are T-joint were
connected by atatthe
a secondary
placed the
multi-function
bonding clamping
process, as shown platform
in and
Figure 4.fixed.
The The structural
components of adhesive
the
multi-function clamping platform and fixed. The structural adhesive was applied toT-jointwas
wereapplied
placed to
atthe
the
the
bonding
bondingsurface
multi-function
surface and
andthe
clamping themembers
membersof
platform ofthe
and T-joint
fixed.
the Thewere
T-joint clamped
structural
were clamped bybyG-shape
adhesive clamps.
was applied
G-shape clamps.toThe
the
The
epoxy
bondingadhesive of
surface of
epoxy adhesive Lord
and 320/322
the 320/322
Lord memberswaswas used.
of the After
T-joint
used. curing
Afterwere 24
clamped
curing h at room
24 h atbyroom temperature,
G-shape clamps. The
temperature, the
the
composite
epoxy sandwich
adhesive of structure
Lord 320/322samples
was were
used. prepared,
After as
curing
composite sandwich structure samples were prepared, as shown in Figure 5.shown
24 h in
at Figure
room 5.
temperature, the
composite sandwich structure samples were prepared, as shown in Figure 5.
Figure4.4.Bonding
Figure Bondingof
ofT-joint.
T-joint.
Figure 4. Bonding of T-joint.
Figure 5. Specimens of T-joint.
Figure 5. Specimens of T-joint.
Figure 5. Specimens of T-joint.
T-joints of composite sandwich structures are mainly used to connect sidewalks and
T-joints
T-joints
decks. As the ofdeck
of composite
composite sandwich
needs sandwich
to structuresthe
structures
carry equipment, arejoint
are mainly
mainly usedbears
used
mainly totoconnect
connect sidewalks
sidewalks
the mass and
load onandthe
decks.
decks. Asthe
As thedeck
deck. Accordingdeck needs
toneeds tocarry
to carry
the service equipment,
equipment,
conditions the
the
of the jointmainly
joint
T-joint, mainly bears
bears
a testing themass
the
platformmass load
for load
the onthe
on
bendingthe
deck.
deck. According
According
and shearing tothe
to theservice
mechanical service conditions
conditions
properties of
of theof theT-joint,
the T-joint,
T-joint aatesting
testingplatform
was designed, platform
as for
shownfor thebending
the bending
in Figure 6. The
andshearing
and shearingmechanical
mechanicalproperties
propertiesofofthe
theT-joint
T-jointwas
wasdesigned,
designed,asasshown
shownininFigure
Figure6.6.The
The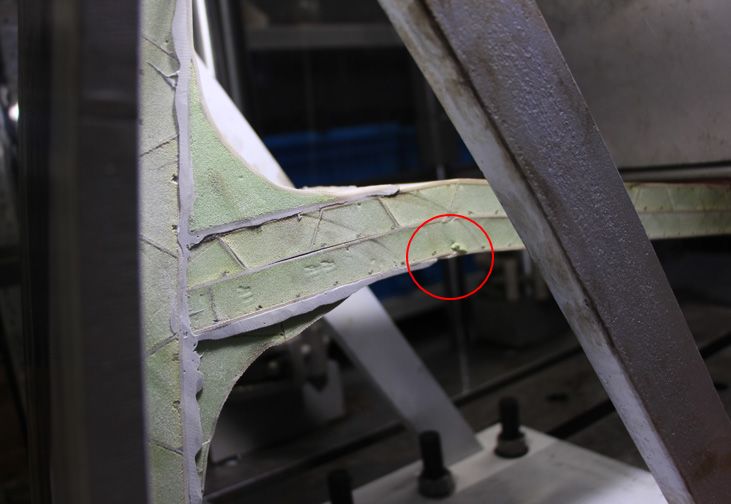
Metals 2021,
Metals 11,11,
2021, 1197FOR PEER REVIEW 7 of 19
Metals 2021, 11, x xFOR PEER REVIEW 7 7ofof1919
side plate ◦ toto
side
side plate
plate ofof
of thethe
the fixture
fixture
fixture isisis
atatat
an
anan angle
angle
angle ofofof
80 80°
80° the
tothe
the bottom
bottom
bottom plate.
plate.
plate.TheThe
The fixture
fixture
fixture was
was
was fixed
fixed
fixed onon
on
theplatform
the
the platformof
platform ofofthethe
the MTS
MTS
MTS 311.12
311.12
311.12 testing
testing
testing machine(MTS
machine
machine (MTSSystem
(MTS SystemCorp.,
System Corp.,Eden
Corp., EdenPrairie,
Eden Prairie,MN,
Prairie, MN,
MN,
USA).
USA). The
The endend of of the
the loading
loading head
head was
was a a cylinder
cylinder with
with a a diameter
diameter
USA). The end of the loading head was a cylinder with a diameter of 20 mm. The bending of of
2020 mm.
mm. The
The bending
bending
mechanicalproperties
mechanical
mechanical propertiesof
properties ofofthethe
the T-joint
T-joint
T-joint were
were
were tested
tested
testedby
byby displacement
displacement
displacement loading
loading
loading with
with
with aloading
loading
aaloading
speed
speed ofof
2 2 mm/min.
mm/min.
speed of 2 mm/min.
Figure6.6.Experimental
Figure Experimentalset-up.
set-up.
Figure 6. Experimental set-up.
2.2.Finite
2.2.
2.2. FiniteElement
Finite Element
Element Analysis
Analysis
Analysis Method
Method
Method for
for
for T-Joint
T-Joint
T-Joint
ABAQUS
ABAQUS
ABAQUS (Ver(Ver
(Ver 6.13,
6.13,
6.13, Dassault
Dassault
Dassault Systemes
Systemes
Systemes Corp.,
Corp.,
Corp., Paris,
Paris,
Paris, France)
France)
France) waswas
was used
used
used tototo simulate
simulate
simulate the the
the
mechanical
mechanical behavior
behavior of the
of theT-joint.
T-joint.AsAsshown
shown in Figure
in Figure 7a, the
7a, simplified
the
mechanical behavior of the T-joint. As shown in Figure 7a, the simplified geometric model simplified geometric
geometric model
model
without
without
without thethe
the fixture
fixture
fixture waswas
was established
established
established according
according
according tototo
the specimen.
the
the specimen.
specimen. Solid
Solid
Solid support
support
support constrained
constrained
constrained
the top
thetop
the and
topand bottom
andbottom of the
bottomofofthe flange
theflange plate,
flangeplate, and
plate,and the
andthe web
theweb was
webwas subjected
wassubjected to displacement
subjectedtotodisplacement
displacement load
load
load atatat
aaloading
aloading
loading rate
rate
rate ofofof
22mm/min.
mm/min.3D-Hashin
2mm/min. 3D-Hashinfailure
3D-Hashin failurecriterion
failure criterion[32]
criterion and
[32]
[32] and
and Chang-Chang
Chang-Chang
Chang-Chang damage
damage
damage
evolution
evolution criterion
criterion [33]
[33]areareadopted
adopted to to
composite
composite materials.
materials. Mechanical
Mechanical parameters
parameters areare
evolution criterion [33] are adopted to composite materials. Mechanical parameters are
shown
shown ininTable
Table 2.2.The
The PVC
PVC foam
foam adopts
adopts the
the Crushable Foam constitutive
constitutiverelation,
relation,andandits
shown in Table 2. The PVC foam adopts the Crushable Foam constitutive relation, and its
itsmaterial
materialparameters
parametersare areshown
shownininTableTable 3.TheThecohesive
cohesivebehavior
behaviorwas wasadopted
adoptedtotothe thein-
material parameters are shown in Table 3.3.The cohesive behavior was adopted to the in-
interface between
terfacebetween
betweenupper upper
upperand and
andlowerlower connectors,
lowerconnectors,
connectors,flange flange plate,
flangeplate,
plate,and and
andweb. web.
web.Its Its performance
Itsperformance
performancepa- pa-
terface
parameters
rameters areshown
are shownininTable Table4.4.The
Thefinite
finiteelement
element mesh
mesh model
model is is shown
shown in in Figure
Figure 7b.7b.
The
rameters are shown in Table 4. The finite element mesh model is shown in Figure 7b. The
The mesh
mesh typetype is C3D8R, andthethe element number is 218078.
mesh type isisC3D8R,
C3D8R, and
and the element
element number
number isis218078.
218078.
(a)
(a) (b)
(b)
Figure
Figure
Figure7.7.7. Finite
Finite
Finite element
element
element(a)(a)
(a) geometric
geometric
geometric model
model
modelandand
and (b)
(b)
(b) mesh
mesh
mesh model.
model.
model.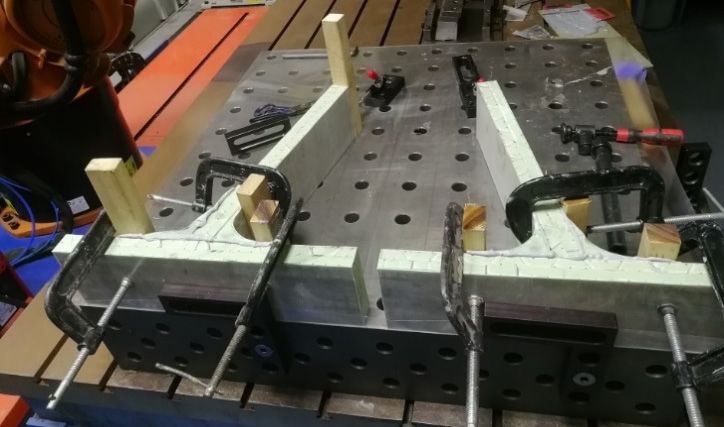
Metals 2021, 11, 1197                                                                                                                    8 of 19

                        Table 2. Mechanical parameters of the glass fiber reinforced polymer (GFRP).

                             Elastic Modulus (GPa)                        Poisson’s Ratio                      Shear Modulus (GPa)
                            E11 = E22               E33                  µ12             µ13 = µ23              G12            G13 = G23
                               22                    9                   0.3               0.45                  4                 8
                             Tensile Strength (MPa)              Compressive Strength (MPa)                    ShearStrength (MPa)
                             X T = YT               ZT              X C = YC                  ZC                S12            S13 = S23
                                354                 20                 128                    90                38                20

                        Table 3. Mechanical parameters of the PVC foam.

                                                                                                                                Density
                           Elastic Modulus (MPa)             Poisson’s Ratio                 Shear Modulus (MPa)
                                                                                                                                (kg/m3 )
                                        Ec                         µc                                   Gc                         ρc
                                        80                         0.2                                  25                         80
                               Compressive Strength (MPa)                 Tensile Strength (MPa)                Shear Strength (MPa)
                                             1.35                                      1.9                              1.35

                        Table 4. Parameters of cohesive behavior.

                           Knn           Kss          Ktt          σn            σs             σt            Gnn      Gss           Gtt
                           MPa           MPa          MPa          MPa          MPa            MPa           N/mm     N/mm          N/mm
                           1586          1586         1586          15            15               15         0.3        1.2            1.2
                        Knn , Kss , Ktt —Stiffnesses in the normal direction, the first shear direction, and the second shear direction,
                        respectively. σn , σs , σt —Peak values of the nominal stress in the normal direction, the first shear direction, and
                        the second shear direction, respectively. Gnn , Gss , Gtt —Separation energies in the normal direction, the first shear
                        direction, and the second shear direction, respectively.

                        2.3. Ultimate Bearing Capacity Prediction Model of the T-Joint
                             T-joint is one of the key joints of ship superstructure, and its bearing capacity is one
                        of the core elements of composite superstructure design. The design of the T-joint is very
                        complicated due to the discontinuous and heterogeneous nature of the structure, and
                        the nonlinearity of the materials’ mechanical properties. The nonlinearity of T-joint and
                        mechanical properties of materials lead to the complexity of the joint design. The flanges,
                        webs, and upper and lower connectors are simplified in this paper, and the external force
                        balance relation of each bar is established. Then, based on the artificial neural network
                        algorithm, the strength prediction model of the simplified lower connector is established.
                        Based on this, the ultimate bearing capacity prediction model of the T-joint is established.

                        2.3.1. Simplified Mechanical Model of T-Joint
                               When the members of the T-joint were bonded together, it was the contact area between
                        the web and the flange plate, and the connectors’ inner skin were thin. Hence the junction
                        area of the T-joint could not provide sufficient bending resistance, so that the junction node
                        is assumed to be a hinge point. At the same time, in the connection area, the connector is
                        bonded to the flange plate and web, and the connector has a certain reinforcing effect on
                        the flange plate and web, restraining the local deformation of the flange plate and web. So
                        it is simplified into bars, and then the simplified model of the T-joint is shown in Figure 8a.
                        When the joint is subjected to the concentrated load F, the stress analysis of the bar No. 3 is
                        shown in Figure 8b.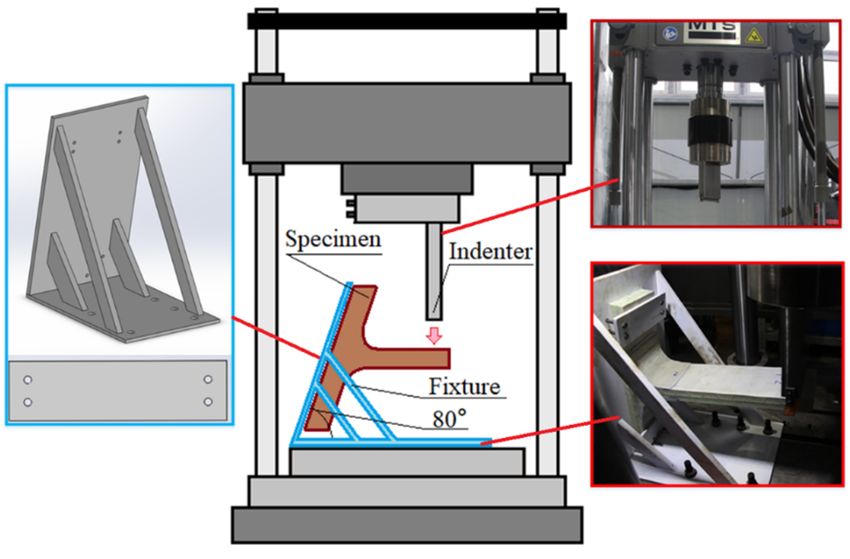
FL2 × sin γ × sin α + F × ( L3 − L2) × cos(γ − α )
×
L2 × sin γ × sin(α + β ) + ( L1 − L2) × sin β × sin(γ − α )
F 1 × cos β − F 3 × sin γ
Metals 2021, 11, 1197 F2 = 9 of 19
cos α
(a) (b)
Figure8. 8.
Figure (a)(a) Simplified
Simplified mechanical
mechanical model
model and
and (b) (b) analysis
Force Force analysis of bar
of bar No. 3 in No. 3 in the T-joint.
the T-joint.
TheThe
2.3.2. force balance equation
Calculation Modeland
of moment
Bendingbalance equation
Ultimate areCapacity
Bearing established,
of as shown Lami
Composite
innates
Equations (1)–(3).
Based on Neural Network
F2 × cos α + F3 × sin γ = F1 × cos β (1)
The design of the T-joint is complicated, and the necessary FEM analysis is time-co
1 × sin β + Fmodel
suming. Therefore, aFsimplified 2 × sin αwas × sin γ = F as a simple and efficient
+ F3established (2) desi
aid. The model is based on 2D structure in which
F1 × L1 sin β + F2 × L2 × sin α = F × L3 the flange plate forms the(3)rigid ba
and the web together with two connectors are represented as beams connected with rota
where F (N) is the binding force of bar No. 3. L (mm) is the distance between the operation
joints.
point and The bearing capacity
the articulated ofNo.
point of bar this3. model is defined
In this paper, by the
L1 , L2 , and L3 arestrength of the
80 mm, 72.59 mm,lower joi
which is modeled separately using FEM, and its strength
and 500 mm, respectively. α is the angle between bar No. 2 and bar No. 3, which is 50 inis described in relation
◦ to
geometry
this paper. β isusing artificial
the angle of barneural
No. 1 andnetwork
bar No.(ANN). ◦
3, which is 40 in this paper. γ is the angle
◦ . By combining Equations (1)–(3), the
between From
bar No.the 3analysis above,
and the fixed thewhich
wall, circular
is 80arc part was the weakness of the lower co
binding
nector. The compression bending failure of bar No. 1 in(4)–(6).
force of each bar can be obtained, as shown in Equations the 2D simplified model is t
main failure mode of the T-joint. Therefore, establishing the compressive bending streng
FL2 × sin γ × sin α + F × ( L3 − L2 ) × cos(γ − α)
1 =
calculationFmodel ofsin
theγ laminated the(4)calculati
L2 × × sin(α + β)plate + ( L1model
− L2 ) ×issintheβ key× sinto
(γestablishing
− α)
model of the ultimate bearing capacity of the T-joint. The compression bending streng
of laminates in-plane is greatly F ×( L2 − L3by
) the − L1 )
( L2geometrical
F3 =affected
L2 ×sin γ − L2 ×sin γ
parameters and the mechanic
properties of materials. The damaged laminates are
FL2 ×sin γ×sin α+ F ×( L3 − L2 )×cos(γ−α)mostly progressive, so it is(5)difficult
×L
2 ×sin γ ×sin( α + β )+( L1 − L2 )×sin β ×sin( γ − α )
F1 × cos β − F3 × sin γ
F2 = (6)
cos α
2.3.2. The Calculation Model of Bending Ultimate Bearing Capacity of Composite
Laminates Based on Neural Network
The design of the T-joint is complicated, and the necessary FEM analysis is time-
consuming. Therefore, a simplified model was established as a simple and efficient design
aid. The model is based on 2D structure in which the flange plate forms the rigid base,
and the web together with two connectors are represented as beams connected with rotary
joints. The bearing capacity of this model is defined by the strength of the lower joint,
which is modeled separately using FEM, and its strength is described in relation to its
geometry using artificial neural network (ANN).
From the analysis above, the circular arc part was the weakness of the lower connector.
The compression bending failure of bar No. 1 in the 2D simplified model is the main failure
mode of the T-joint. Therefore, establishing the compressive bending strength calculation
model of the laminated plate model is the key to establishing the calculation model of the
ultimate bearing capacity of the T-joint. The compression bending strength of laminates
in-plane is greatly affected by the geometrical parameters and the mechanical properties
of materials. The damaged laminates are mostly progressive, so it is difficult to calculate
Metals 2021, 11, 1197                                                                                          10 of 19

                        the bending strength by a simple theoretical formula. In this paper, the neural network
                        algorithm is used to establish the calculation model of laminated plates’ flexural ultimate
                        bearing capacity.
                             The artificial neural network is a mathematical model which integrates computing
                        units and computational relations. Among many neural network bolts, BP neural network
                        algorithm has become a powerful tool to solve complex engineering and scientific prob-
                        lems with its excellent ability of nonlinear mapping, self-learning and adaptive ability,
                        generalization ability, and fault tolerance ability.
                             Plain woven fabric has been widely used in the preparation of large composite struc-
                        tures because of its excellent technological properties and mechanical properties. Therefore,
                        plain woven cloth is used as the preparation material of flange plate, web, and connector
                        in this paper, so the laying angle of fiber cloth is not used as the input node. The sample
                        length, l, width, w, thickness, t, composite compressive strength, XC , and interlamination
                        shear strength, τ yz , were selected as input nodes. The bending strength of the sample was
                        taken as output nodes. Then, the number of neurons in the input layer is I = 5. The number
                        of neurons in the output layer is O = 1. Since the sample data is characterized by significant
                        discontinuity, the number of hidden layers is set as 3. At present, the selection of hidden
                        layer node numbers is mainly based on empirical formulas, as shown in Equations (7)–(9).
                                                                    √
                                                                H = I +O+ N                                        (7)

                                                                 H = log2 I                                        (8)
                                                                      I
                                                              H=    ∑ CHi ≥ k                                      (9)
                                                                    i =0

                        where H is the number of hidden layer nodes, N is the constant {1, 10}, and k is the number
                        of training samples. According to the situation in this paper, the calculated number interval
                        {a, b} of hidden layer nodes is {3, 13}. In order to further narrow the selection range, the
                        golden section method is used to optimize the area, namely
                                                                    √
                                                                     5−1
                                                           c = a+          (b − a)                              (10)
                                                                      2
                                                                   √
                                                                     5−1
                                                          c = a+           (c − a)                              (11)
                                                                      2
                             The calculated number interval of hidden layer nodes is {7, 9}. Therefore, the number
                        of nodes in the hidden layer H = {7,9,10,11,12,13} was selected to train the neural network
                        model successfully. The network model was evaluated by comparing the three indexes
                        of Mean Absolute Error (MAE), Root Mean Square Error (RMSE), and Coefficient of
                        Determination (R2 ).
                                                                     1 m
                                                           MAE = ∑ |yi − ŷi |                                  (12)
                                                                    m i =1
                                                                  s
                                                                     1 m
                                                                     m i∑
                                                       RMSE =              (yi − ŷi )2                         (13)
                                                                        =1
                                                                           m
                                                                          ∑ (yi −ŷi )2
                                                                          i =1
                                                           R2 = 1 −         m                                     (14)
                                                                          ∑ (yi −ŷi   )2
                                                                          i =1

                             In summary, the neural network topology established in this paper is shown in
                        Figure 9. The training samples are shown in Table 5. The training samples were generated
                        from the geometry of the connector, which was derived from the original specimen geome-
                        try by varying the dimensions, namely length, width, thickness, compressive strength, and
i=1
In summary, the neural network topology established in this paper is shown in F
ure 9. The training samples are shown in Table 5. The training samples were genera
Metals 2021, 11, 1197 11 of 19
from the geometry of the connector, which was derived from the original specimen
ometry by varying the dimensions, namely length, width, thickness, compress
strength, and shear strength (see Figure 9b). There were five parameters in the table, ke
shear strength (see Figure 9b). There were five parameters in the table, keeping everything
ing everything else
else the same, the same,
changing changing
only one parameteronlyat aone
time.parameter at a time.
Then the training Then
samples werethe train
samples were The
obtained. obtained.
transferThe transfer
function function
of the of the
hidden layer is hidden layer is
the hyperbolic the hyperbolic
tangent function. tang
function. The transfer
The transfer functionfunction of the
of the output output
layer layer
is a linear is a linear
function. function.
The learning The islearning
function the fu
gradient descent momentum function.
tion is the gradient descent momentum function.
(a)
(b)
Figure 9.Figure
(a) Neural network
9. (a) Neural topology
network and
topology andthe
the(b)
(b) geometry
geometry ofof
thethe
FE FE model
model (lower
(lower connector’s
connector’s arc part).arc part).Metals 2021, 11, 1197 12 of 19
Table 5. Training sample.
No. L (mm) w (mm) t (mm) X C (MPa) S23 (MPa) Ultimate Load (N)
1 50 20 2.6 120 25 4357
2 80 20 2.6 120 25 3461
3 100 20 2.6 120 25 3440
4 120 20 2.6 120 25 3453
5 150 20 2.6 120 25 3197
6 180 20 2.6 120 25 3213
7 100 10 3 140 30 2102
8 100 15 3 140 30 3155
9 100 20 3 140 30 4202
10 100 30 3 140 30 6313
11 100 40 3 140 30 8391
12 100 50 3 140 30 10,511
13 150 40 1.6 100 20 5168
14 150 40 2 100 20 6559
15 150 40 2.6 100 20 9782
16 150 40 3 100 20 11,288
17 150 40 4 100 20 15,052
18 150 40 5 100 20 18,813
19 50 10 1.6 80 15 1125
20 120 30 2 80 35 4431
21 120 30 2 100 35 4431
22 120 30 2 120 35 4476
23 120 30 2 140 35 4476
24 120 30 2 160 35 4431
25 120 30 2 180 35 4431
26 80 15 4 160 15 7973
27 80 15 4 160 20 7973
28 80 15 4 160 25 7973
29 80 15 4 160 30 7973
30 80 15 4 160 35 7973
31 80 15 4 160 40 7973
3. Results
3.1. Results of the Experiment
Figure 10 shows the load-displacement curves of the experiment. The curves can be
divided into four stages: the first stage is the linear elastic stage, with a linear relationship
between load and displacement. The second stage is the pseudo-elastic stage, and the load
and displacement show a nonlinear relationship. The third stage is the failure stage. With
the gradual increase of displacement, the load drops sharply, indicating that the structure
is damaged. The fourth stage is the platform stage. With the increase of displacement, the
load presents a platform, indicating that the joint has entered a stable damage extension
stage. The bending stiffness of the T-type joint is 0.113 kN/mm, 0.130 kN/mm, and
0.133 kN/mm, respectively, and the variance is 7.9287 × 10⁻⁵ . The ultimate load is 4.07 kN,
4.46 kN, and 4.51 kN, respectively, and the variance is 0.0385, indicating good consistency
of these three tests.
The deformation of the specimen during the loading process of the T-joint is shown in
Figure 11. After the experiment’s beginning, with the gradual increase of displacement
load, the flange plate of the specimen is bent and deformed, and it is separated from
the fixture, as shown in Figure 11a,b. With the further increase of the displacement, the
connection area between the web and the lower connector is damaged, resulting in the
decrease of the stiffness of the load-displacement curve and the softening phenomenon, as
shown in Figure 11c,d. When the displacement reached 45 mm, the lower face and middle
layers of the web were damaged. The T-joint reached its maximum bearing capacity, as
shown in Figure 11e. After continuous loading, the damage of the web expands along with
the thickness of the web.3
LoSdinSS
2
1 STSsS1
Metals
Metals2021, 11,11,
2021, x FOR
1197 PEER REVIEW STSsS2 1313
of of
1919
STSsS3
0
0 15 30 45 60 75
DisplScSmSnSS/mm
5
SSSSSSⅠ SSSSSSⅡ SSSSSSⅢ SSSSSSⅣ
Figure 10. Load-displacement curves of the experiments.
4
The deformation of the specimen during the loading process of the T-joint is shown
LoSdinSS/kN
in Figure 11. After the experiment’s beginning, with the gradual increase of displacement
3
load, the flange plate of the specimen is bent and deformed, and it is separated from the
fixture, as shown in Figure 11a,b. With the further increase of the displacement, the con-
2
nection area between the web and the lower connector is damaged, resulting in the de-
crease of the stiffness of the load-displacement curve and the softening phenomenon, as
shown in 1Figure 11c,d. When the displacementSTSsS1 reached 45 mm, the lower face and middle
STSsS2
layers of the web were damaged. The T-joint STSsS3 reached its maximum bearing capacity, as
shown in0Figure 11e. After continuous loading, the damage of the web expands along
0 15 30 45 60 75
with the thickness of the web.
DisplScSmSnSS/mm
Meanwhile, the arc part of the lower connector is damaged. The T-joint enters the
damage stable expansion stage. From
Load-displacement the above,
curves the main failure modes of T-joint are local
Figure
Figure 10.10.
Load-displacement curves of of
thethe experiments.
experiments.
failure of web and arc failure of the lower connector.
The deformation of the specimen during the loading process of the T-joint is shown
in Figure 11. After the experiment’s beginning, with the gradual increase of displacement
load, the flange plate of the specimen is bent and deformed, and it is separated from the
fixture, as shown in Figure 11a,b. With the further increase of the displacement, the con-
nection area between the web and the lower connector is damaged, resulting in the de-
crease of the stiffness of the load-displacement curve and the softening phenomenon, as
shown in Figure 11c,d. When the displacement reached 45 mm, the lower face and middle
layers of the web were damaged. The T-joint reached its maximum bearing capacity, as
shown in Figure 11e. After continuous loading, the damage of the web expands along
with the thickness of the web.
Meanwhile, the arc part of the lower connector is damaged. The T-joint enters the
damage stable expansion stage. From the above, the main failure modes of T-joint are local
failure of web and(a)arc failure of the lower connector. (b)
Metals 2021, 11, x FOR PEER REVIEW 14 of 19
(c) (d)
(a) (b)
(e) (f)
FigureFigure
11. Deformation of the specimen
11. Deformation during during
of the specimen the loading process:process:
the loading (a) before
(a)the test; the
before (b) linear
test; (b) linear
elasticelastic
stage; stage;
(c) pseudo elasticelastic
(c) pseudo stage; stage;
(d) detail
(d) of pseudo
detail elastic elastic
of pseudo stage; (e) failure
stage; stage; (f)
(e) failure damage
stage; (f) damage
stability expansion stage.
stability expansion stage.
3.2. Simulation (c)arc part of the lower connector is damaged.
Results the
Meanwhile, (d) The T-joint enters the
3.2.1. damage
Bendingstable expansion
Simulation stage. From the above, the main failure modes of T-joint are local
Result
failure of web and arc failure of the lower connector.
The comparison of the load-displacement curve between the simulation and the test
is shown in Figure 12. It can be seen that the simulated load-displacement curve is con-
sistent with the trend of experiments. The simulated bending stiffness is 0.150 kN/mm.
Compared to the experiments, the relative error is 16.5%. The ultimate bearing capacity in
simulation is 4.537 kN, and the error is 4.4%. The relative error comes from the double-(e) (f)
Figure 11. Deformation of the specimen during the loading process: (a) before the test; (b) linear
Metals 2021, 11, 1197 14 of 19
elastic stage; (c) pseudo elastic stage; (d) detail of pseudo elastic stage; (e) failure stage; (f) damage
stability expansion stage.
3.2.
3.2.Simulation
SimulationResults
Results
3.2.1.
3.2.1.Bending
BendingSimulation
SimulationResult
Result
The
Thecomparison
comparison of of
thethe
load-displacement
load-displacement curve between
curve the simulation
between the simulation and the
andtest
the
istest
shown in Figure
is shown 12. It 12.
in Figure can Itbecan
seen
bethat
seenthe simulated
that load-displacement
the simulated load-displacement curve curve
is con-is
sistent withwith
consistent the trend of experiments.
the trend of experiments. TheThe
simulated
simulated bending
bending stiffness
stiffnessisis0.150
0.150kN/mm.
kN/mm.
Compared
Compared to the experiments, the relative error is 16.5%. The ultimate bearing capacityinin
to the experiments, the relative error is 16.5%. The ultimate bearing capacity
simulation
simulationisis4.537
4.537 kN,
kN, and the the error
errorisis4.4%.
4.4%.The
Therelative
relative error
error comes
comes from
from the the double-
double-layer
layer corrugated
corrugated sandwich
sandwich andandthe the connectors’
connectors’ actual
actual preparation
preparation process
process andandthethe thick-
thickness
ness deviation
deviation between
between the the FE model
FE model andand specimens.
specimens.
5
STSsSS1
STSsSS2
4 STSsSS3S
SFEA
LoSdinSS/kN
3
2
1
0
0 15 30 45 60 75
DisplScSmSnSS/mm
Figure12.
Figure Comparisonofofsimulation
12.Comparison simulationand
andtest
testresults.
results.
Thedamage
The damage distribution
distribution characteristics
characteristics of the
of the T-joint
T-joint during
during the loading
the loading process
process are
are shown in Figure 13. The red color in Figure 13 indicates the damaged
shown in Figure 13. The red color in Figure 13 indicates the damaged area, and the un- area, and the
undamaged area shown in blue. When the downward displacement
damaged area shown in blue. When the downward displacement reaches 22 mm, tensile reaches 22 mm, tensile
damageand
damage andtensile
tensiledelaminated
delaminated damage
damage of of the
thematrix
matrixappear
appearininthe
theintersection
intersectionarea of of
area the
flange
the plate,
flange web,
plate, web,and
andconnector.
connector. The
Thedamage
damage expansion
expansion isisnot
notobvious
obviouswith
withthethegradual
grad-
increase of downward displacement. Compression damage of the matrix occurred at the
ual increase of downward displacement. Compression damage of the matrix occurred at
connection area between the lower connector and the web. The damage extended obviously
the connection area between the lower connector and the web. The damage extended ob-
with the increase of the displacement. When the displacement reaches 38 mm, the middle
viously with the increase of the displacement. When the displacement reaches 38 mm, the
of the web plate is damaged. The joint reaches its maximum carrying capacity. With the
middle of the web plate is damaged. The joint reaches its maximum carrying capacity.
continuous increase of the downward displacement, the damage of the middle plate of
With the continuous increase of the downward displacement, the damage of the middle
the web extends obviously. Damage to the lower face panel of the web extends slowly.
plate of the web extends obviously. Damage to the lower face panel of the web extends
The main damage modes of the T-joint are matrix compression failure and compression
slowly. The main damage modes of the T-joint are matrix compression failure and com-
delamination of the lower panel and the middle plate of the web. The main reason is that
pression delamination of the lower panel and the middle plate of the web. The main rea-
the web face panel is thin. The connector strengthens the upper and lower panels of the
son is that the web face panel is thin. The connector strengthens the upper and lower pan-
web in the connection area. This makes the lower panel of the web near the connection
els of the
area the main
web in theofconnection
area area.
joint failure. In This makes the
the damage lowerthere
process, panelis of the web
a strong near the
competitive
connection area the main area of joint failure. In the damage process,
relationship between the matrix compression failure of the lower face panel and the there is a strong
middle
plate of the web, and the matrix tensile failure and the tensile delamination of the flange
plate, the web, and the connecting area of the connector. This competition mainly depends
on the thickness of the upper and lower face panels and the middle panel of the web. If the
thickness is small, the web becomes the main factor affecting the mechanical properties
of the T-joint. On the contrary, the thickness of the connectors becomes the main factor
affecting the performance of the T-joint.and the middle plate of the web, and the matrix tensile failure and the tensile delamination
of the flange plate, the web, and the connecting area of the connector. This competition
mainly depends on the thickness of the upper and lower face panels and the middle panel
of the web. If the thickness is small, the web becomes the main factor affecting the me-
Metals 2021, 11, 1197 15 of 19
chanical properties of the T-joint. On the contrary, the thickness of the connectors becomes
the main factor affecting the performance of the T-joint.
Figure 13. Damage Figure
evolution of the T-joint
13. Damage in different
evolution failure
of the T-joint modes.failure modes.
in differentMetals 2021, 11, x FOR PEER REVIEW 16 of 19
Metals 2021, 11, 1197 16 of 19
3.2.2. Ultimate Bearing Capacity of T-Joint
From the results of the tests and finite element analysis above, it can be seen that the
3.2.2. Ultimate Bearing Capacity of T-Joint
damage of the T-joint mainly occurs in the lower face panel of the web, close to the connection
From the results of the tests and finite element analysis above, it can be seen that
area. The degree of damage to the joint is small. So the ultimate bearing capacity of the con-
the damage of the T-joint mainly occurs in the lower face panel of the web, close to the
nector cannot be obtained in the test. Therefore, the finite element analysis method is applied
connection area. The degree of damage to the joint is small. So the ultimate bearing capacity
inofthis section.
the connector Considering the web
cannot be obtained in stiffness and the stiffness
the test. Therefore, the finiteofelement
the connector
analysismatching
method prob-
lem, the web
is applied is modeled
in this section. as an equivalent
Considering homogeneous
the web stiffness and entity. The ultimate
the stiffness bearing capacity
of the connector
analysis
matchingmodel of the
problem, theT-joint is established,
web is modeled as shownhomogeneous
as an equivalent in Figure 14a.entity.
The ultimate bearing ca-
The ultimate
bearing
pacity capacity
analysis analysis
model model
of the of the
T-joint T-joint is established,
is established, as shownasinshownFigurein14a.
Figure
The14a. The
equivalent ma-
ultimate
terial bearing capacity
parameters analysis
of the web model of the
are obtained by aT-joint is established,
unidirectional as shown
tensile modelinofFigure 14a.
the double-layer
The equivalent
corrugated materialpanel,
sandwich parameters of the web
as shown are obtained
in Figure 14b. Abyreference
a unidirectional tensile
point was model to the
coupling
of the double-layer corrugated sandwich panel, as shown in Figure 14b. A reference point
panel’s profile. Tensile loading was applied on the reference point and controlled by displace-
was coupling to the panel’s profile. Tensile loading was applied on the reference point
ment. The material parameters of the equivalent web for double corrugated plate tensile
and controlled by displacement. The material parameters of the equivalent web for double
stress-strain curve
corrugated plate werestress-strain
tensile shown in Figure
curve 14c.
were shown in Figure 14c.
(a) (b)
35
30
25
SSrSssS/MPS
20
15
10
5
0
0.000 0.005 0.010 0.015 0.020 0.025 0.030
SSrSin
(c)
Figure 14.14.
Figure Finite element
Finite elementmodel
model for
for ultimate bearingcapacity
ultimate bearing capacity of the
of the connectors.
connectors. (a) Geometric
(a) Geometric modelmodel of the T-joint.
of the T-joint. (b) FE (b)
FE model ofdouble-layer
model of double-layer corrugated
corrugated sandwich
sandwich panel.panel. (c) Equivalent
(c) Equivalent stress-strain
stress-strain relation ofrelation of double-layer
double-layer corrugated
corrugated sandwich.
sandwich
The simulated ultimate bearing capacity of the T-joint is shown in Figure 15. As can
be seen
Thefrom Figure 15a,
simulated when bearing
ultimate the displacement
capacityisofabout 62 mm, is
the T-joint theshown
curve reaches
in Figure a peak
15. As can
value of 5.17 kN. As the corrugated sandwich and the connectors are pressed against each
be seen from Figure 15a, when the displacement is about 62 mm, the curve reaches a peak
other during the loading process of the T-joint, as shown in Figure 15a, the skin of the
value of 5.17inkN.
connectors the As the corrugated
bonding area beginssandwich and the connectors
to suffer damage. are pressed
The main failure mode of against
the each
other during
connectors the loading
is fiber process
compression of of
failure thethe
T-joint,
compositeas shown
plate ofinthe
Figure
lower 15a, the skin
connector, as of the
connectors in the
shown in Figure 15b. bonding area begins to suffer damage. The main failure mode of the
connectors is fiber compression failure of the composite plate of the lower connector, as
shown in Figure 15b.Metals 2021, 11, 1197 17 of 19
Figure 15. Results of ultimate bearing capacity of connectors (a) Load-displacement curve. (b) Fiber compressive failure of
the lower connector.
3.3. Verification of Ultimate Bearing Capacity Prediction Model
The test and simulation revealed that the failure mode of the T-joint is the lower
connector crack. The lower connector is the weakness of the T-joint. The arc part’s strength
of the lower connector controlled the T-joint’s load-bearing capacity. So a rapid and effective
strength prediction model of the arc under bending load could provide a reference easily
for the overall strength of the T-joint. It will save a lot of time.
Table 6 presents the evaluation results of neuron number network models in different
hidden layers. It can be seen that when the number of neurons in the hidden layer is
12, the determination coefficient reaches the maximum value of 0.99987. Therefore, the
calculation model of ultimate bending bearing capacity of composite laminates trained
with 12 neurons was adopted, and the predicted results are shown in Table 7. A FE model
according to Figure 15b was used to verify the predicted results. The F1 value predicted
by the neural network training is in good agreement with the finite element calculation
results. The maximum relative error was less than 3%.
Table 6. Performance statistics of different number of neurons.
Neurons MAE/MPa RMSE/MPa R2
7 0.0182 0.0263 0.99845
9 0.0189 0.0277 0.99826
10 0.0120 0.0165 0.99948
11 0.0197 0.0273 0.99795
12 0.0070 0.0075 0.99987
13 0.0114 0.0135 0.99949
MAE—mean absolute error, RMSE—root mean square error, R2 —coefficient of determination.
Table 7. Verification of calculation model for ultimate bearing capacity of the T-joint.
l w t XC τ yz F 1 /kN
No. Error/%
mm mm mm MPa MPa FEM ANN
1 218.55 150 3.4 128 20 31.622 31.499 0.39
2 218.55 150 2.8 128 20 15.970 15.912 0.36
3 167.12 150 2.8 128 20 39.303 38.177 2.88
4 192.84 150 2.2 128 20 84.866 83.983 1.04
5 167.12 150 2.2 128 20 125.628 124.862 0.61
l—arc length, w—arc width, t—arc thickness, XC —compressive strength, τ yz —shear strength.Metals 2021, 11, 1197 18 of 19
4. Conclusions
Lightweight of the superstructure could improve the navigability of the ship and save
fuel. Composite sandwich panels are attractive for superstructure because of the excellent
specific stiffness and specific strength. In this paper, a type of T-joint was proposed for
lightweight superstructure in a ship. A bending and shearing coupling test and the FE
method were used to reveal the T-joint’s failure modes. A strength prediction model is
established focused on the specific damage mode.
• A type of adhesive T-joint was manufactured by VARI method and subjected to the
bending and shearing load according to the actual service condition. The main failure
modes of T-joint are local failure of the web panel and arc failure of the lower connector.
• A finite element analysis method was established based on the 3D-Hashin damage
initiation criterion and Chang-Chang damage evolution criterion. The web’s failure
mode was the compressive matrix failure and the damage on the lower connector was
the fiber compressive failure when the joint reached its maximum load-bearing capacity.
• The adhesive T-joint was simplified into bars, and a strength prediction model of
the simplified lower connector is established based on the artificial neural network
algorithm. The predicted ultimate bearing capacity of the T-joint showed a good
agreement with the simulation, and the maximum relative error was less than 3%.
Author Contributions: Conceptualization, Y.L.; Methodology, Y.L.; Software, M.L.; Supervision, X.L.;
Validation, M.L.; Visualization, Y.L.; Writing—original draft, Y.L.; Writing—review and editing, X.Z.
All authors have read and agreed to the published version of the manuscript.
Funding: This research was funded by the National Natural Science Foundations of China (No.
11772147), National Natural Science Foundation of China (No. 12027901), Major University Science
Research Project of Jiangsu Province, China (No. 20KJA460001), and Natural Science Foundation of
Jiangsu Province, China (No. BK20200706).
Data Availability Statement: Data presented in this article are available at request from the corre-
sponding author.
Conflicts of Interest: The authors declare no conflict of interest. The funders had no role in the design
of the study; in the collection, analyses, or interpretation of data; in the writing of the manuscript, or
in the decision to publish the results.
References
1. Ramnath, B.V.; Alagarraja, K.; Elanchezhian, C. Review on Sandwich Composite and their Applications. Mater. Today Proc. 2019,
16, 859–864. [CrossRef]
2. Hou, Y.; Neville, R.; Scarpa, F.; Remillat, C.; Gu, B.; Ruzzene, M. Graded conventional-auxetic Kirigami sandwich structures:
Flatwise compression and edgewise loading. Compos. Part B Eng. 2014, 59, 33–42. [CrossRef]
3. Bedon, C.; Amadio, C. Buckling analysis of simply supported flat glass panels subjected to combined in-plane uniaxial compres-
sive and edgewise shear loads. Eng. Struct. 2014, 59, 127–140. [CrossRef]
4. Zhao, C.-Q.; Li, D.-S.; Ge, T.-Q.; Jiang, L.; Jiang, N. Experimental study on the compression properties and failure mechanism of
3D integrated woven spacer composites. Mater. Des. 2014, 56, 50–59. [CrossRef]
5. Fan, H.; Yang, L.; Sun, F.; Fang, D. Compression and bending performances of carbon fiber reinforced lattice-core sandwich
composites. Compos. Part A Appl. Sci. Manuf. 2013, 52, 118–125. [CrossRef]
6. Wang, L.; Liu, W.; Wan, L.; Fang, H.; Hui, D. Mechanical performance of foam-filled lattice composite panels in four-point
bending: Experimental investigation and analytical modeling. Compos. Part B Eng. 2014, 67, 270–279. [CrossRef]
7. Li, J.; Hunt, J.F.; Gong, S.; Cai, Z. Simplified analytical model and balanced design approach for light-weight wood-based
structural panel in bending. Compos. Struct. 2016, 136, 16–24. [CrossRef]
8. Moreno, M.S.; Gutiérrez, A.R.; Vicente, J.L.M. Different response under tension and compression of unidirectional carbon fibre
laminates in a three-point bending test. Compos. Struct. 2016, 136, 706–711. [CrossRef]
9. Liu, J.; He, Z.; Liu, J.; Huang, W. Bending response and failure mechanism of composite sandwich panel with Y-frame core.
Thin-Walled Struct. 2019, 145, 106387. [CrossRef]
10. Sun, Y.; Guo, L.-C.; Wang, T.-S.; Yao, L.-J.; Sun, X.-Y. Bending strength and failure of single-layer and double-layer sandwich
structure with graded truss core. Compos. Struct. 2019, 226, 111204. [CrossRef]
11. Mouritz, A. Review of z-pinned laminates and sandwich composites. Compos. Part A Appl. Sci. Manuf. 2020, 139, 106128.
[CrossRef]You can also read