PEEK Composites as Self-Lubricating Bush Materials for Articulating Revolute Pin Joints
←
→
Page content transcription
If your browser does not render page correctly, please read the page content below
polymers
Article
PEEK Composites as Self-Lubricating Bush Materials
for Articulating Revolute Pin Joints
Juanjuan Zhu 1, * , Fang Xie 2, * and R S Dwyer-Joyce 1
 1   The Leonardo Centre for Tribology, Department of Mechanical Engineering, University of Sheffield,
     Mappin Street, Sheffield S1 3JD, UK; r.dwyer-joyce@sheffield.ac.uk
 2   School of Mechanical & Automotive Engineering, Nanyang Institute of Technology, Nanyang 473004, China
 *   Correspondence: juan.zhu@sheffield.ac.uk (J.Z.); xiefang@nyist.edu.cn (F.X.)

 Received: 10 February 2020; Accepted: 13 March 2020; Published: 17 March 2020

 Abstract: In this study, bearing bushes made of polyetheretherketone (PEEK), 30 wt % carbon fibre
 reinforced PEEK, 30 wt % glass fibre reinforced PEEK, each 10 wt % of PTFE, graphite and carbon fibre
 modified PEEK were investigated on a purpose built pin joint test rig. The unlubricated friction and
 wear behaviour was assessed in sliding contact with a 300M shaft, subjected to a nominal pressure of
 93 MPa, articulating sliding speed of 45 ◦ /s. The worn surface and the subsurface layer were studied
 using optical profilometry and scanning electron microscopy (SEM). Due to thermal sensitivity of
 PEEK composites, friction energy and temperature rise were analysed for determining the friction and
 wear mechanism. The bush made of PTFE, graphite and carbon fibre (each 10 wt %) modified PEEK
 presented the best performance for friction coefficient, wear loss, friction energy and temperature
 rise. Current work demonstrated that reinforcement modified PEEK composite possesses desirable
 properties to perform as a load bearing bush in certain tribological applications.

 Keywords: PEEK composites; reinforcements; self-lubricating bush; friction and wear; pin joints

1. Introduction
      Compared with metals, polymers possess certain desired properties for engineering use,
i.e., lightweight (low density), low cost, ease of manufacturing, self-lubricating and corrosion
resistance [1–4]. They can provide significant weight savings while maintaining structural performance,
and therefore offering improved fuel efficiency for aerospace and other transport applications. In
addition, polymers are increasingly used in tribological applications, especially for harsh lubrication
conditions, such as bearings, gears, piston rings and seals in aerospace machines and ocean engineering
machines or other mechanical components used in high temperature and corrosive environment [5–8].
      Among the speciality polymers, polyetheretherketone (PEEK) is one of the most promising
engineering materials for tribological applications. Studies have been conducted on the friction and
wear of pure PEEK in comparison with other polymers [9,10]. However, there are limitations of pure
PEEK, such as low thermal stability, heat conductivity and dissipativity. In order to minimise these
disadvantages and to further improve the friction and wear property, PEEK based composites have
been tailored with variety of reinforcements, fillers and solid lubricants [11]. In the past twenty years,
researchers have made great efforts to develop PEEK-based composites. Mechanical strength, friction
and wear properties were studied for carbon fibre reinforced PEEK composites [12,13]. Sumer et
al. [14] reported that the glass fibre in the composite improved friction and wear under dry sliding
contact. Wang et al. reported that the composite with 7.5 wt % ZrO2 particles produced a low wear
rate and friction coefficient through the block-on-ring tests (PEEK composite block against sliding
steel ring) due to the formation of a thin, uniform and tenacious transfer film at the interface [15]. The

Polymers 2020, 12, 665; doi:10.3390/polym12030665                            www.mdpi.com/journal/polymers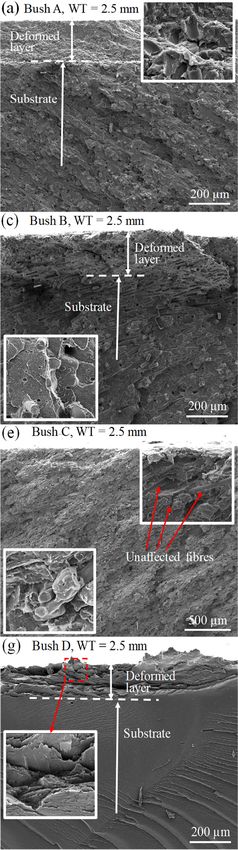
Polymers 2020, 12, 665                                                                                              2 of 16

influence of Polytetrafluoroethylene (PTFE) on the mechanical and tribological properties were studied
by Zhang et al. [16] and Bijwe et al. [17].
      Tribological behaviour of PEEK composites is also affected by the operating environment, i.e., gas,
temperature, lubricant, load, etc. [18–21]. Theiler and Gradt evaluated the tribological behaviour of
PEEK composites in air, vacuum and hydrogen environments [18] from pin-on-disc (PEEK composite
pin against steel disc) contact. It was found that PEEK composites presented lower environmental
sensitivity compared with pure PEEK [18]. Varying lubricants, i.e., water [6,14], sea water [1], mineral
oil [5,21,22] were used in the study of friction and wear for PEEK composites. Zhang et al. observed
enhanced lubricity under boundary and mixed lubrication regime for the PEEK composites reinforced
with graphitic carbon nitride nanosheets when lubricated by PAO4 oil through the plate-on-ring
(PEEK composite plate against sliding steel ring) tests [5].
      Tribological characteristics of PEEK composites are highly dependent on the tribo-system. The
friction energy dissipated in the sliding contact usually causes a consistent temperature rise in the two
contacting bodies [7,23]. The temperature variation in service plays an important role in affecting the
mechanical, physical and thermal properties, resulting in structural changes of polymer components.
Most of the work relating to PEEK composites has been conducted in the lab using standard tribo-meters.
For engineering use, some research has been carried out where PEEK composites form the tribological
component, including ball bearings [8,24], thrust bearing [25], orthopaedic device [26] and crank shaft
bush on the robot joint [27]. There is no work conducted towards journal bearing bushes made of
PEEK composites. The aim of the current work is to investigate the tribological performance of PEEK
composite used as bearing bushes through a purpose build pin joint test rig subjected to a contact
pressure of 93 MPa without lubrication. A thorough assessment was conducted on tested bushes,
including friction coefficient, bush wall deformation, wear rate, friction energy and temperature
increase. The wear tracks and the subsurface layer were examined to assess the tribological behaviour
of PEEK composites used as load bearing bush material.

2. Experimental Methods

2.1. Specimen
     In this work, pure PEEK and three PEEK composites produced by injection moulding (Ensinger Ltd.,
Manchester, UK) were studied. The as-bought materials had the same shape and size (bar with outer
diameter of 25 mm). The melting temperature was 334 ◦ C from the manufacture’s data sheet. The
three PEEK composites were: 30 wt % carbon fibre (~6 µm diameter) reinforced PEEK; 30 wt %
glass fibre (~15 µm diameter) reinforced PEEK and each 10 wt % of PTFE, graphite and carbon fibre
modified PEEK. Unfilled PEEK was tested for comparison. Figure 1 shows the SEM images of the
fracture cross-section for PEEK and PEEK composites, in which how the reinforced fibres distribute and
orientate in the matrix are indicated. These reinforced and unreinforced PEEKs were thereafter referred
to Bush A, B, C and D respectively, listed in Table 1, including their mechanical and thermal properties.

          Table 1. Composition, mechanical and thermal properties of PEEK and PEEK composites [28].

                                                   Elastic    Compression     Rockwell    Elongation       Thermal
                 PEEK Composite        Density,
   Specimen                                       Modulus,   Strength @ 10%   Hardness,    at Break      Conductivity,
                 Reinforcements         g/cm3
                                                    GPa        Strain, MPa    M Scale     @22.8 ◦ C, %    Wm−1 ◦ C−1
     Bush A     30 wt % carbon fibre     1.41       6.34          165           107            7             0.92
     Bush B      30 wt % glass fibre     1.53       6.89          172           103           2.2             0.3
                    10 wt % each,
     Bush C         carbon fibre,        1.46       5.52          114            95           2.5            0.82
                   graphite, PTFE
     Bush D             None             1.31       4.48          121            99           40             0.29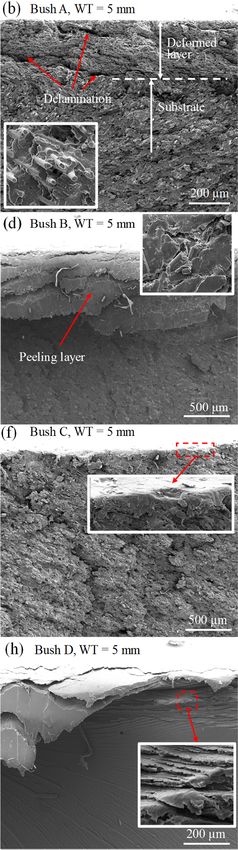
referred to Bush A, B, C and D respectively, listed in Table 1, including their mechanical and thermal
properties.
Polymers 2020, 12, 665 3 of 16
Polymers 2020, 12, x FOR PEER REVIEW
(a) (b) 3 of 16
(c) (d)
Figure 1.1.SEM
SEMimages
images of fracture
of fracture cross-section
cross-section for polyetheretherketone
for polyetheretherketone (PEEK) and(PEEK)
PEEK and PEEK
composites,
composites, (a) 30 wt
(a) 30 wt % carbon %reinforced
fibre carbon fibre reinforced
PEEK, PEEK,
(b) 30 wt (b) fibre
% glass 30 wtreinforced
% glass fibre
PEEK,reinforced PEEK,
(c) each 10 wt %(c)
of
each
PTFE,10graphite
wt % of and
PTFE, graphite
carbon fibreand carbonPEEK,
modified fibre modified PEEK, (d) neat PEEK.
(d) neat PEEK.
PEEK and PEEK composite bars were mechanically machined to bush halves for testing.
PEEK testing. The
machining process involved turning the outer diameter to 15 and 20 mm, mm, bored
bored inner
inner hole
hole and
and precise
precise
reaming to the final inner diameter 10 mm, which left the roughness Ra = 0.7–1.1
= 0.7–1.1 μmµm for the bearing
surface. Bushes were
wereslit
slitinto
intohalves to to
halves accommodate
accommodatethe the
loading design
loading on the
design onpin
thejoint
pintest rig,test
joint shown
rig,
in Figure
shown 2a. Figure
in Figure 2b,c shows
2a. Figure bush samples,
2b,c shows bush holder
bush samples, and bush/pin
bush holder contact
and bush/pin configuration.
contact configuration.
2.2. Wear Test 1. Composition, mechanical and thermal properties of PEEK and PEEK composites [28].
Table
Wear tests were
PEEKperformed on a pin joint rig, shown in Figure 2a. To apply
Compressio the normal load, the
Elongatio
loading platform (shown in Figure Elastic
2b) with fitted lower bush Rockwell
holder was raised using Thermal
an Enerpac
Specime Composite Density n Strength @ n at Break
RSM200 manual hydraulic cylinder, Modulus
while the upper bush holderHardness
was kept static. The Conductivity
shaft was driven
n Reinforcement , g/cm3 10% Strain, @22.8 °C,
by an AKM42H (120 , GPa , M Scale , Wm −1°C−1
s V) motor attached with a Micron XTRUE 160 planetary gearhead.
MPa % In this study,
the shaft performed an oscillating motion from −60◦ to +60◦ at a speed of 45 ◦ /s (3.9 mm/s). A C-FW
30 wt % carbon
Bush A
compression cell (capacity1.41
loadfibre of 100 kN)6.34
was located165under the platform
107 7
for measuring 0.92
the normal
load. A plunger dial
30 wt % indicator
glass was attached to the loading platform to record its vertical displacement,
Bushwas
which B the radial deformation 1.53occurring
6.89 in the bush
172wall. A FUTEK
103 FSH02059 2.2 torque transducer
0.3
fibre
(200 Nm capacity,
10 wt Irvine,
% each,CA, USA) was used to measure the frictional torque between the bush and
shaft. The
Bush C overall monitoring,
carbon fibre, recording 5.52
1.46 and control of the rig was via
114 95 a PC using 2.5a software0.82program
written in LabVIEW (National
graphite, PTFE Instruments, Austin, TX, USA). More details of the test rig have been
reported
Bush Din [29]. None 1.31 4.48 121 99 40 0.29
2.2. Wear Test
Wear tests were performed on a pin joint rig, shown in Figure 2a. To apply the normal load, the
loading platform (shown in Figure 2b) with fitted lower bush holder was raised using an Enerpac
RSM200 manual hydraulic cylinder, while the upper bush holder was kept static. The shaft was
driven by an AKM42H (120 V) motor attached with a Micron XTRUE 160 planetary gearhead. In this
study, the shaft performed an oscillating motion from −60° to +60° at a speed of 45 °/s (3.9 mm/s). A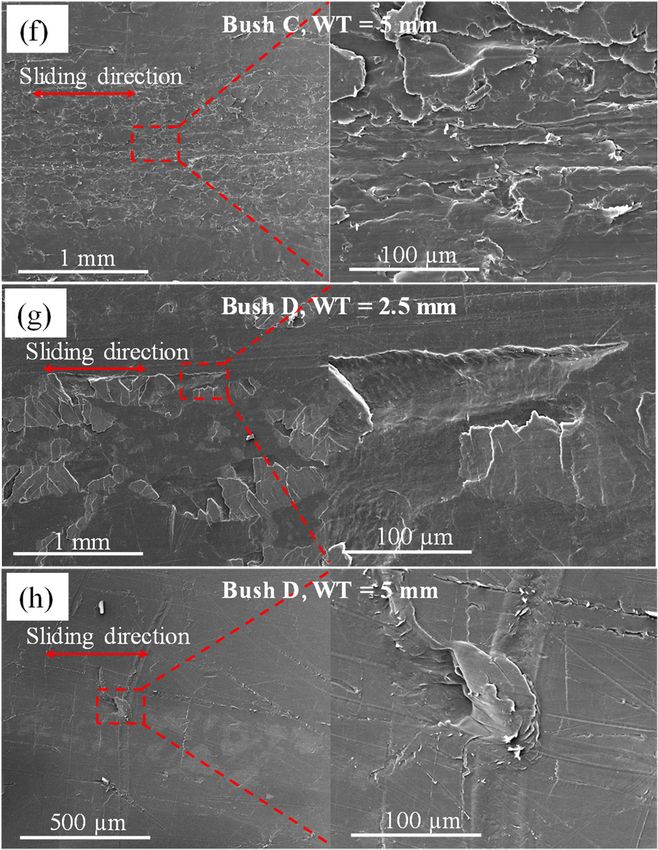
with isopropanol in an ultrasonic bath. Bush wall thickness (WT) and mass were measured before
and after each test. Mass loss (Δm) and wall thickness change were recorded for assessing the wear
resistance.
A 300M steel shaft with a diameter of 10 mm and surface roughness Ra = 0.5 μm was adopted
to contact with the bush specimen. It was cleaned with isopropanol prior to each test and reused.
Polymers 2020, 12, 665 4 of 16
Tests were carried out without lubricant and at room temperature and humidity. Three repeats for
each test were conducted using fresh bushes and a newly cleaned shaft.
(a) (b)
Thermocouple
hole
upper bush
T
α
v
Lower bush
P
(c) (d)
Figure2.2.Pin
Figure Pinjoint
joint test
test rigrig
andand
bushbush specimen
specimen arrangement,
arrangement, (a) photo
(a) photo of the
of the pin pin
joint testjoint testloading
rig; (b) rig; (b)
loading platform
platform with pin/bush
with pin/bush assembly,assembly,
bush halvesbush halves
located in located in twoholders
two separate separate holders
above above the
and below and
belowinset:
shaft, the bush
shaft,specimens
inset: bush specimens
made of PEEK andmade of PEEK
PEEK and PEEK
composites; composites;
(c) thermocouple (c) thermocouple
location; (d) contact
location; (d)
geometry contact
between geometry
shaft between
and bush halvesshaft and bush
subjected halvesload
to normal subjected to normal
P applied from the load
lowerP applied from
bush, shaft
the lower bush,
oscillating speed shaft
v andoscillating speed v and
required frictional required
torque T. frictional torque T.
ABased
thermocouple hole was
on the contact drilledshown
geometry in the bush wall, 2d,
in Figure 1.2 and 2.5 mm deep
the nominal contactagainst the inner
pressure surface
between the
for wall thickness
rotating pin and the2.5 bush
and 5half,
mm p, respectively, shown
and the friction in Figure μ,
coefficient, 2d.are
The temperature
calculated fromchange in the
the following
wall material was measured using a K-type thermocouple. Figure 2c shows the assembly of bush,
equations,
bush holder and thermocouple. A fresh bush pair was P used for each test. Prior to test, bushes were
cleaned with isopropanol in an ultrasonic bath. p = Bush wall thickness (WT) and mass were measured (1)
2RLsin(α/2)
before and after each test. Mass loss (∆m) and wall thickness change were recorded for assessing the
wear resistance. T
A 300M steel shaft with a diameter of 10 mmμ and = surface roughness Ra = 0.5 µm was adopted (2)
2PR to
contact
where P with thenormal
is the bush specimen.
load, 9 kN,It R
was cleaned
is the radiuswith isopropanol
of the priorLtoiseach
shaft, 10 mm, test andwidth,
the contact reused.
andTests
α is
were carried out without lubricant and at room temperature and humidity. Three
the arc angle of the bush halve. It should be noted that even though every effort has been made repeats for each test
in
were conducted using fresh bushes and a newly cleaned shaft.
sample preparation to reduce the variance between bush halves, it was impossible to have exactly
Basedsamples.
identical on the Incontact geometry
this work, shownmechanisms
the contact in Figure 2d, fromthethenominal
lower and contact
upperpressure between
bush halves were
the rotating pin and the bush half, p, and the friction coefficient,
assumed to be the same, i.e., same friction force/torque occurred from each bush half.µ, are calculated from the
following
Tableequations,
2 shows the testing conditions including the shaft and bush dimensions. Due to the
P
p=
varying reinforcements, differences in mechanical and tribological properties were expected. In order (1)
2RLsin(α/2)
T
µ= (2)
2PR
where P is the normal load, 9 kN, R is the radius of the shaft, 10 mm, L is the contact width, and α
is the arc angle of the bush halve. It should be noted that even though every effort has been made
in sample preparation to reduce the variance between bush halves, it was impossible to have exactly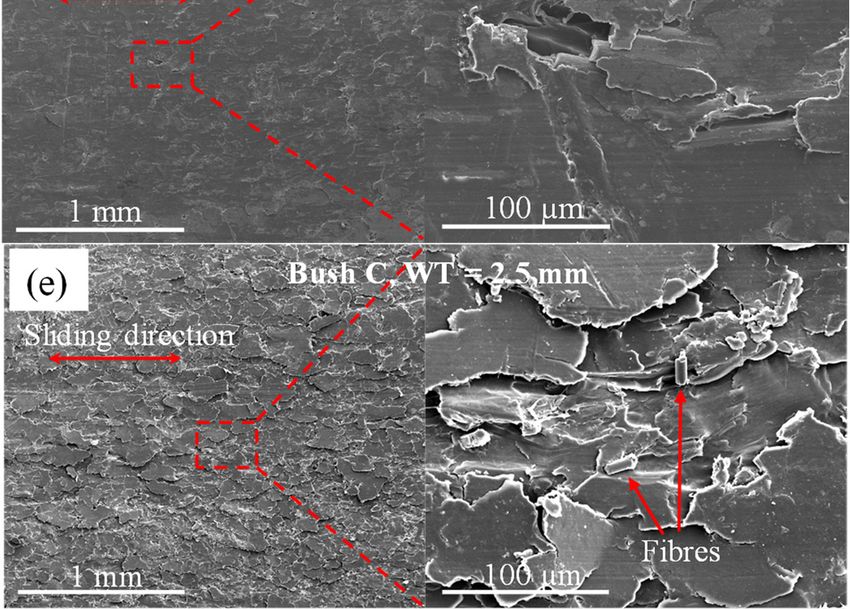
Polymers 2020, 12, 665                                                                                            5 of 16

identical samples. In this work, the contact mechanisms from the lower and upper bush halves were
assumed to be the same, i.e., same friction force/torque occurred from each bush half.
     Table 2 shows the testing conditions including the shaft and bush dimensions. Due to the varying
reinforcements, differences in mechanical and tribological properties were expected. In order to
fully understand their tribological capacity, varying test durations were applied. A defined radial
deformation of the bush wall was used as an indicator to end the test. In testing, the reading from the
plunger dial indicator was used to calculate the deformation in the bush wall. The test was manually
stopped when the wall thickness change was 10% of its original thickness, which was defined as a
failure in this study. The corresponding maximum articulating cycles were then compared among
tested bushes. There was an exception for the Bush C (WT = 5 mm) caused by excessive lower
deformation. In this case, the test was ended after 6 h running.

                                         Table 2. Oscillating test conditions.

    Nominal        Articulating    Articulating      Pin            Bush Arc    Bush         Bush Wall     Oscillating
    Contact        Displacement       Speed         Radius           Angle      Width        Thickness      Cycles
    Pressure
   p = 93 MPa       −60◦ to +60◦      45 ◦ /s      R = 5 mm           120◦     L = 10 mm   WT = 2.5/5 mm      Vary
                                   (3.9 mm/s)

    Friction coefficient and wear coefficient (referred to as mass loss) were used to analyse the contact
mechanism between the shaft and bush. Wear was measured by mass loss, ∆m. Wear coefficient of the
material W, in mm3 /Nm, was calculated using the following equation,

                                                               ∆m
                                                      W=                                                             (3)
                                                               ρPS

where ρ is the density of the specimen listed in Table 1, P is the normal load, and S is the total
sliding distance.
      During the test, frictional heating occurred [30] at the contact between the shaft and bush halves
due to combined normal and tangential loading. As polymers are more sensitive to mechanical stresses
and temperature [31], it is necessary to take into account frictional energy in the investigation of the
friction and wear properties. For the current contact configuration, the frictional energy equals the work
required to enable the shaft to rotate inside the bush halves. It is calculated by the following equation,
                                                           Z   te
                                                  E = Pv            µ(t)dt                                           (4)
                                                              ts

where v is the sliding speed, 3.9 mm/s, µ(t) is the coefficient of friction (CoF), the shaft starts articulating
at ts and ends at te .
      Specific wear energy [23] that combines friction coefficient and wear was used to assess the friction
and wear properties. It is the ratio of the frictional work divided by the bush mass loss in the wear
process, shown as the following equation,
                                                        R te
                                                  E   Pv t µ(t)dt
                                                          s
                                            Ew =    =                                                                (5)
                                                 ∆m       ∆m

2.3. Characterization
    In this study, an Inspect F FEG-SEM (FEI, Eindhoven, Netherlands) was used to characterize
worn surfaces of the tested samples. Wear debris were assessed using an Alicona InfiniteFocusSL
microscope (Alicona Imaging GmbH, Graz, Austria). The contact zone on the shaft after each test was
examined by using an optical microscope (Zeiss Optical Microscope, Cambridge, UK). The bush mass
was measured using a Sartorius Electronic Analytical Balance BP210D (accuracy 0.01 mg).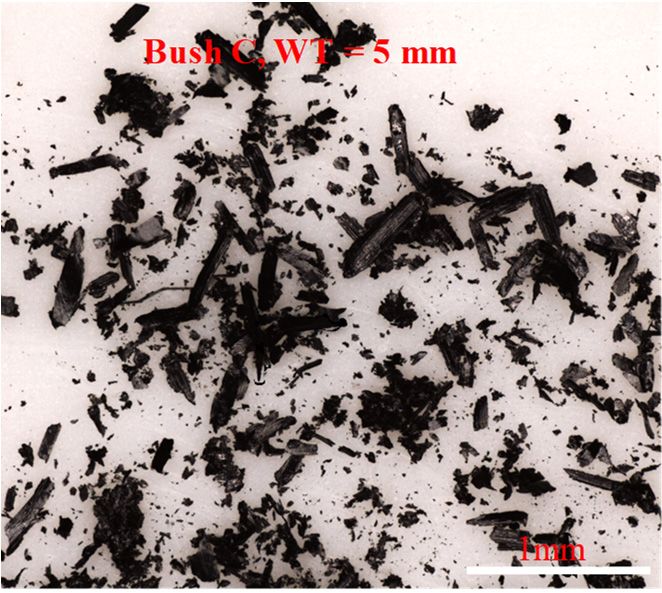
Polymers 2020, 12, x FOR PEER REVIEW 6 of 16
all bushes while the composite C presented the lowest CoF values and temperature increase. This
indicated
Figure that the incorporation
3 presents three repeats of of
PTFE, graphite
the wear and
test for carbon
Bush fibre significantly
A, characterised by CoFreduced both the
and temperature
friction and temperature rise.
in the bush wall. It can be seen that good repeatability was seen among the three repeats. The small
Comparing
difference of CoFthe two
and bush wall thicknesses,
temperature curves may the arisethinner
from theones had slightly
variance higher CoF
of specimen andtexture
surface lower
Polymers 2020, 12,increase.
temperature 665 As they were subjected to the same testing conditions, the difference in6 CoF
of 16
and roughness produced in the process of mechanical machining.
couldTheonly be caused of
comparison byCoF
the energy dissipationincrease
and temperature efficiency.
amongIn other
four words,
composite the bushes
contact are
temperature
shown in
played
Figures
3.
as
Results
an
4 and influential
and5.Discussions
factor for the contact mechanism. Apparently, thinner
The tests for Bush A, B and D were stopped when the bush wall thickness reached wall bushes reduceda
the accumulation of the friction heat by dissipating heat to the adjacent
10% change compared with the original size. Overall, the CoF increased over the testing period metal parts. While for thick
for
wall
3.1. bushes,
Frictionwhile
all bushes the
and Wear increase in contact temperature decreases the stiffness of
the composite C presented the lowest CoF values and temperature increase. Thisthe matrix, the shear
strength,
indicated and therefore resulted inofa PTFE,
lower CoF [32]. and carbon fibre significantly reduced both the
Figurethat the incorporation
3 presents three repeats graphite
of the wear test for Bush A, characterised by CoF and temperature
For
friction the first
andwall. 300
temperature cycles in Figure 4a,d, the carbon fibre reinforcement in Bush A did not seem to
in the bush It can berise.
seen that good repeatability was seen among the three repeats. The small
reduce the frictionthe
Comparing as unfilled
bushPEEK shows a constant and relatively lower CoF.higher
Compared with Bush
difference of CoF andtwo temperature wall thicknesses,
curves may arisethefrom
thinner ones had
the variance ofslightly
specimen CoFtexture
surface and lower
and
B (glass
temperaturefibre reinforced)
increase. As and
they Bush
were D (unfilled
subjected PEEK),
to the Bush
same A did
testing show improved
conditions, the bearing
difference capacity
in CoF
roughness produced in the process of mechanical machining.
(higher
could onlyarticulating
be caused cycles),
by thewhich
energyis in agreementefficiency.
dissipation with the findings
In other of [1]. the contact temperature
words,
played
0.6 as an influential factor for the contact mechanism. 140 Apparently, thinner wall bushes reduced
Temperature in bush wall, °C
the accumulation
0.5
of the friction heat by dissipating heat
120to the adjacent metal parts. While for thick
wall bushes, the increase in contact temperature decreases 100 the stiffness of the matrix, the shear
0.4
strength, and therefore resulted in a lower CoF [32]. 80
CoF
0.3
For the first 300 cycles in Figure 4a,d, the carbon fibre 60 reinforcement in Bush A did not seem to
0.2
reduce the friction as unfilled PEEK shows 40 relatively lower CoF. Compared
1st test a constant and 1stwith
test Bush
0.1 2nd test 2nd test
B (glass fibre reinforced) and Bush D (unfilled 20
PEEK), Bush A did show improved bearing capacity
3rd test 3rd test
(higher0 articulating cycles), which is in agreement with the 0 findings of [1].
0 300 600 900 1200 1500 1800 0 300 600 900 1200 1500 1800
Articulating cyclces Articulating cyclces
0.6 140
Temperature in bush wall, °C
(a) (b)
0.5 120
Figure 3. 100 with articulating cycles; (b) temperature
0.4
Figure 3. Three
Three repeat
repeat wear
wear tests
tests for
for Bush
Bush A:
A: (a)
(a) CoF
CoF varying
varying with articulating cycles; (b) temperature
rise in the bush wall varying with articulating cycles. 80
CoF
rise in the bush wall varying with articulating cycles.
0.3
0.6 0.6
60
Bush A Bush B
0.2
0.5
Thecomparison of CoF and temperature 1st test increase 0.5
40
among four composite bushes are1stshown test in
0.1 2nd test 2nd test
0.4 4 and 5. The tests for Bush A, B3rd
Figures and 20
0.4
test D were stopped when the bush wall thickness3rdreached test a
0 0
CoF
CoF
0.3 0.3
10% change compared with the original size. Overall, the CoF increased over the testing period for
0 300 600 900 1200 1500 1800 0 300 600 900 1200 1500 1800
all bushes
0.2 while theArticulating
composite C presented the lowest0.2
cyclces CoF values and temperature
Articulating cyclces increase. This
indicated
Figure
0.1 that
3. Three repeat(a)
the incorporation
wear testsoffor
PTFE,
WT Bush
= 5 mmA: graphite
(a) CoF and0.1carbon
varying with fibre (b)
significantly
articulating cycles; (b) WT = 5 mm
reduced
temperatureboth the
WT = 2.5 mm WT = 2.5 mm
friction0 and
rise temperature
in the rise. with articulating cycles.
bush wall varying 0
0 300 600 900 1200 1500 1800 0 30 60 90 120 150 180
Articulating cyclces Articulating cycles
0.6 0.6
(a)
Bush A (b) B
Bush
0.5
0.6 0.5
0.6
Bush C Bush D
0.4
0.5 0.4
0.5
CoF CoF
CoF CoF
0.3
0.4 0.3
0.4
WT = 5 mm
0.2
0.3 WT = 2.5 mm 0.2
0.3
WT = 5 mm WT = 5 mm
0.1
0.2 0.1
0.2
WT = 2.5 mm WT = 2.5 mm
0.10 0.10 WT = 5 mm
0 300 600 900 1200 1500 1800 0 30 60 90 120 WT150
= 2.5 mm180
0 Articulating cyclces 0 Articulating cycles
0 500 1000 1500 2000 2500 3000 3500 4000 0 50 100 150 200 250 300
(a) cycles
Articulating (b) cycles
Articulating
0.6 0.6
(c)
Bush C (d) D
Bush
0.5 0.5
0.4 0.4
WT = 5 mm
CoF
CoF
0.3 WT = 2.5 mm 0.3
0.2 0.2
0.1 0.1 WT = 5 mm
WT = 2.5 mm
0 0
0 500 1000 1500 2000 2500 3000 3500 4000 0 50 100 150 200 250 300
Articulating cycles Articulating cycles
(c) (d)
Figure 4. Typical evolution of CoF and recorded temperature varying with articulating cycles for
(a) Bush A; (b) Bush B; (c) Bush C; (d) Bush D.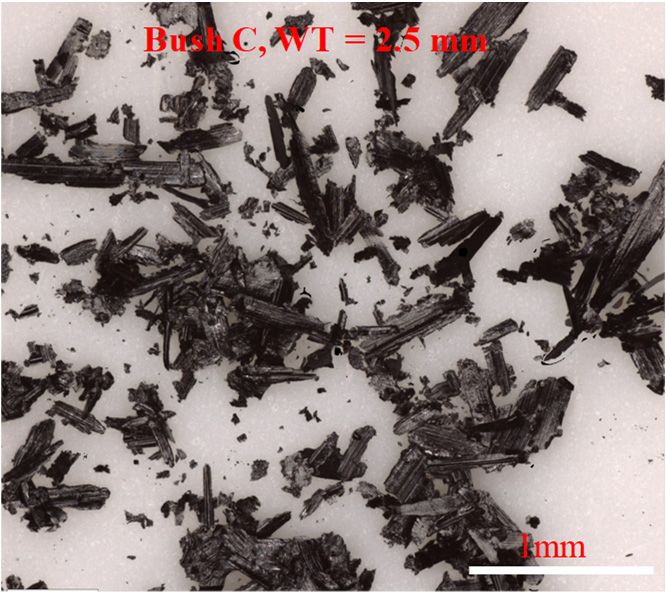
Polymers 2020, 12, x FOR PEER REVIEW 7 of 16
Polymers 2020, 12,
Figure 665
4. Typical evolution of CoF and recorded temperature varying with articulating cycles for (a)7 of 16
Bush A; (b) Bush B; (c) Bush C; (d) Bush D.
100 WT = 5 mm
WT = 2.5 mm
Temperature increase, ºC
80
60
40
20
0
Bush A Bush B Bush C Bush D
Figure 5. Temperature
Figure5. Temperatureincrease
increasein
inthe
themiddle
middleof
ofthe
thebush
bushwall
wallthickness.
thickness.
Comparing
After each test,the two bush wall
the bush wall thickness
thicknesses, was the thinner ones
measured had slightly
to determine higher CoF
maximum wall and lower
reduction,
temperature
as shown in Tableincrease. As they
3. Under the were
same subjected to the same
load, the thinner bushes testing conditions,
presented the difference
more deformation in CoF
indicating
could only be caused by the energy dissipation efficiency. In other
lower load bearing capacity. For Bush A, the highest radial deformation, 14.09% reduction, waswords, the contact temperature
played
observedas an influential
at WT = 2.5 mm. factor for the contactBush
Unsurprisingly, mechanism.
C showed Apparently,
the lowestthinner wall bushes
deformation for bothreduced the
wall sizes.
accumulation
During the wear of the friction
test, there heat by wear
was no dissipating
debrisheat to thefor
observed adjacent
Bush Bmetal
and D.parts.
TheWhile for thick
bush mass losswall
was
bushes, the increase in contact temperature decreases the stiffness of
also too low to be measured. The wear coefficients for Bushes A and C were calculated from theirthe matrix, the shear strength,
and
mass therefore
loss andresulted
are shown in ainlower
TableCoF [32].CoF and wear loss for Bush A were found to be significantly
3. Both
higherForthan
the first
that300 cyclesC.inIn
of Bush Figure
other4a,d,words,the Bush
carbon C fibre reinforcement
exhibited in Bush bearing
notably superior A did not seem to
properties
reduce
among the four tested composites. From this study, it is clear that no correlation between massBush
the friction as unfilled PEEK shows a constant and relatively lower CoF. Compared with loss
Band
(glass fibre reinforced) and Bush D (unfilled PEEK), Bush A did show improved
bearing capacity can be concluded. The friction coefficient and wear loss did not provide enough bearing capacity
(higher articulating
information cycles),
to disclose the which
contactismechanism
in agreement withAs
either. thethere
findings
was ofno[1].
wear loss occurred on Bush B
After each test, the bush wall thickness was measured
and D, in order to compare the contact mechanism among the tested bushes, to determine maximum wall reduction,
it is necessary to study
as shown in Table 3. Under
the interface at a microscopic scale. the same load, the thinner bushes presented more deformation indicating
lower load bearing capacity. For Bush A, the highest radial deformation, 14.09% reduction, was
observed atTableWT =3. 2.5 mm. Unsurprisingly,
Maximum radial change ofBush C showed
the bush wall andthe lowest
wear deformation
coefficient for testedforbushes.
both wall sizes.
During the wear test, there was no wear debris observed for Bush B and D. The bush mass loss was
also too low to be measured. The wear coefficients BushforABushes A and C were Bush C
calculated from their
WT, mm 2.5 5 2.5
mass loss and are shown in Table 3. Both CoF and wear loss for Bush A were found to be significantly 5
higher than Wear coefficient, ×10 −6
that of Bush C. In other words,4.33 ±Bush
0.78 C3.76exhibited
± 0.65 notably superior
0.73 ± 0.04 bearing
0.13 ± 0.04 properties
among the four tested mm composites.
3 /Nm From this study, it is clear that no correlation between mass loss
and bearing capacity can be concluded. The friction coefficient and wear loss did not provide enough
3.2. Wear Debris
information and Worn
to disclose theSurfaces
contact mechanism either. As there was no wear loss occurred on Bush B
and D, In order to understandthe
in order to compare thecontact mechanismwear
wear mechanism, among the from
debris testedBush
bushes,
A andit isCnecessary to study
were collected and
the interface
assessed usingat athe
microscopic scale.
Alicona InfiniteFocusSL, shown in Figure 6. No wear debris were observed from
Bush B (glass fibre reinforced) and D (unfilled PEEK) from the bush wear test. For carbon fibre
Maximum radial change of the bush wall and wear coefficient for tested bushes.
reinforcedTable
Bush3.A, large fragments of debris, up to 3–5mm in length, were observed, while the 2.5
mm wall bush produced similar but thicker flakes, shown in Figure 6a,b. The highest
Bush A Bush C wear loss and
wear coefficient were presented by Bush A when WT = 2.5 mm. Figure 6c,d shows much finer wear
WT, mm 2.5 5 2.5 5
debris from Bush C. Slightly coarse wear particles were found for thicker wall bush. The presence of
Wear coefficient, ×10−6 mm3 /Nm 4.33 ± 0.78 3.76 ± 0.65 0.73 ± 0.04 0.13 ± 0.04
graphite and PTFE in the matrix reduced the formation of larger debris chips.
3.2. Wear Debris and Worn Surfaces
In order to understand the wear mechanism, wear debris from Bush A and C were collected
and assessed using the Alicona InfiniteFocusSL, shown in Figure 6. No wear debris were observed
from Bush B (glass fibre reinforced) and D (unfilled PEEK) from the bush wear test. For carbon fibre
reinforced Bush A, large fragments of debris, up to 3–5mm in length, were observed, while the 2.5 mm
wall bush produced similar but thicker flakes, shown in Figure 6a,b. The highest wear loss and wear
coefficient were presented by Bush A when WT = 2.5 mm. Figure 6c,d shows much finer wear debris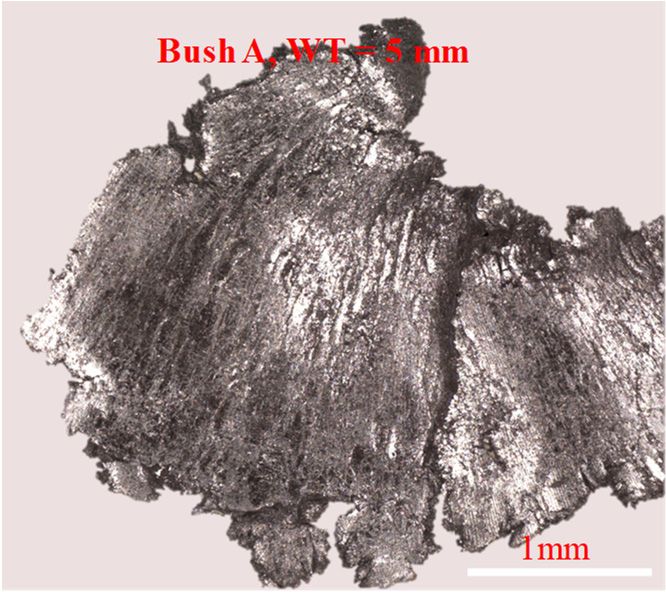
Polymers 2020, 12, 665 8 of 16
from Bush C. Slightly coarse wear particles were found for thicker wall bush. The presence of graphite
and PTFE in the matrix reduced the formation of larger debris chips.
Polymers 2020, 12, x FOR PEER REVIEW 8 of 16
(a) (b)
(c) (d)
Figure 6. Typical
Figure 6. Typicaldebris
debrisobserved
observedfrom
fromthe wear
the testtest
wear forfor
(a) (a)
andand
(b) (b)
Bush A; (c)
Bush A;and (d) Bush
(c) and C forCwall
(d) Bush for
thickness 2.5 and
wall thickness 2.55 mm,
and 5respectively. No wearNo
mm, respectively. debris
wearobserved from Bushfrom
debris observed B (glass
Bushfibre reinforced
B (glass fibre
PEEK) and PEEK)
reinforced Bush Dand(unfilled
Bush D PEEK).
(unfilled PEEK).
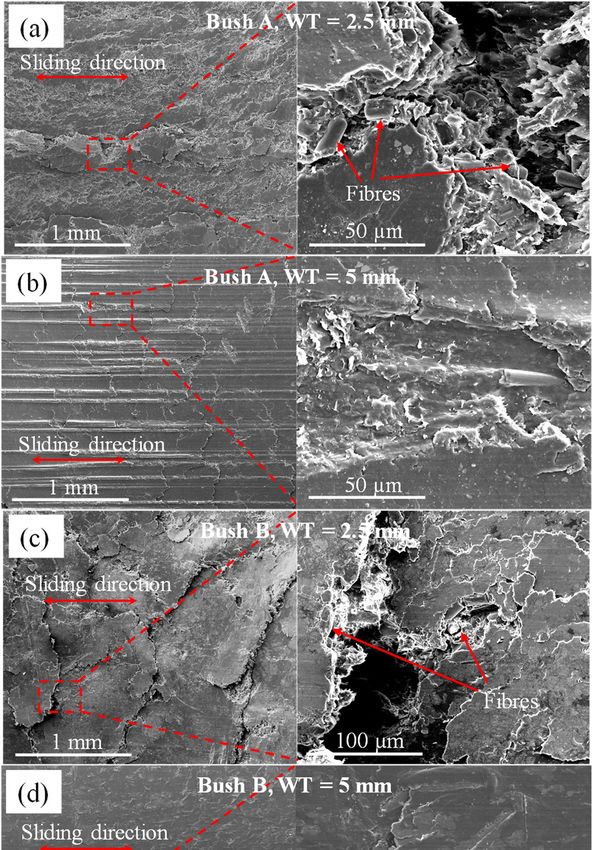
Figure
Figure 77 gives
gives lower
lower andand higher
higher magnification
magnification SEM SEM images
images ofof the
the top-view
top-view worn
worn surfaces
surfaces from
from
tested
tested bushes.
bushes.ItItisis
clear that
clear under
that the combined
under the combined actionaction
of compression, shearing
of compression, and frictional
shearing heating,
and frictional
PEEK
heating,andPEEK
PEEKand composites displayed diverse
PEEK composites displayedpatterns on the
diverse surface
patterns onlayer, caused by
the surface different
layer, causedwearby
mechanisms. Due to repeated stressing, cracks were produced at the surface
different wear mechanisms. Due to repeated stressing, cracks were produced at the surface and/or and/or just sub-surface
in the
just composite.inThese
sub-surface cracks gradually
the composite. grew and
These cracks joined each
gradually grew other until wear
and joined eachdebris, including
other until wear
spalls, were detached after a certain number of stressing cycles. Therefore, adhesion
debris, including spalls, were detached after a certain number of stressing cycles. Therefore, adhesion and fatigue were
the
andmain wear
fatigue weremechanisms
the main wear occurring at the interfaces.
mechanisms occurring Bushes with thinner
at the interfaces. walls
Bushes showed
with thinner patches
walls
of overlapping platelets on the surface, demonstrating a severe deformation
showed patches of overlapping platelets on the surface, demonstrating a severe deformation and and shearing of the
surface materials.
shearing of the surface materials.
Bush
Bush B B showed
showed the the overall
overall worst
worst case,
case, with
with large
large blocky
blocky particles
particles over
over 11 mm
mm inin length.
length. ForFor fibre
fibre
reinforced matrixes, shown in the higher magnification images in Figure
reinforced matrixes, shown in the higher magnification images in Figure 7a,c,e, fibres were pulled7a,c,e, fibres were pulled
out,
out, broken
broken and
and crushed,
crushed, either
either exposed
exposed on on the
the surface
surface oror pressed
pressed in in the
the deformed
deformed layer.
layer. Through
Through
block-on-ring
block-on-ring test,
test, Zhang
Zhang et et al. found that
al. found that carbon
carbon fibre
fibre thinning
thinning (fibre
(fibre wear)
wear) dominate
dominate the the wear
wear
mechanism
mechanism at low pressure of 1MPa [33]. This phenomenon was not observed on tested bushes. It
at low pressure of 1MPa [33]. This phenomenon was not observed on tested bushes. It
implies
implies that
that under
under higher
higher contact
contact pressure
pressure (93(93 MPa),
MPa), the
the contact
contact mechanism
mechanism mainly
mainly fell
fell in
in severe
severe
deformation
deformationand andtearing
tearingofof surface
surfacematerial.
material.Glass fibres
Glass or carbon
fibres fibresfibres
or carbon were broken into short
were broken intopieces,
short
remaining the same diameter, rather than gradually being thinned by shear
pieces, remaining the same diameter, rather than gradually being thinned by shear stress caused stress caused fatigue.
For the thicker wall bushes, a smoother surface layer (Figure 7b,d,f,h) was observed under
fatigue.
the same loading
For the thickerand sliding
wall bushes,conditions.
a smoother Continuous micro
surface layer ploughing
(Figure along
7b,d,f,h) wasthe sliding under
observed direction
the
associated
same loadingwithandplatelet patches
sliding was exhibited
conditions. by Bush
Continuous micro WT = 5mm.along
A at ploughing The wear mechanism
the sliding falls
direction
associated with platelet patches was exhibited by Bush A at WT = 5mm. The wear mechanism falls
into a combination of abrasion and adhesion. These slightly ‘smoother’ surface topographies agreed
with higher articulating cycles in Figure 4, inferring greater bearing capacities for thick wall bushes.
Compared with other bushes, Bush C showed smoother surfaces without gaps between platelet
patches. This was due to the existence of self-lubricating agents, graphite and PTFE, reducing the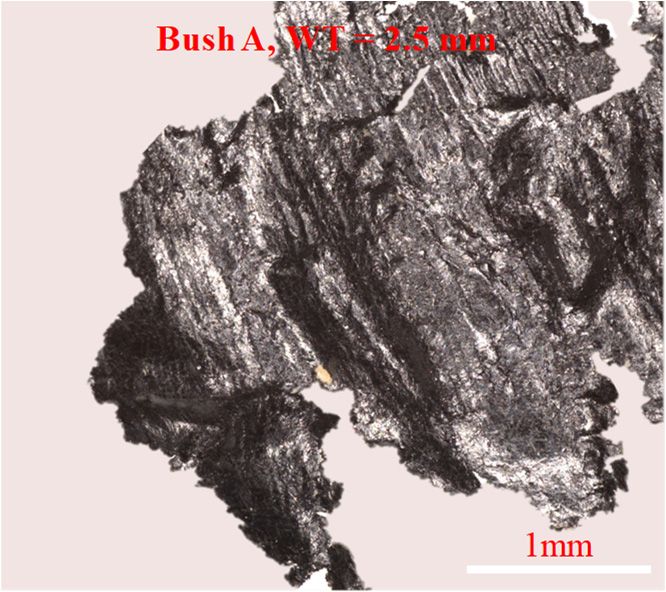
Polymers 2020, 12, 665                                                                                              9 of 16

into a combination of abrasion and adhesion. These slightly ‘smoother’ surface topographies agreed
with higher articulating cycles in Figure 4, inferring greater bearing capacities for thick wall bushes.
Compared with other bushes, Bush C showed smoother surfaces without gaps between platelet patches.
This was due to the existence of self-lubricating agents, graphite and PTFE, reducing the shear stress on
     Polymers 2020,
the interface.      12, x FOR matrix
                 Obvious      PEER REVIEW failure was rarely observed for Bush D (unfilled PEEK)9 while         of 16
     shear stress    on the interface.shear
                                         Obvious matrix shear failure was rarely observed for Bush D (unfilled the
wornPEEK)
      surfacewhile
                showed      some surface
                        the worn    patchesshowed
                                             detached   on the
                                                     some       surface.
                                                             patches      Plastic
                                                                      detached   onflow
                                                                                     the was  observed
                                                                                         surface. Plasticatflow  = 5 mm.
                                                                                                             WTwas
Bush observed
      B and D at showed
                    WT = 5mm.comparable     articulating
                                   Bush B and  D showedcycles     and radial
                                                           comparable          deformation
                                                                        articulating          which
                                                                                     cycles and radialwere   much worse
                                                                                                       deformation
than which
      Bush Awereandmuch      worse
                      C. Glass        thandid
                                  fibres   Bush
                                              notAbring
                                                   and C.anyGlass  fibres did not
                                                              enhancement           bring
                                                                               to the     any enhancement
                                                                                       mechanical   strengthto orthe
                                                                                                                   friction
     mechanical     strength   or
and wear resistance of the matrix.friction and wear  resistance of the matrix.

                                                     Figure 7. Cont.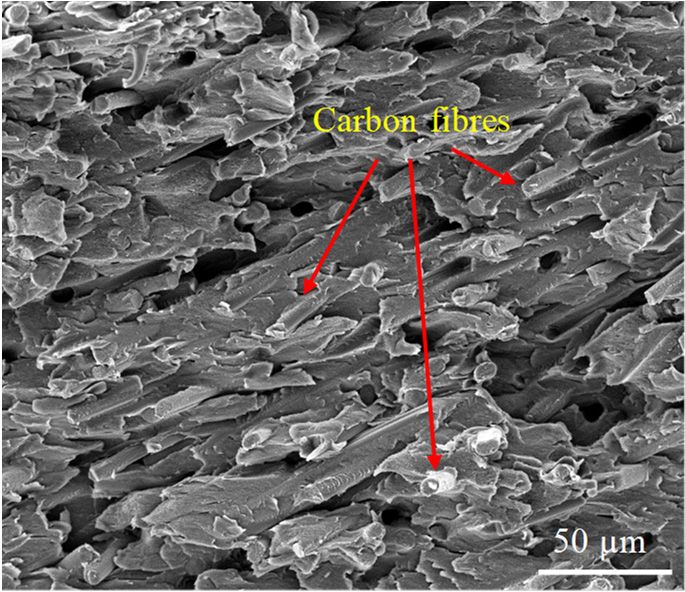
Polymers 2020, 12, 665                                                                                                           10 of 16

      Polymers 2020, 12, x FOR PEER REVIEW                                                                                10 of 16

            Figure 7. SEM images of worn bush surfaces, (a) and (b) Bush A; (c) and (d) Bush B; (e) and (f) Bush
      Figure 7. SEM images of worn bush surfaces, (a) and (b) Bush A; (c) and (d) Bush B; (e) and (f) Bush C;
           C; (g) and (h) Bush D for wall thickness of 2.5 and 5 mm.
      (g) and (h) Bush D for wall thickness of 2.5 and 5 mm.
      3.3. Cross
3.3. Cross       Section
            Section      of Worn
                     of Worn     Surfaces
                              Surfaces
            Worn surface morphology is useful in the analysis of friction and wear behaviour, while
      Worn surface morphology is useful in the analysis of friction and wear behaviour, while subsurface
      subsurface material change provides important information regarding the bulk properties such as
material    change provides important information regarding the bulk properties such as load carrying
      load carrying capacity, resistance to compression, cracking and fatigue. After testing, bush halves
capacity,
      wereresistance
               quenched to   incompression,
                                 liquid nitrogen   cracking     and fatigue.
                                                      and fractured             Afterthe
                                                                         to expose      testing,   bush halves
                                                                                            cross-section.     Figurewere     quenched
                                                                                                                        8 shows
in liquid    nitrogenfor
      fractography        and   fractured
                             tested  bushes to    expose
                                              after cyclic the   cross-section.
                                                            loading   in normal and Figure    8 shows
                                                                                       tangential         fractography
                                                                                                    directions.               for tested
                                                                                                                   The direction
bushesof after
          slidingcyclic   loading
                    is into          in normal
                              the page.            and tangential
                                          An extensively      deformed directions.
                                                                          subsurface The   direction
                                                                                        layer           of sliding
                                                                                                was observed      forisallinto  the page.
                                                                                                                            bushes
      except    Bush    C.  For  example,    Figure   8a  for  the  2.5 mm   thick   Bush   A
An extensively deformed subsurface layer was observed for all bushes except Bush C. For example,shows   a  200  μm   thick    layer
Figurecomposed
         8a for the  of 2.5
                        deformed
                             mm thick material
                                          Bushon  A top
                                                     showsof the  substrate
                                                               a 200         matrix.
                                                                      µm thick        The
                                                                                  layer      surface layer
                                                                                          composed             material appears
                                                                                                         of deformed        material on
top of the substrate matrix. The surface layer material appears compressed by the broken
      compressed      by   the high  normal    load.  The  inset image   shows   the deformed     matrix   with             carbon load.
                                                                                                                  high normal
      fibres and the PEEK. The surface layer in Figure 8b for WT = 5 mm is slightly thicker, around 270 μm,
The inset image shows the deformed matrix with broken carbon fibres and the PEEK. The surface layer
      but less compressed as delaminated sub-layers can be seen. The inset image in Figure 8b shows an
in Figure 8b for WT = 5 mm is slightly thicker, around 270 µm, but less compressed as delaminated
      unmodified substrate matrix. It is reasonable to conclude that the deformation occurring in the
sub-layers      can be seen. The inset image in Figure 8b shows an unmodified substrate matrix. It is
      surface layer is an attribute of the wall thickness reduction. Chen et al. claimed that the exposed
reasonable
      carbon to     conclude
                fibre            that the
                      on the sliding         deformation
                                        surface   carried most occurring    in the
                                                                  of the normal     surface
                                                                                  load          layer isimproved
                                                                                        and therefore     an attribute       of the wall
                                                                                                                       the matrix
thickness     reduction.      Chen    et al. claimed     that   the  exposed    carbon    fibre   on  the  sliding
      load bearing capacity [1]. While in this study, this thick surface layer stacked on top of the substrate       surface      carried
mostmatrix
       of the wasnormal     load and
                      presumed           therefore
                                    to support     theimproved
                                                        normal load  theand
                                                                          matrix   loadfrictional
                                                                             dissipate    bearing heatcapacity     [1]. While
                                                                                                            into bulk     material in this
study,underneath.
         this thick surface layer stacked on top of the substrate matrix was presumed to support the
normal load  Bush   B showed
                  and   dissipatea similar  deformed
                                     frictional    heat depth    aftermaterial
                                                         into bulk     171 articulating   cycles (Figure 8c) compared with
                                                                                  underneath.
      Bush    A  of 882  articulating   cycles   (Figure  8a). A  layer  was
      Bush B showed a similar deformed depth after 171 articulating cycles   detached    from    the substrate
                                                                                                      (Figure 8c)matrix,    shown with
                                                                                                                     compared
      in Figure 8d. Again, in this layer, glass fibres were found to be fractured, crushed and blended in the
Bush A of 882 articulating cycles (Figure 8a). A layer was detached from the substrate matrix, shown
      matrix shown in the inset. Cross sections of the unfilled PEEK bush are shown in Figure 8g,h. Plastic
in Figure 8d. Again, in this layer, glass fibres were found to be fractured, crushed and blended in the
      flow has occurred shown by the inset in Figure 8h.
matrix shown        in the inset.
             Unsurprisingly,      theCross    sections of was
                                       best performance      the unfilled
                                                                   shown byPEEK      bushC are
                                                                              the Bush            shown
                                                                                              (Figure  8e,f).inOnly
                                                                                                                Figure
                                                                                                                     a very8g,h.
                                                                                                                               thinPlastic
flow surface
      has occurred        shown     by  the  inset   in Figure    8h.
                 layer was affected by compression and shearing. In the sliding contact under normal load,
strain occurs both in the normal and tangential directions [33,34]. For the reinforced matrix, normal
and shear stresses transferred at the interface between reinforcements and the matrix material. Due
to the very low surface energy of graphite and PTFE, the shear stress is low leading to a low CoF. As
thePolymers
carbon2020,
fibres were dispersed uniformly in the matrix with varying orientations, the normal stress
12, 665 11 of 16
was therefore supported effectively by high modulus carbon fibres in varying directions [33].
Figure 8. SEM images of cross section of worn surfaces for (a) and (b) Bush A, (c) and (d) Bush B, (e)
andFigure 8. SEM
(f) Bush C, andimages
(g) andof(h)
cross section
Bush D for of worn
wall surfaces
thickness forand
of 2.5 (a) and (b)respectively.
5 mm, Bush A, (c) and (d) Bush B,
(e) and (f) Bush C, and (g) and (h) Bush D for wall thickness of 2.5 and 5 mm, respectively.
3.4. Worn Surface on Shafts
Unsurprisingly, the best performance was shown by the Bush C (Figure 8e,f). Only a very thin
surface layer was affected by compression and shearing. In the sliding contact under normal load,
strain occurs both in the normal and tangential directions [33,34]. For the reinforced matrix, normal
and shear stresses transferred at the interface between reinforcements and the matrix material. Due toPolymers 2020,
Polymers 12,12,
2020, x FOR
665 PEER REVIEW 12 of
12 16
of 16
Figure 9 shows microscopic images of the pin surface before and after contacting with bush
samples
the very(WT low= 5surface
mm). The sliding
energy direction
of graphite andis marked
PTFE, theonshear
Figure 9b. Compared
stress withtothe
is low leading fresh
a low surface
CoF. As the
(Figure
carbon 9a), a continuous
fibres thick layer
were dispersed of transferred
uniformly material
in the matrix withwas observed
varying for the Bush
orientations, A (Figure
the normal 9b).
stress was
It is clear that
therefore material effectively
supported transfer from bush modulus
by high surface has occurred.
carbon fibresWeakening and debonding
in varying directions [33]. between
carbon fibres and the matrix were expected due to the shearing and compression. In sliding, when
the3.4. Wornforce
friction Surface on Shafts
is greater than the adhesive interaction between polymer matrix and reinforcements,
the asperities
Figure of the composite
9 shows material
microscopic can of
images be the
removed to form
pin surface a transfer
before layercontacting
and after on the counterface
with bush
[35]. Bely et al. [36] reported that the transfer of polymer is the most important
samples (WT = 5 mm). The sliding direction is marked on Figure 9b. Compared with the fresh surface characteristic of
adhesive
(Figure wear in polymers.
9a), a continuous Thelayer
thick adhesion processmaterial
of transferred is normally associated
was observed forwith otherA wear
the Bush (Figuretypes
9b). It
(fatigue, abrasion and so on) [35].
is clear that material transfer from bush surface has occurred. Weakening and debonding between
Therefibres
carbon was andno visible wear
the matrix debris
were accumulated
expected due to thenext to theand
shearing sample for Bushes
compression. B and D
In sliding, afterthe
when
testing. However,
friction due to than
force is greater the extreme hard interaction
the adhesive of glass fibres in thepolymer
between Bush B, matrix
fine furrows were observedthe
and reinforcements,
along the sliding direction, shown in Figure 9c. Without contacting with hard
asperities of the composite material can be removed to form a transfer layer on the counterface glass fibres, the shaft
[35].
surface
Bely et al. [36] reported that the transfer of polymer is the most important characteristic ofmaterial
presented limited wear and material transfer (Figure 9e). Even a thin layer of bush adhesive
was deposited
wear on theThe
in polymers. pinadhesion
surface,process
no measurable
is normally mass loss waswith
associated produced for neither
other wear Bush Babrasion
types (fatigue, or D.
This indicated
and so on) [35]. that only the top asperity layer was removed from the bush surfaces while the bulk
matrix underwent a plastic deformation.
Figure 9. Microscopic
Figure images
9. Microscopic imagesof the shaft
of the surfaces,
shaft (a) (a)
surfaces, fresh surface;
fresh (b)(b)
surface; contacted with
contacted Bush
with A; A;
Bush (c) (c)
contacted with Bush B; (d) contacted with Bush C; (e) contacted with Bush
contacted with Bush B; (d) contacted with Bush C; (e) contacted with Bush D.D.
3.5. Friction
ThereEnergy
was no visible wear debris accumulated next to the sample for Bushes B and D after testing.
However, due to the extreme hard of glass fibres in the Bush B, fine furrows were observed along
Over the testing duration, the friction energy that is transformed as a consequence of frictional
the sliding direction, shown in Figure 9c. Without contacting with hard glass fibres, the shaft surface
contact is dissipated and converted to heat, vibration, material deformation or stored in the tribo-
presented limited wear and material transfer (Figure 9e). Even a thin layer of bush material was
system. For sliding between the shaft and bush, the frictional energy and specific frictional energy
deposited on the pin surface, no measurable mass loss was produced for neither Bush B or D. This
were calculated from Equations (4) and (5), respectively (see Table 4). The table includes the overall
indicated that only the top asperity layer was removed from the bush surfaces while the bulk matrix
temperature increase (temperature difference between the start and end of each test). It can be seen
underwent a plastic deformation.
that bush A and C show significantly higher frictional energy compared to Bush B and D. This is
because the testing
3.5. Friction Energydurations (articulating cycles) were much longer than that of Bush B and D. Low
thermal conductivity usually leads to the accumulation of the frictional heat and therefore reduces
Overcapability
the bearing the testing
ofduration,
composites the[37].
friction
This energy that
explains theisperformance
transformedofasBusha consequence
B and D, due of to
frictional
their
contact is dissipated and converted to heat, vibration, material deformation or stored
low thermal conductivities, they showed higher temperature increase and lower articulating cycles in the tribo-system.
to For sliding
failure. Thisbetween the shaft and
is also evidenced bush,
by the the frictional
formation energy layer
of a peeling and specific
shown frictional
in Figure energy
8d,h. The were
calculatedimmediately
multilayers from Equations (4) the
beneath andwear(5), track
respectively
in Figure(see Table the
8h show 4). plastic
The table includesdue
deformation thetooverall
the
combined action of reciprocating shearing and thermal softening. However, Bush A and C be
temperature increase (temperature difference between the start and end of each test). It can haveseen
that bush
similar thermalA and C show significantly
conductivities, 0.92 and 0.82 higher
Wm−1frictional energy compared
°C−1, respectively; to Bush
the articulating B and
cycles of D.
BushThisC is
are more than twice that of Bush A. In this case, CoF played an important role in the temperaturePolymers 2020, 12, 665 13 of 16
because the testing durations (articulating cycles) were much longer than that of Bush B and D. Low
thermal conductivity usually leads to the accumulation of the frictional heat and therefore reduces
the bearing capability of composites [37]. This explains the performance of Bush B and D, due to
their low thermal conductivities, they showed higher temperature increase and lower articulating
cycles to failure. This is also evidenced by the formation of a peeling layer shown in Figure 8d,h. The
multilayers
Polymers immediately
2020, 12, x FOR PEER REVIEWbeneath the wear track in Figure 8h show the plastic deformation 13 dueof to16
the combined action of reciprocating shearing and thermal softening. However, Bush A and C have
similar thermal
increase. In otherconductivities,
words, in order 0.92 to and 0.82good
achieve Wm−1◦ C−1 , respectively;
performance the articulating
of the bearing bush, both cycles
low of Bush
friction
C are moreand
coefficient thanhigh
twice that ofconductivity
thermal Bush A. In this are case, CoF[38].
required played an important role in the temperature
increase.
Due In to other words, in
a significant order to in
difference achieve good performance
articulating cycles for each of the bearing
bush test, itbush, both to
is better lowcompare
friction
coefficient
bushes usingand high thermal
friction energy conductivity
per cycle (Figure are required
10a) and [38].temperature rise per cycle (Figure 10b). It can
be seen that Bush C produced the least friction energy per cycle due to the lowest CoF. Less frictional
heat produced at the interfaceTable leads4.to Frictional energy for tested
lower temperature bushes.in the material bulk, shown in
increase
Figure 10b. The graphite Bush lamellar
A structure reduced Bush B CoF and hence theC heat generation.Bush
Bush In Daddition,
during material deformation, PTFE helped to store much of the work, which was used
WT, mm 2.5 5 2.5 5 2.5 5 2.5 5 in
4J ± ± ± ± ± ± ± ±
crystallographic and amorphous chain rearrangement, resulting in less sample heating 0.13
Friction energy, ×10 4.46 0.48 9.53 0.01 1.08 0.11 0.44 0.01 7.52 1.59 7.15 1.12 0.84 0.16 0.97 [39].
Specific wear energy,
0.29 ± 0.06 0.46 ± 0.09 - - 0.79 ± 0.07 4.36 ± 0.64 - -
Therefore,
×104 J/mgthe thermal softening in Bush C was limited. This agreed with the microscopic
Temperature rise, ◦ C 44.5 ± 3.06 84.16 ± 0.9 48.74 ± 5.58 66.54 ± 6.37 32.47 ± 1.8 37.4 ± 2.31 40.33 ± 10.03 75.02 ± 2.4
morphology displayed in Figure 8e,f where the lest deformation of the material was observed.
Due to a significant difference inFrictional
Table 4. articulating cycles
energy for each
for tested bush test, it is better to compare
bushes.
bushes using friction energy per cycle (Figure 10a) and temperature rise per cycle (Figure 10b). It
Bush A Bush B Bush C Bush D
can be seen that Bush C produced the least friction energy per cycle due to the lowest CoF. Less
WT,heat
frictional mm produced2.5 5
at the interface 2.5 to lower
leads 5 temperature
2.5 5
increase 2.5 material5 bulk,
in the
shown in Figure 10b. The graphite lamellar structure reduced CoF and hence the heat ±generation.
Friction energy, ×10 4.46 ± 9.53 ± 1.08 ± 0.44 ± 7.52 ± 7.15 ± 0.84 0.97 ± In
4
addition, during material deformation, PTFE helped to store much of the work, which was 0.13
J 0.48 0.01 0.11 0.01 1.59 1.12 0.16 used in
Specific wearand amorphous
crystallographic 0.29 ± 0.46
chain ± rearrangement, resulting0.79 ± sample
in less 4.36 ± heating [39]. Therefore,
- - - -
energy,
the thermal×10softening
4 J/mg
in0.06
Bush C was0.09limited. This agreed with the 0.07 0.64 morphology displayed
microscopic
in Figure 8e,f rise,
where 44.5 ± 84.16 ± 48.74 ± 66.54 ± 32.47 ± 37.4 ± 40.33 ± 75.02 ±
Temperature °Cthe lest deformation of the material was observed.
3.06 0.9 5.58 6.37 1.8 2.31 10.03 2.4
70 WT = 5 mm
0.7 WT = 5 mm
WT = 2.5 mm WT = 2.5 mm
60 0.6
Friction energy per cycle,
Temperature increase per
50 0.5
cycle, ºC/cycle
40 0.4
J/cycle
30 0.3
20 0.2
10 0.1
0 0
Bush A Bush B Bush C Bush D Bush A Bush B Bush C Bush D
(a) (b)
Figure
Figure 10.
10. Averaged
Averaged friction
friction energy
energy and
and temperature
temperature increase
increase per
per cycle
cycle for
for tested
tested bushes,
bushes, (a)
(a) friction
friction
energy per cycle; (b) temperature increase per cycle.
energy per cycle; (b) temperature increase per cycle.
4. Conclusions
Conclusions
A comparative
comparative study
studyofofPEEK
PEEKcomposite
composite bushes
bushes forfor
useuse in articulating
in articulating revolute
revolute pin joints
pin joints has
has been
been conducted.
conducted. The friction,
The friction, wear, wear,
frictionfriction
energyenergy and temperature
and temperature risebeen
rise have have been studied.
studied. The
The friction
friction
and wear and wear mechanisms
mechanisms were by
were assessed assessed
studyingbythe
studying the microscopic
microscopic worn surfaces worn
andsurfaces and
deformation
deformation
layer beneath.layer
The beneath. The thermal accumulation
thermal accumulation and dissipationand dissipation
were studied towere studied
improve the to improve the
understanding
understanding of the
of the tribological tribological
performance forperformance for PEEK
PEEK composite usedcomposite
as bearingused as bearing bushes.
bushes.
Due to low thermal conductivity, unfilled PEEK and glass fibre reinforced PEEK presented much
lower articulating cycles to failure than that of graphite, PTFE and carbon fibre filled PEEK. The load
bearing capacity of the composite is much higher than that of the matrix, and thus, any sub-surface
fracture and yielding are diminished due to the presence of the hard and strong reinforcements.
Presence of graphite and PTFE in the PEEK matrix not only reduced shear force at the interface but
also minimised the temperature increase in the bulk material. In addition, the wear resistance wasPolymers 2020, 12, 665 14 of 16
Due to low thermal conductivity, unfilled PEEK and glass fibre reinforced PEEK presented much
lower articulating cycles to failure than that of graphite, PTFE and carbon fibre filled PEEK. The load
bearing capacity of the composite is much higher than that of the matrix, and thus, any sub-surface
fracture and yielding are diminished due to the presence of the hard and strong reinforcements.
Presence of graphite and PTFE in the PEEK matrix not only reduced shear force at the interface but
also minimised the temperature increase in the bulk material. In addition, the wear resistance was
significantly improved. The wear coefficient of Bush C was found to be 0.13 × 10⁻⁶ mm3 /Nm compared
with 4.33 × 10⁻⁶ mm3 /Nm for Bush A.
Bushes made of PEEK composite formulated with PTFE, graphite and carbon fibre exhibit low
friction, self-lubricating, low temperature rise, and therefore present superior bearing properties,
including enhanced bearing life and reducing energy consumption in machinery. The findings facilitate
the application of this PEEK composite used as self-lubricating bearing bushes.
Author Contributions: Conceptualization, methodology, formal analysis and draft preparation, J.Z.;
experimentation, data curation and formal analysis, F.X.; supervision and writing—review and editing, R.S.D.-J.
All authors contributed to writing and correcting the manuscript. All authors have read and agreed to the
published version of the manuscript.
Funding: This research was supported by the Aerospace Technology Institute (UK) funded project Large Landing
Gear of the Future (LLGF) led by Safran Landing Systems UK Ltd. [grant number 113077] and the Engineering and
Physical Sciences Research Council through R S Dwyer-Joyce’s fellowship on Tribo-Acoustic Sensors [grant number
EP/N016483/1].
Acknowledgments: The authors gratefully acknowledge Le Ma (Sorby Centre, Kroto Research Institute,
North Campus, University of Sheffield, UK; l.ma@sheffield.ac.uk) for her professional support in SEM sample
preparing and imaging.
Conflicts of Interest: The authors declare no conflict of interest.
References
1. Chen, B.; Wang, J.; Yan, F. Comparative investigation on the tribological behaviors of CF/PEEK composites
under sea water lubrication. Tribol. Int. 2012, 52, 170–177. [CrossRef]
2. Aldousiri, B.; Shalwan, A.; Chin, C.W. A review on tribological behaviour of polymeric composites and
future reinforcements. Adv. Mater. Sci. Eng. 2013, 2013, 1–8. [CrossRef]
3. Qi, Y.; Gong, J.; Cao, W.; Wang, H.; Ren, J.; Gao, G. Tribological behavior of PTFE composites filled with peek
and nano-Al2 O3 . Tribol. Trans. 2018, 61, 694–704. [CrossRef]
4. Hufenbach, W.A.; Stelmakh, A.; Kunze, K.; Böhm, R.; Kupfer, R. Tribo-Mechanical properties of glass fibre
reinforced polypropylene composites. Tribol. Int. 2012, 49, 8–16. [CrossRef]
5. Zhang, L.; Li, G.; Guo, Y.; Qi, H.; Che, Q.; Zhang, G. PEEK reinforced with low-loading 2D graphitic carbon
nitride nanosheets: High wear resistance under harsh lubrication conditions. Compos. Part A Appl. Sci.
Manuf. 2018, 109, 507–516. [CrossRef]
6. Tang, Q.; Chen, J.; Liu, L. Tribological behaviours of carbon fibre reinforced PEEK sliding on silicon nitride
lubricated with water. Wear 2010, 269, 541–546. [CrossRef]
7. Friedrich, K. Polymer composites for tribological applications. Adv. Ind. Eng. Polym. Res. 2018, 1, 3–39.
[CrossRef]
8. Lewis, S.D.; Rowntree, R.A. Hybrid polymeric bearings for space applications. In Proceedings of the 7th
European Space Mechanisms and Tribology Symposium, ESTEC, Noordwijk, The Netherlands, 1–3 October
1997; Kaldeich-Schürmann, B.H., Ed.; ESA SP-140.
9. Laux, K.A.; Jean-Fulcrand, A.; Sue, H.J.; Bremner, T.; Wong, J.S.S. The influence of surface properties on sliding
contact temperature and friction for polyetheretherketone (PEEK). Polymer 2016, 103, 397–404. [CrossRef]
10. Laux, K.A.; Schwartz, C.J. Influence of linear reciprocating and multi-Directional sliding on PEEK wear
performance and transfer film formation. Wear 2013, 301, 727–734. [CrossRef]
11. Omrani, E.; Menezes, P.L.; Rohatgi, P.K. State of the art on tribological behavior of polymer matrix composites
reinforced with natural fibers in the green materials world. Eng. Sci. Technol. Int. J. 2016, 19, 717–736.
[CrossRef]You can also read