SEEDING METHOD FOR ICE NUCLEATION UNDER SHEAR
←
→
Page content transcription
If your browser does not render page correctly, please read the page content below
S EEDING M ETHOD FOR I CE N UCLEATION UNDER S HEAR

                                                                                                           A P REPRINT

                                                                              Amrita Goswami                                      Indranil Saha Dalal∗
arXiv:2006.14919v2 [physics.comp-ph] 6 Aug 2020

                                                                   Department of Chemical Engineering                     Department of Chemical Engineering
                                                                  Indian Institute of Technology Kanpur                  Indian Institute of Technology Kanpur
                                                                         amritag@iitk.ac.in                                     indrasd@iitk.ac.in

                                                                                                          Jayant K. Singh∗
                                                                                              Department of Chemical Engineering
                                                                                             Indian Institute of Technology Kanpur
                                                                                                    jayantks@iitk.ac.in

                                                                                                          August 7, 2020

                                                                                                          A BSTRACT
                                                              Hydrodynamic flow can have complex and far-reaching consequences on the rate of homogenous
                                                              nucleation. We present a general formalism for calculating the nucleation rates of simply sheared
                                                              systems. We have derived an extension to the conventional Classical Nucleation Theory, explicitly
                                                              embodying the shear rate. Seeded Molecular Dynamics simulations form the backbone of our
                                                              approach. The framework can be used for moderate supercoolings, at which temperatures brute-force
                                                              methods are practically infeasible. The competing energetic and kinetic effects of shear arise naturally
                                                              from the equations. We show how the theory can be used to identify shear regimes of ice nucleation
                                                              behaviour for the mW water model, unifying disparate trends reported in the literature. At each
                                                              temperature, we define a crossover shear rate in the limit of 1000 − 10, 000 s−1 , beyond which the
                                                              nucleation rate increases steadily upto a maximum, at the optimal shear rate. For 235, 240, 255 and
                                                              260 K, the optimal shear rates are in the range of ≈ 106 − 107 s−1 . For very high shear rates beyond
                                                              108 s−1 , nucleation is strongly inhibited. Our results indicate that the shear-dependent nucleation
                                                              rate curves have a non-monotonic dependence on temperature.

                                                  Keywords rare-event, nucleation, shear, seeding, Classical Nucleation Theory, biasing method

                                                  1       Introduction
                                                  Crystal formation under the action of shear flow is a ubiquitous phenomenon, with important implications in nature and
                                                  various medical, metallurgical and industrial applications [1–6]. Hydrodynamic flows can induce complex changes
                                                  in the behaviour of nucleating systems, ranging from shear-mediated ordering of the liquid [7–10] to disruption of
                                                  crystallization [11, 12].
                                                  The literature is rife with contradictory accounts of the effects of shear on the nucleation rate. Certain experiments
                                                  surmise that shear flow can retard nucleation [13, 14], while others report that shear flows have a negligible influence on
                                                  crystallization [15–17]. Different studies have shown that shear flow can enhance the rate of nucleation [18–22]. On the
                                                  other hand, simulation studies suggest that the nucleation rates have a non-monotonic dependence on the applied shear
                                                  rates, and exhibit a maximum at an optimal shear rate [23–26].
                                                  Even without the added variable of shear, the use of computer simulations for describing homogenous crystal nucleation
                                                  is complicated by the fact that it is a rare event, occurring on time scales inaccessible to conventional Molecular
                                                  Dynamics (MD). Techniques of analyzing crystal nucleation, dependent on brute-force simulations, are typically only
                                                      ∗
                                                          Corresponding Author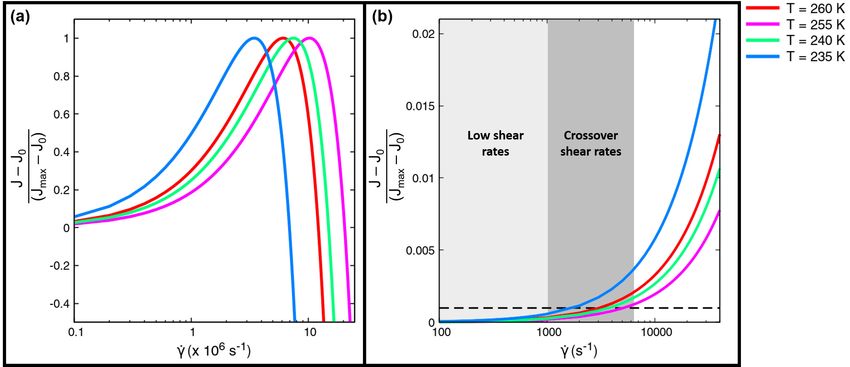
AUGUST 7, 2020

feasible for deeply supercooled systems. This is partly due to the stochastic nature of nucleation events. In practice,
obtaining sufficiently good statistics from brute-force MD-based methods can be intractable for moderate supercooling
[27].
The event at the crux of crystal nucleation, which is an activated process, is the formation of a sufficiently large
crystalline cluster in the metastable liquid phase to overcome the free-energy barrier. Seeded MD simulations can
be used to reliably estimate the critical nucleus size and the interfacial energy [28–30]. In the quintessential seeding
method, the information gleaned from seeded simulations is used in conjunction with Classical Nucleation Theory
(CNT) [31, 32] to calculate the free-energy barrier and nucleation rate. Thus, the seeding technique can be particularly
advantageous for moderate supercoolings, at which temperatures the spatiotemporal resolution of brute-force MD can
be insufficient to observe nucleation events.
In this work, we extend CNT to incorporate shear, and propose a general, computationally efficient framework that
builds on the seeding method. We study the effect of a wide range of shear rates on the ice nucleation rates at different
temperatures, for which brute-force MD and equilibrium rare-event sampling methods are essentially infeasible. We
show that the formalism can pinpoint distinct regimes of ice nucleation behaviour, and is thus able to consolidate
and justify the seemingly inconsistent results reported in the literature. The results suggest a previously unexplored
non-linear temperature dependence of the nucleation rates.

2     Theory and Methods

2.1   Overview of the Seeding Method

According to Classical Nucleation Theory (CNT) [27, 31–33], the free energy of formation F of a spherical crystallite
nucleus of radius R can be expressed as the sum of a favourable volume term and an unfavourable surface term:

                                                     4   |∆µ|
                                            F (R) = − πR3 0 + 4πR2 σ,                                                  (1)
                                                     3    v

where |∆µ| is the chemical potential difference between the metastable liquid phase and the crystal, v 0 is the volume of
one particle or molecule in the crystal, and σ is the crystal-fluid interfacial free energy.
In the seeding method [34, 35], a solid cluster of the crystal phase is inserted into the supercooled fluid, and the
temperature at which the cluster has a critical number of molecules (N ∗ ) is determined. For smaller clusters, the free
energy cost of forming the solid-liquid interface dominates and the embryos tend to shrink. For clusters larger than the
critical nucleus size, the volume contribution is greater, favouring crystal growth.
The critical cluster size N ∗ is the cluster size which maximizes the free energy in Eq.(1), given by

                                                              32πv 02 σ 3
                                                    N∗ =                  ,                                            (2)
                                                               3|∆µ|3

where N ∗ is the number of particles or molecules in the critical cluster. The critical cluster corresponds to a particular
temperature, at which roughly half of the trajectories show crystal growth. This implies that, for a known inserted
cluster size, the temperature at which the cluster is critical can be estimated.
Thus, the seeding technique directly yields N ∗ at the estimated temperature T . Once T has been fixed, |∆µ| and v 0
become fixed as well. The interfacial energy σ, can now be determined from Eq. (2) as:

                                                                      31
                                                            3N ∗

                                                 σ=                         |∆µ|.                                      (3)
                                                           32πv 02

Putting Eq. (2) in Eq. (1), we obtain the free energy barrier for nucleation:

                                                                16πv 02 σ 3
                                                  F (N ∗ ) =                ,                                          (4)
                                                                 3|∆µ|2

where F (N ∗ ) is the height of the free energy barrier.

                                                               2
AUGUST 7, 2020

The rate of nucleation can be estimated as [36–39]

                                                                                        F (N ∗ )
                                                                                    −
                                                                J = ρl Zf + e            kB T
                                                                                                   ,                                                 (5)

where (ρl Zf + ) is the kinetic pre-factor, in which ρl is the number density of the supercooled liquid, Z is the Zeldovich
factor [37], and f + is the rate of attachment of molecules to the cluster in units of inverse time. kB is the Boltzmann
constant, and T is the temperature at which the inserted seed of size N ∗ is critical.
The Zeldovich factor Z captures the multiple possible re-crossings of the free energy barrier [40] and is related to
the curvature of the free energy curve at the critical cluster size N ∗ . According to CNT, which assumes a perfectly
spherical cluster, the Zeldovich factor can be approximated by:
                                                              s                      s
                                                                  |F 00 (N ∗ )|             |∆µ|
                                                       Z=                       =                    ,                                               (6)
                                                                   2πkB T                 6πkB T N ∗

                      ∂ 2 F (N )
where F 00 (N ∗ ) =     ∂N 2                .
                                   N =N ∗
Thus, Z can be directly calculated using Eq.(6) from the quantities obtained from seeding computations and the
chemical potential difference between the liquid and solid phases |∆µ|.
The main advantage of the seeding technique is that it allows for a direct estimate of the interfacial free energy for a
wide range of supercooling conditions. Using the framework of CNT, the free energy barrier and the nucleation rate
can be calculated from quantities obtained from seeded simulations, the chemical potential difference and the crystal
density.
In the subsequent sections, we extend the CNT equations for bulk homogenous systems to account for volume-preserving
shear, building on the seeding method.

2.2   Extension of the Seeding Technique and CNT for Sheared Systems

According to Mura and Zaccone [25], the free energy of a crystal nucleus in a bulk nucleating system, subjected to a
volume-preserving shear (“simple” shear) γ̇, is given by

                                                                    7 η 2 γ̇ 2     1 η 2 γ̇ 2 4 3

                                     4    |∆µ0 |
                            F (R) = − πR3     0
                                                 + 4πR 2
                                                         σ 0   1 +         2
                                                                                 +             πR ,                                                  (7)
                                     3      v                      24 G            2 G 3

where F (R) is the free energy of formation of a cluster of radius R, |∆µ0 | is the chemical potential difference between
the thermodynamically stable crystal phase and the metastable liquid phase when no shear is applied, σ0 is the surface
tension or the interfacial free energy of the nucleus at zero shear, v 0 is the volume of one molecule in the crystal phase,
η is the fluid viscosity, and G is the shear modulus of the nucleus.
                    2 2
                 7 η γ̇
Here, the term   24 G2     in Eq.(7) is a “shape factor” correction; which accounts for the deformation of the nucleus into
an ellipsoid.
As noted in the previous section, the eponymous seeding technique provides a direct estimate for the interfacial free
energy σ0 , at the temperature T for which the inserted seed is critical. Thus, it is desirable to convert the free energy in
Eq.(7) to a function of the cluster size N . Changing the variable R to N enables us to rewrite the free energy as

                                                                                                             32
                                                    2G|∆µ0 | − η 2 γ̇ 2 v 0                        3v 0 N

                                                                                    πσ0
                        F (N ) = −N                                               +                                (24G2 + 7η 2 γ̇ 2 ).              (8)
                                                          2G                        6G2             4π

The equation above has a stationary point corresponding to the critical nucleus size N ∗ . Solving for the stationary point
of Eq.(8), we obtain:

                                                                                                            3
                                                             πσ03 v 02         24G2 + 7η 2 γ̇ 2

                                                     N∗ =                                                          .                                 (9)
                                                             162G3           2G|∆µ0 | − η 2 γ̇ 2 v 0

                                                                                3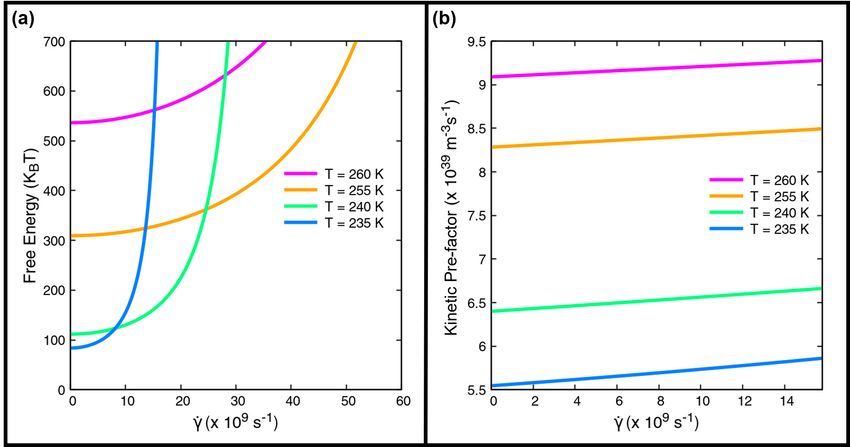
AUGUST 7, 2020

The critical nucleus size corresponds to the stationary point of the free energy surface, defined by Eq.(8). Thus the
height of the free energy barrier for nucleation, corresponding to the critical nucleus size N ∗ , is given by

                                                     πσ03 v 02 (24G2 + 7η 2 γ̇ 2 )3
                                        F (N ∗ ) =                                     .                                     (10)
                                                     648G4 (2G|∆µ0 | − η 2 γ̇ 2 v 0 )2

We note that the free energy barrier increases with an increase in the shear rate as governed by Eq.(10). By construction,
Eq.(9) also predicts a concomitant increase in N ∗ .

2.3   Calculation of the Nucleation Rate

The dynamics of a nucleation process can be formulated as a Kramers-Moyal expansion [41, 42], which can be recast
as a quintessential Focker-Planck equation [43]

                                 ∂P (N, t)    ∂                −
                                                                    F (N )    ∂           F (N )
                                           =               De       kB T
                                                                                  P (N, t) e kB T            ,               (11)
                                    ∂t       ∂N                              ∂N

where P (N, t) is the probability distribution of the clusters containing N molecules at time t, and D is a diffusion
coefficient, or in this case, the rate of attachment of molecules to a nucleus in units of inverse time. F (N ) (Eq. (8)) is
the free energy barrier for this nucleation process.
We recognize that Eq.(11) can be reformulated as the Zeldovich-Frenkel equation [36, 37]

                                                      −
                                                          F (N )    ∂            F (N )
                                          J = −De         kB T
                                                                        P (N, t)e kB T ,                                     (12)
                                                                   ∂N
where J is the current or flux across the free energy barrier, in the cluster-size space.
The solution to the system of equations above yields the familiar CNT form of the steady-state nucleation rate [36–39]

                                                                                 F (N ∗ )
                                                                             −
                                                     J = ρl Zf + e                kB T
                                                                                            ,                                (13)

where the nucleation rate J is in units of the number of nucleation events per unit volume per unit time, f + is the
attachment rate of molecules to the critical cluster, ρl is the number density of the supercooled liquid, and Z is the
Zeldovich factor.
The Zeldovich factor is a measure of the curvature at the top of the free energy barrier. Z accounts for the fact that
postcritical clusters might still shrink without growing due to re-crossing the barrier [40]. According to our formalism,
as expressed in the cluster-size-space, Z can be calculated using:
                                    s                                         31 s
                                        |F 00 (N ∗ )|           v0                      σ0 (24G2 + 7η 2 γ̇ 2 )

                              Z=                      =                                                        .             (14)
                                         2πkB T               36πN ∗2                        6G2 kB T

Thus we have derived expressions for the height of the free energy barrier F (N ∗ ), and the steady-state nucleation rate
J in terms of the shear rate, and equilibrium properties |∆µ0 | and σ0 determined in the absence of shear. Later sections
show that these calculations can be performed in a computationally efficient framework. The other quantities required
for the calculation of J are f + , v 0 , η and G. These input parameters can either be obtained directly from the seeding
technique or estimated otherwise.

2.4   Calculation of the Attachment Rate

According to CNT, the attachment rate f + can be related to the time required for a single particle or molecule to attach
to the crystal cluster [36, 37]. We can estimate f + by

                                                                    6Dl
                                                          f+ =          ON ∗ ,                                               (15)
                                                                     λ2

                                                                     4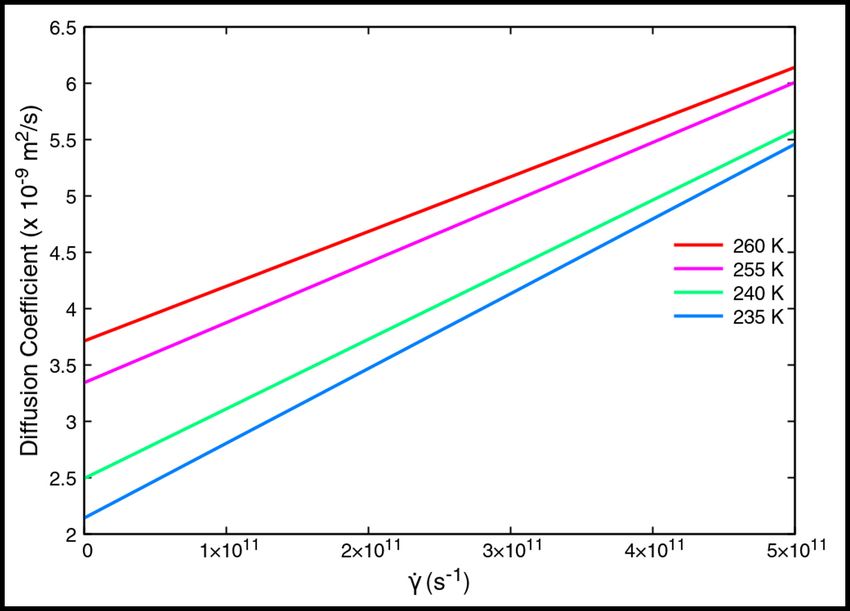
AUGUST 7, 2020

where Dl is the diffusion coefficent of the supercooled liquid phase, λ is the atomic ‘jump length’, estimated to be
about one molecule diameter, and ON ∗ is the number of binding sites on the surface of the critical cluster of size N ∗ .
ON ∗ can be assumed to be equal to the surface area of the cluster, divided by an area per molecule or particle [36]. The
                                                                 0  23
per-particle area in contact with the cluster is assumed to be π 3v
                                                                  4π     [36]. Hence, we obtain:

                                                                     7η 2 γ̇ 2

                                                                        2
                                                                   ∗
                                                  O N∗   = 4(N )  1+    3        .                                       (16)
                                                                     24G2

Substituting the value of ON ∗ from Eq.(16) and putting it in Eq.(15), the final expression for f + is

                                                                                   7η 2 γ̇ 2

                                                         24Dl ∗ 2
                                                f+ =         (N ) 3             1+             .                         (17)
                                                          λ2                       24G2

                          7η 2 γ̇ 2
We recall that the term   24G2        is a “shape factor” accounting for the deformation of the cluster due to the application
                                                               2    2
of shear. For approximately spherical crystallites, 7η γ̇
                                                    24G2 is negligible. However, the application of shear still has the
                             +                       ∗
overall effect of enhancing f since both Dl and N increase with increasing shear rates.

2.4.1    Calculation of the Diffusion Coefficient
We expect the diffusion coefficient Dl to be dependent on the shear rate [25, 26, 44, 45], in addition to being dependent
on the temperature [46]. In our simulations, the applied shear rate is in the x dimension. Hence, we can calculate the
two-dimensional diffusion coefficient (Dl ) of the supercooled liquid under the application of shear, in the yz plane
using the mean square displacement [47]

                                                       1
                                          Dl = lim        h[y(t) − y(0)]2 + [z(t) − z(0)]2 i,                            (18)
                                                t→∞    4t
where Dl is the two-dimensional self-diffusion coefficient, t is the elapsed time with respect to a reference time origin,
h[y(t) − y(0)]2 + [z(t) − z(0)]2 i is the ensemble average over all molecules and time origins, of the mean-squared
displacement of the molecules in the y and z dimensions.

2.5     Limiting Values of Shear Rates

The denominator of the free energy in Eq.(10) is undefined for larger shear rates as it tends to shrink to zero. The
correspondingly infinite free energy barrier has well-defined physical consequences. This situation implies that the
clusters are not mechanically stable at very large shear rates, and this effectively suppresses nucleation. We define
the limiting maximum shear rate γ̇max as the shear rate for which the free energy barrier is infinite and for which the
nucleation rate effectively vanishes, given by

                                                                                      12
                                                                1          2G|∆µ0 |
                                                      γ̇max   =                              ,                           (19)
                                                                η             v0

where G is the shear modulus in units of pressure, |∆µ0 | is the difference in chemical potential between the liquid
and solid phases in the absence of shear, η is the viscosity of the supercooled liquid, and v 0 is the volume of a single
molecule in the crystal phase. v 0 is, hence, the reciprocal of the number density of the solid phase.
We note the dependence of γ̇max on the mechanical properties of the crystal nucleus (G and η), as well as on the
chemical potential difference and the density of the crystal seed.
Interestingly, γ̇max in Eq.(19) is not dependent on the value of N ∗ , which implies that for values of shear rates greater
than γ̇max even infinitesmally small nuclei are mechanically unstable and prone to fragmentation.
Rigorous calculations at every temperature yield the values of |∆µ0 | and η at each temperature [28, 29, 48]. However,
in order to determine the dependence of γ̇max on the temperature T , it is desirable to approximate both |∆µ0 | and η by
analytical functions of T . Using the enthalpy change of melting [37] and a power law expression for viscosity [48], we
can rewrite Eq.(19) in terms of T by using such analytical approximations for |∆µ0 | and η, respectively.

                                                                           5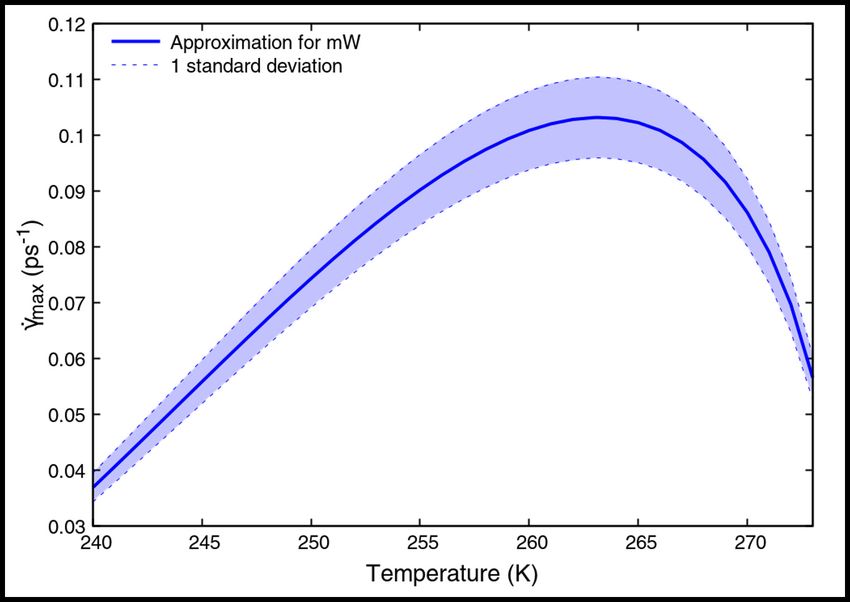
AUGUST 7, 2020

The power law expression for η for supercooled water is given by Dehaoui et al. [48]

                                                                      −β
                                                               T
                                                 η = A0           −1         ,                                       (20)
                                                               TS

where A0 and TS are fitting parameters with units of dynamic viscosity and temperature, respectively. β is a dimension-
less fitting parameter.
The difference in the chemical potential, ∆µ0 , can be approximated using the enthalpy change at melting [37], which is
accurate for low supercoolings and specifically for the monoatomic (mW) water model [49] at larger supercoolings can
be given by:

                                                               T
                                                ∆µ0 = ∆Hm 1 −      ,                                                 (21)
                                                              Tm

where ∆Hm is the enthalpy change at melting, and Tm is the melting point for the model.
Eliminating η and |∆µ0 | from Eq.(19), using Eq.(20) and Eq.(21), respectively, we recast γ̇max as a function of T :

                                                                                  12
                                                (T − TS )β

                                                                 2G            T
                                 γ̇max (T ) =                       ∆Hm   1 −          .                             (22)
                                                  A0 TSβ         v0           Tm

We can estimate the validity of the approximations made, by comparing the values of γ̇max calculated using explicitly
determined η and |∆µ0 | values from the literature [28, 29, 48], with those predicted by Eq.(22).

Figure 1: (a) Maximum limiting values of the shear rate plotted against temperature, calculated using explicitly
determined η and |∆µ0 | values for the mW (filled blue squares) and TIP4P/Ice (filled red squares) water models [28,
29, 48]. Calculations with approximated γ̇max estimated from Eq.(22) for mW and TIP4P/Ice are shown as open
diamond symbols in turquioise and magenta, respectively. (b) Comparison of the more exact estimations of γ̇max with
analytical expressions (Eq.(22)) using a constant ice density for each water model. The two dotted lines sandwiching
the functional approximations for the mW (solid turquoise line) and TIP4P/Ice (solid magenta line) models show the
uncertainty (1 standard deviation).

Figure 1(a) shows the trend of γ̇max with temperature for the mW and TIP4P/Ice [50] water models. Evidently, the the
approximate relation in Eq.(22) agrees well with the more exact calculations of γ̇max for the mW model, as expected.
Figure 1(a) shows that, within the statistical uncertainty, the values of γ̇max for the mW model nearly coincide. However,
there is more divergence of the approximate values for the TIP4P/Ice model.

                                                               6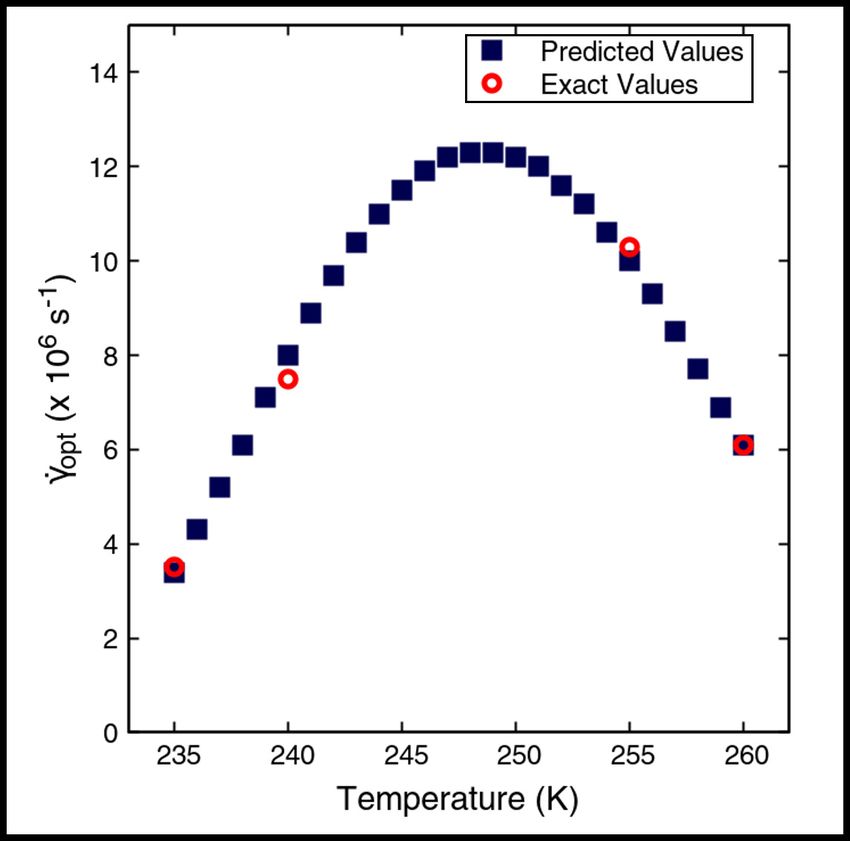
AUGUST 7, 2020

It has been observed that the density of hexagonal ice (Ih) increases with decreasing temperature at constant pressure
[51, 52], which is a trend also reflected in experiments [53]. However, we can further approximate the value of v 0 in
Eq.(22) by assuming that the Ih density is constant in the temperature range 235 − 260 K. Figure 1(b) depicts the
change in the γ̇max with temperature, using this additional approximation. The agreement of the mW model with the
predicted approximate values is still excellent. In the case of the TIP4P/Ice model, the predicted values still differ from
the more exact calculations, but not significantly more than in Figure 1(a).
We surmise that Eq.(22) can be safely used for the coarse-grained mW water model, but can show small divergences
from more rigorous calculations, for the TIP4P/Ice model. The approximation can be used to predict general trends and
behaviour with tolerable agreement for TIP4P/Ice.

2.6   Methodology Sequence

From Eq.(13), the quantities required for the estimation of the nucleation rate J are the chemical potential difference
between the stable and metastable phases (|∆µ0 |), the rate of attachment of molecules to the critical cluster (f + ), the
volume of a single molecule in the crystal phase at the thermodynamic conditions (v 0 ), the viscosity of the supercooled
liquid (η) and the shear modulus of the crystal nucleus (G). We outline the estimation of the input parameters required
for the calculation of J, at different shear rates:

      1. We employ the seeding method to estimate the temperature for known critical cluster sizes. Once a trial tem-
         perature has been fixed for a pre-determined critical cluster size, the interfacial energy σ0 can be calculated. In
         the seeding technique, spherical clusters of pure Ih of a certain size are inserted into equilibrated configurations
         of supercooled liquid [28–30]. For a given inserted cluster seed size, the temperature T for which the seed is
         critical can be determined by running several trajectories and tracking the cluster sizes. If the inserted cluster
         is of critical size at the test temperature then the seed grows in roughly half of the trajectories, while the cluster
         shrinks during the course of the other runs. The accuracy of this estimation of T can be improved by increasing
         the number of runs at each trial temperature. Systematic errors are larger for smaller cluster sizes owing to the
         uncertainty in the determination of the interfacial region.
      2. |∆µ0 | can be determined directly by using the Einstein molecule method [54] to compute the chemical
         potential of the fluid and crystal phases [55], or by thermodynamic integration [28]. Alternatively, Eq.(21) can
         be used as an approximation for |∆µ0 |. As noted previously, Eq.(21) is accurate only for low supercoolings
         and differs from rigorously calculated |∆µ0 | for atomistic water potentials [28]. However, it has been reported
         that Eq.(21) performs well for larger supercoolings as well [28], in the case of the mW water model, since the
         maximum of heat capacity is displaced to lower temperatures for this model [49].
      3. f + is the rate of attachment of molecules to the critical cluster, which can be calculated using Eq.(17). A
         typical attachment or ‘jump’ length λ can be assumed to be one molecular diameter [37]. For the mW model,
         we can take λ = 3.5 Å [28]. The diffusion coefficient Dl , which may be dependent on shear, is also required
         for the calculation of f + .
      4. v 0 is the inverse of the number density of the crystal phase. It is known that Ih density varies with the
         temperature, though the extent of this density change varies for different water models [28]. The Ih density at
         every temperature can be determined from isothermal-isobaric simulations of the crystal phase.
      5. η is dependent on temperature, and can either be calculated directly from Molecular Dynamics simulations [56]
         or estimated by a power law relation [48]. We note that such analytical relations for the viscosity are typically
         not valid for deeply supercooled water below 230 K. We can assume that η is independent of the applied shear
         rate for ‘low’ shear rates; however, at higher shear rates η decreases under shear strain. Shear-thinning has
         been observed for the SPC/E water model for shear rates greater than 0.1 ps−1 [57]. In this work, the highest
         limiting shear rate calculated using Eq.(22) is ≈ 0.1 ps−1 , and hence we can assume that η is constant with
         respect to the shear rate, at each T , within this limit.
      6. The shear modulus G can vary, in the range of ≈ 3 − 4.5 GP a, for different crystal plane directions and
         cluster structure, for both Ih and amorphous ices [58–60]. Figure S2 shows the temperature dependence of
         γ̇max , estimated using Eq.(22) for the mW water model, for different values of G. In this work, we have used
         a constant shear modulus, without taking into account the anisotropy of G.

                                                              7
AUGUST 7, 2020
3 Simulation Details
We have applied our formalism to the monatomic (mW) water model [49], at four temperatures 235, 240, 255 and
260 K.
3.1 Seeding Method Calculations
The seeding method was employed to obtain input parameters, described in further detail in the Supporting Information.
The technique involves the generation of molecular dynamics trajectories in the absence of shear. Molecular dynamics
simulations of the mW water model were performed using LAMMPS [61] in the isothermal-isobaric (N P T ) ensemble
at 1 atm. The Nose-Hoover thermostat and barostat were used to control the temperature and pressure, respectively. A
time step of 10 f s was used.
Initial systems were created by inserting a perfectly spherical cluster of hexagonal ice (Ih) in supercooled liquid
configurations obtained from independent simulations at 208 K. The liquid molecules which overlapped with the
inserted cluster molecules were removed, and a tolerance of 2 Å was kept between the cluster and surrounding
supercooled liquid. The systems were then equilibrated in two steps. First, the solid cluster molecules were kept rigid,
allowing the liquid molecules to move at a temperature of 200 K for 8 ps. Next, the constraint on the cluster molecules
was removed and the systems were equilibrated for a further 0.2 ns at 200 K.
The temperature at which each cluster is critical was determined by running MD trajectories at different temperatures
and tracking the cluster size. The cluster size evolution for a seed size of 686 particles has been shown in Figure S1.
The ice-like molecules were differentiated from the liquid phase by using the structural identification method of Maras
et al. [62], in OVITO [63]. The evolution of the largest ice cluster in each trajectory was monitored using d-SEAMS
[64].
Table S1 lists the input parameters, used in our formalism, for the mW water model.
3.2 Simulations for Calculating the Diffusion Coefficient
Molecular dynamics trajectories were obtained at different shear rates using LAMMPS [61] at 235, 240, 255 and 260 K.
The two-dimensional diffusion coefficients at different shear rates were calculated using the VMD Diffusion Coefficient
Tool [65]. Shear was imposed in the x dimension using the SLLOD algorithm [66], with Lees-Edwards boundary
conditions [67, 68]. A timestep of 5 f s was used for the simulations with shear. The system size used for the diffusion
coefficient calculations was 4096 molecules of mW water at the four temperatures considered in this work.
4 Results and Discussion
4.1 Effect of Shear on Diffusion
We observe that diffusion is enhanced by the applied shear, as expected from previous results in the literature [25, 26,
44, 45]. By fitting the two-dimensional bulk diffusion coefficients at different shear rates, we obtain the following linear
relationship at a constant temperature T :
Dl = D0 + cγ̇, (23)
where Dl is the two-dimensional diffusion coefficient at a particular shear rate γ̇ and temperature T , D0 is the bulk
diffusion coefficient in the absence of shear at T , and c is a fitting constant corresponding to the rate of increase of the
diffusion coefficient with shear, which has units of squared length.
Figure S3 shows the linear fits of the diffusion coefficient with shear rates, for the four temperatures studied in this
work.
8AUGUST 7, 2020
Figure 2: Variation of the Diffusion coefficient with shear, for four different temperatures. It is observed that the
Diffusion coefficients increase linearly with shear.
Figure 2 depicts the fitted lines for each temperature. We observe that, in general, the diffusion coefficient increases with
increasing temperature, as expected. We also surmise that the rate of increase of the diffusion coefficient c decreases
with increasing temperature. Table 1 lists the values of D0 and m for each temperature.
Table 1: Parameter values in Dl = D0 + cγ̇
Temperature D0 (×10−9 m2 /s) c (×10−21 m2 )
260 K 3.715 4.85364
255 K 3.345 5.32611
240 K 2.496 6.17091
235 K 2.145 6.63036
4.2 Variation of the Nucleation Rate with Shear Rate
The application of shear has two opposing contributions to the nucleation rate: the free energy barrier increases with
the shear rate, tending to retard nucleation, while the kinetic pre-factor rises with shear. The increase in the kinetic
pre-factor tends to promote nucleation. We also note that the the critical nucleus size also increases with the shear rate
[23, 25], shown in Figure S4.
9AUGUST 7, 2020
Figure 3: (a) Variation of the free energy barrier F (N ∗ ) with the shear rate γ̇ for 260, 255, 240 and 235 K. (b) The
kinetic pre-factor ρl Zf + plotted against the shear rate γ̇ for different temperatures.
Figure 3(a) shows the quadratic increase of the free energy barrier with rising shear rates. The quadratic increase in the
free energy barrier of nucleation with shear has also been reported for colloidal suspensions [13]. Figure 3(b) depicts the
increase of the kinetic pre-factor with shear for different temperatures. The diffusion coefficients were calculated using
Eq. 23. We surmise that the non-monotonicity of the nucleation rate arises from the interplay of these two conflicting
tendencies.
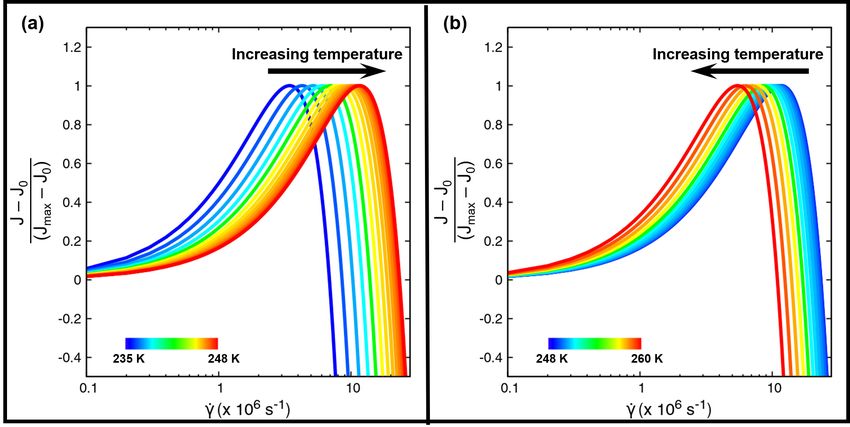
J−J0
Figure 4: (a) Variation of the normalized relative nucleation rates Jmax −J0 with shear, for shear rates greater than
5 −1
10 s , for different temperatures. The non-monotonic behaviour arises from the competing energetic and kinetic
effects of shear. (b) Normalized relative nucleation rates, plotted against the shear rate, depicting the regimes of
low shear rates and crossover shear rates. In the low shear rate regime, upto 1000 s−1 , highlighted in light grey, the
nucleation rates are unaffected by the applied shear. The nucleation rates begin to increase for shear rates greater than
the crossover shear rates, shaded in dark grey. The black dotted line denotes the normalized relative nucleation rate
value of 0.001, for which the crossover shear rates are defined.
10AUGUST 7, 2020
J−J0
Figure 4(a) depicts the non-monotonicity of the dimensionless relative nucleation rates Jmax −J0 with shear, for four
different temperatures. This dimensionless relative nucleation rate is defined with respect to J0 , the nucleation rate
calculated when there is no shear, and Jmax . Jmax is the highest nucleation rate, maximized with respect to the shear
rate, at a particular temperature. Figure S5 shows Jmax obtained for the four temperatures considered in this work.
Figure 4(b) shows plots of the normalized relative nucleation rate, in the limit of low shear rates.
Our results indicate the existence of three qualitative regimes of crystallization behaviour under shear. At low shear
rates, in the range of 0 − 1000 s−1 , there is negligible effect on the kinetics (highlighted in light grey in Figure 4(b)).
Such shear rates are typically imposed in Couette flows in experiments [69].
However, for shear rates between 1000 − 10, 000 s−1 , the nucleation rates begin to increase smoothly. We define a
crossover shear rate, indicative of this smooth transition, such that at the crossover shear rate the normalized relative
nucleation rate is 0.001. The region of crossover shear rates for different temperatures is highlighted in dark grey in
Figure 4(b).
The nucleation rate continues to rise steadily for higher shear rates for every temperature, upto shear rates of the order
of 106 s−1 . Between ≈ 106 − 107 s−1 , a maximum in the nucleation rate is observed, originating from the competing
kinetic and energetic effects of shear (Figure 4(a)). We define the shear rate at which the nucleation rate is maximum
as the optimal shear rate, at a particular temperature. Beyond the optimal shear rate, very high shear rates inhibit
nucleation, until the nucleation rate vanishes. In the regime of very high shear rates larger than the optimal shear rate,
the free energy cost of nucleation dominates the enhancement in diffusion due to the shear.
We also note that the optimal shear rates observed are much higher than shear rates typically used in experiments. The
range of shear rates generated in experiments can be about 0 − 100, 000 s−1 [70], orders of magnitude lower than the
optimal shear rates.
4.3 Dependence of the Optimal Shear Rates and Nucleation Rate Curves on Temperature
The behaviour of the nucleation rate curves in Figure 4 indicates a possible non-linear dependence on the temperature.
This is due to the inclusion of several temperature-dependent parameters in the expression for the nucleation rate
(Eq.(13)). An analytical expression for the optimal shear rate cannot be obtained because of the dependence of the
exponential term and kinetic pre-factor on the shear rate.
Figure 5: Temperature dependence of the predicted and exact values of the optimal shear rates γ̇opt . The predicted
optimal shear rates and the optimal shear rates calculated from seeded simulations are denoted by filled cobalt blue
squares and open red circles, respectively. The maximum value of the optimal shear rate is observed at 248 K.
11AUGUST 7, 2020
In order to validate the functional form of the trend from our four simulations, we employ statistical inference. We
qualitatively ascertain the non-linear temperature dependence of the nucleation rates and optimal shear rates, by
extrapolating data for different temperatures using the approximations outlined below. The validity of the predicted
results can be assessed by comparing them with the more rigrously obtained data described in the previous section.
1. The interfacial energy σ0 for all temperatures is assumed to be constant and taken to be the mean of the values
calculated from seeding in Table S1. We have used this assumption with the understanding that the maximum
variation in the calculated values of σ0 is within 1.5%, and that the statistical uncertainty in the interfacial
energy calculations is ≈ 7% [28].
2. The diffusion coefficients are assumed to vary with shear according to a linear relationship given by Eq.(23),
at every temperature. The values of the parameters D0 and c, obtained in Section 4.1, are estimated for each
temperature from linear regression. The linear fits of D0 and c with temperature are shown in Figure S6.
3. The chemical potential |∆µ0 | and the viscosity η at each temperature are approximated by Eq.(21) and Eq.(20),
respectively.
4. The density of Ih is assumed to be constant in the range of temperatures 235 K to 260 K.
Using the approximations detailed above, we obtained the optimal shear rates for incrementally increased temperatures
between 235 K and 260 K. Figure 5 shows the variation of the predicted optimal shear rates with temperature. The
more exact calculations for 235, 240, 255 and 260 K are plotted alongside the predicted values, showing agreement
within 10%. It is evident that the predicted optimal shear rates show a non-monotonic dependence on the temperature,
exhibiting a maximum at 248 K. The values of both the predicted and exact optimal shear rates at 260 K are less
than those at 255 K and 240 K. The agreement of the predicted nucleation rate curves and the nucleation rate curves
obtained in the previous section from seeding calculations is graphically shown in Figure S7.
Figure 6: (a) Predicted normalized relative nucleation rate curves, varying with the shear rate γ̇, for temperatures
between 235 K and 248 K. The optimal shear rate at each temperature increases from 235 K and reaches a maximum
value at 248 K. (b) Shear-dependent predicted nucleation rate curves for 248 K to 260 K. Arrows signify the direction
of increasing temperature.
Figure 6(a) depicts the predicted nucleation rate curves, plotted against the shear rate, for temperatures between 235 K
and 248 K. The nucleation rate curves are shifted in the +x direction with increasing temperature. The nucleation rate
curve at 248 K has the highest optimal shear rate and is the rightmost curve. Figure 6(b) shows the nucleation rate
curves from 248 K to 260 K. As the temperature increases from 248 K, the curves are shifted in the −x direction.
Thus, the predicted results reinforce the suggestion of the non-monotonic temperature dependence of both the nucleation
rates and the optimal shear rates.
12AUGUST 7, 2020
However, although the approximations and predicted data offer insight into the non-linear temperature dependence, there
are a few unavoidable caveats. Particularly the approximation in Eq.(21), used for the chemical potential at different
temperatures, is more-or-less valid over a wide range of temperatures for the mW water model only. Presumably, this
approximation would only be acceptable for atomistic water potentials in the limit of strong supercooling. Unentangling
the complex composite effects of temperature on the nucleation rate is non-trivial using more rigorous calculations, and
requires further investigation.
4.4 Dependence of the Maximum Shear Rate on Temperature
We recall that, at a particular temperature T , nucleation is suppressed for shear rates greater than the maximum limiting
shear rate γ̇max . We can use the expression given by Eq.(22) to obtain the maximum shear rate γ̇max as a function of
the temperature T .
Figure 7: Maximum limiting values of the shear rate plotted against temperature for the mW water model, estimated
using Eq.(22). The dotted blue lines denote the uncertainty in the calculation of γ̇max .
Figure 7 shows the variation of γ̇max with T for the mW water model. Eq. (22) is a smooth, continuous and
differentiable function in T , and exhibits a maximum for a critical value of temperature, as shown in Figure 7.
Maximizing Eq.(22) with respect to T , we obtain a critical Tc for which the γ̇max is maximum, given by
2β
Tc = (Tm + TS ), (24)
2β + 1
where β and TS are fitting parameters from Eq.(20), and Tm is the melting point.
Tc is the temperature at which crystal nuclei survive at the highest shear rate, for a particular water model.
Thus, the maximum shear rate, γ̇c,max , beyond which nucleation is suppressed at all temperatures is given by the
maxima of Eq.(22), and we obtain:
β β+ 12 r
1 2β Tm − TS 2G∆Hm
γ̇c,max = , (25)
A0 TS 2β + 1 v 0 Tm
where A0 is a fitting parameter in Eq.(20) with the units of dynamic viscosity, and ∆Hm is the enthalpy change of
melting.
13AUGUST 7, 2020
We note that there is no dependence of Tc on the shear modulus G. This is reaffirmed by the plots of γ̇max with T in
Figure S2, wherein Tc = 263.2 K for all three shear moduli.
5 Conclusions
In this work, we have derived an extension to the CNT equations, explicitly accounting for shear. We have presented a
biasing technique for studying the effect of shear on nucleation rates, combined with the seeding method, for studying
nucleation at moderate supercooling. At such temperatures, brute-force MD simulations can be infeasible, especially
since the shear rate increases the barrier height.
Our results reveal the existence of different shear regimes of nucleation behaviour for the mW water model: 1) low
shear rates in the range of 0 − 1000 s−1 , for which the nucleation rate is unaffected; 2) high shear rates in the range of
106 − 107 s−1 , in which range a maxima in the nucleation rate is observed; 3) very high shear rates for which nucleation
is retarded. We identify crossover shear rates indicating the increase of the nucleation rate with shear in the range of
1000 − 10, 000 s−1 . We also define optimal shear rates as those corresponding to the maximum in the nucleation rate
at a particular temperature. Our formalism is thus capable of predicting trends over a wide range of shear rates, in
a relatively computationally inexpensive manner. Experiments support that there is little effect on nucleation in the
regime of low shear rates [15–17]. The non-monotonicity and decrease in nucleation rates due to shear agree with
previous simulation studies in the literature [13, 23–26]. The non-monotonicity arises from the competing kinetic and
energetic effects of shear on the nucleation rate.
The behaviour of the shear-dependent nucleation rates at each temperature hints at a possible non-linear dependence
on temperature. Using various approximations, we predict that the optimal shear rates and nucleation rates have a
non-monotonic dependence on temperature. We show that the predicted data agree with the results obtained from
seeded simulations reasonably well enough to make definite assessments. In the future, further investigations could
reveal the role of temperature in the complex interplay of factors influencing the nucleation rate.
We have calculated the analytical maximum limiting shear rate, beyond which the nucleation rate vanishes. At the
maximum limiting shear rate, nucleation is completely suppressed due to the mechanical failure of incipient crystallites.
We observe that the maximum limiting shear rate also has a non-monotonic dependence on temperature, similar to the
optimal shear rates.
Although we have studied the mW water model in detail in this work, the formalism presented is general and applicable
to other systems as well. By using analytical approximations within the framework of CNT, we are able to qualitatively
describe the nucleation behaviour of simply sheared systems without resorting to computationally expensive simulations.
Our results indicate a tantalizing, hitherto unexplored, non-monotonic temperature dependence of the shear-dependent
nucleation rate curves of water. We envisage that this formalism can be used to provide insight into the qualitative
nucleation behaviour of flowing systems inaccessible to brute-force MD and equilibrium rare-event acceleration
techniques.
6 Acknowledgements
This work was supported by the Science and Engineering Research Board (sanction number STR/2019/000090 and
CRG/2019/001325). Computational resources were provided by the HPC cluster of the Computer Center (CC), Indian
Institute of Technology Kanpur.
References
1. Penkova, A., Pan, W., Hodjaoglu, F. & Vekilov, P. G. Nucleation of Protein Crystals under the Influence of
Solution Shear Flow. Annals of the New York Academy of Sciences 1077, 214–231 (Sept. 2006).
2. Woodhouse, F. G. & Goldstein, R. E. Cytoplasmic streaming in plant cells emerges naturally by microfilament
self-organization. Proceedings of the National Academy of Sciences 110, 14132–14137 (Aug. 2013).
3. Berland, C. R. et al. Solid-liquid phase boundaries of lens protein solutions. Proceedings of the National Academy
of Sciences 89, 1214–1218 (Feb. 1992).
4. Baird, J. A., Santiago-Quinonez, D., Rinaldi, C. & Taylor, L. S. Role of Viscosity in Influencing the Glass-Forming
Ability of Organic Molecules from the Undercooled Melt State. Pharmaceutical Research 29, 271–284 (July
2011).
5. Forsyth, C. et al. Influence of Controlled Fluid Shear on Nucleation Rates in Glycine Aqueous Solutions. Crystal
Growth & Design 15, 94–102 (Nov. 2014).
14AUGUST 7, 2020
6. Ken Kelton, A. L. G. Nucleation in Condensed Matter: Applications in Materials and Biology (ed Greer, A. L.)
(Elsevier, 2010).
7. Ackerson, B. J. & Pusey, P. N. Shear-Induced Order in Suspensions of Hard Spheres. Physical Review Letters 61,
1033–1036 (Aug. 1988).
8. Yan, Y., Dhont, J., Smits, C. & Lekkerkerker, H. Oscillatory-shear-induced order in nonaqueous dispersions of
charged colloidal spheres. Physica A: Statistical Mechanics and its Applications 202, 68–80 (Jan. 1994).
9. Haw, M. D., Poon, W. C. K. & Pusey, P. N. Direct observation of oscillatory-shear-induced order in colloidal
suspensions. Physical Review E 57, 6859–6864 (June 1998).
10. Amos, R., Rarity, J., Tapster, P., Shepherd, T. & Kitson, S. Fabrication of large-area face-centered-cubic hard-
sphere colloidal crystals by shear alignment. Physical Review E 61, 2929–2935 (Mar. 2000).
11. Palberg, T., Mönch, W., Schwarz, J. & Leiderer, P. Grain size control in polycrystalline colloidal solids. The
Journal of Chemical Physics 102, 5082–5087 (Mar. 1995).
12. Okubo, T. & Ishiki, H. Kinetic Analyses of Colloidal Crystallization in a Sinusoidal Electric Field as Studied by
Reflection Spectroscopy. Journal of Colloid and Interface Science 211, 151–159 (Mar. 1999).
13. Blaak, R., Auer, S., Frenkel, D. & Löwen, H. Crystal Nucleation of Colloidal Suspensions under Shear. Physical
Review Letters 93 (Aug. 2004).
14. Blaak, R., Auer, S., Frenkel, D. & Löwen, H. Homogeneous nucleation of colloidal melts under the influence of
shearing fields. Journal of Physics: Condensed Matter 16, S3873–S3884 (Sept. 2004).
15. Hansen, P. H. F., Arnebrant, T. & Bergström, L. Shear induced aggregation of a pectin stabilised emulsion in two
dimensions. Colloid & Polymer Science 279, 153–160 (Feb. 2001).
16. Akio, S., Seiji, O., Akira, T., Hiroshi, U. & Ken’ichi, T. Fundamental research on external factors affecting the
freezing of supercooled water. International Journal of Heat and Mass Transfer 35, 2527–2536 (Oct. 1992).
17. Liu, X., Zhuang, K., Lin, S., Zhang, Z. & Li, X. Determination of Supercooling Degree, Nucleation and Growth
Rates, and Particle Size for Ice Slurry Crystallization in Vacuum. Crystals 7, 128 (May 2017).
18. Cerdà, J. J., Sintes, T., Holm, C., Sorensen, C. M. & Chakrabarti, A. Shear effects on crystal nucleation in colloidal
suspensions. Physical Review E 78 (Sept. 2008).
19. Mokshin, A. V. & Barrat, J.-L. Shear induced structural ordering of a model metallic glass. The Journal of
Chemical Physics 130, 034502 (Jan. 2009).
20. Graham, R. S. & Olmsted, P. D. Coarse-Grained Simulations of Flow-Induced Nucleation in Semicrystalline
Polymers. Physical Review Letters 103 (Sept. 2009).
21. Shao, Z. et al. Shear-accelerated crystallization in a supercooled atomic liquid. Physical Review E 91 (Feb. 2015).
22. Ruiz-Franco, J. et al. Crystal-to-Crystal Transition of Ultrasoft Colloids under Shear. Physical Review Letters 120
(Feb. 2018).
23. Mokshin, A. V., Galimzyanov, B. N. & Barrat, J.-L. Extension of classical nucleation theory for uniformly sheared
systems. Physical Review E 87 (June 2013).
24. Richard, D. & Speck, T. The role of shear in crystallization kinetics: From suppression to enhancement. Scientific
Reports 5 (Sept. 2015).
25. Mura, F. & Zaccone, A. Effects of shear flow on phase nucleation and crystallization. Physical Review E 93 (Apr.
2016).
26. Luo, S., Wang, J. & Li, Z. Homogeneous Ice Nucleation Under Shear. The Journal of Physical Chemistry B 124,
3701–3708 (Mar. 2020).
27. Sosso, G. C. et al. Crystal Nucleation in Liquids: Open Questions and Future Challenges in Molecular Dynamics
Simulations. Chemical Reviews 116, 7078–7116 (May 2016).
28. Espinosa, J. R., Sanz, E., Valeriani, C. & Vega, C. Homogeneous ice nucleation evaluated for several water models.
The Journal of Chemical Physics 141, 18C529 (Nov. 2014).
29. Espinosa, J. R., Vega, C., Valeriani, C. & Sanz, E. The crystal-fluid interfacial free energy and nucleation rate of
NaCl from different simulation methods. The Journal of Chemical Physics 142, 194709 (May 2015).
30. Espinosa, J. R., Vega, C., Valeriani, C. & Sanz, E. Seeding approach to crystal nucleation. The Journal of Chemical
Physics 144, 034501 (Jan. 2016).
31. Volmer, M. & Weber, A. Nucleus formation in supersaturated systems. Z. physik. Chem. 119, 277–301 (1926).
32. Becker, R. & Döring, W. Kinetische Behandlung der Keimbildung in übersättigten Dämpfen. Annalen der Physik
416, 719–752 (1935).
33. in. Selected Works of Yakov Borisovich Zeldovich, Volume I (ed Sunyaev, R. A.) 120–137 (Princeton University
Press, Dec. 1992).
15AUGUST 7, 2020
34. Bai, X.-M. & Li, M. Test of classical nucleation theory via molecular-dynamics simulation. The Journal of
Chemical Physics 122, 224510 (June 2005).
35. Bai, X.-M. & Li, M. Calculation of solid-liquid interfacial free energy: A classical nucleation theory based
approach. The Journal of Chemical Physics 124, 124707 (Mar. 2006).
36. Kelton, K. F., Greer, A. L. & Thompson, C. V. Transient nucleation in condensed systems. The Journal of Chemical
Physics 79, 6261–6276 (Dec. 1983).
37. Kelton, K. in Solid State Physics 75–177 (Elsevier, 1991).
38. Auer, S. & Frenkel, D. Prediction of absolute crystal-nucleation rate in hard-sphere colloids. Nature 409, 1020–
1023 (Feb. 2001).
39. Auer, S. & Frenkel, D. Numerical prediction of absolute crystallization rates in hard-sphere colloids. The Journal
of Chemical Physics 120, 3015–3029 (Feb. 2004).
40. Pan, A. C. & Chandler, D. Dynamics of Nucleation in the Ising Model†. The Journal of Physical Chemistry B
108, 19681–19686 (Dec. 2004).
41. Moyal, J. E. Stochastic Processes and Statistical Physics. Journal of the Royal Statistical Society. Series B
(Methodological) 11, 150–210 (Feb. 1949).
42. Kampen, N. V. Stochastic Processes in Physics and Chemistry (Elsevier, 1992).
43. Reguera, D., Rubi, J. M. & Vilar, J. M. G. The Mesoscopic Dynamics of Thermodynamic Systems. The Journal
of Physical Chemistry B 109, 21502–21515 (Nov. 2005).
44. Sandberg, W. & Heyes, D. Self-diffusion in equilibrium and sheared liquid mixtures by molecular dynamics.
Molecular Physics 85, 635–649 (June 1995).
45. Malandro, D. L. & Lacks, D. J. Molecular-Level Mechanical Instabilities and Enhanced Self-Diffusion in Flowing
Liquids. Physical Review Letters 81, 5576–5579 (Dec. 1998).
46. Cussler, E. Diffusion: Mass Transfer in Fluid Systems (Cambridge University Press, 2009).
47. Li, Z. Critical particle size where the Stokes-Einstein relation breaks down. Physical Review E 80 (Dec. 2009).
48. Dehaoui, A., Issenmann, B. & Caupin, F. Viscosity of deeply supercooled water and its coupling to molecular
diffusion. Proceedings of the National Academy of Sciences 112, 12020–12025 (Sept. 2015).
49. Molinero, V. & Moore, E. B. Water Modeled As an Intermediate Element between Carbon and Silicon†. The
Journal of Physical Chemistry B 113, 4008–4016 (Apr. 2009).
50. Pugliese, P., Conde, M. M., Rovere, M. & Gallo, P. Freezing Temperatures, Ice Nanotubes Structures, and Proton
Ordering of TIP4P/ICE Water inside Single Wall Carbon Nanotubes. The Journal of Physical Chemistry B 121,
10371–10381 (Nov. 2017).
51. Vega, C., Abascal, J. L. F., Conde, M. M. & Aragones, J. L. What ice can teach us about water interactions: a
critical comparison of the performance of different water models. Faraday Discuss. 141, 251–276 (2009).
52. Vega, C. & Abascal, J. L. F. Simulating water with rigid non-polarizable models: a general perspective. Physical
Chemistry Chemical Physics 13, 19663 (2011).
53. Feistel, R. & Wagner, W. A New Equation of State for H2O Ice Ih. Journal of Physical and Chemical Reference
Data 35, 1021–1047 (June 2006).
54. Vega, C. & Noya, E. G. Revisiting the Frenkel-Ladd method to compute the free energy of solids: The Einstein
molecule approach. The Journal of Chemical Physics 127, 154113 (Oct. 2007).
55. Zaragoza, A. et al. Competition between ices Ih and Ic in homogeneous water freezing. The Journal of Chemical
Physics 143, 134504 (Oct. 2015).
56. De Hijes, P. M., Sanz, E., Joly, L., Valeriani, C. & Caupin, F. Viscosity and self-diffusion of supercooled and
stretched water from molecular dynamics simulations. The Journal of Chemical Physics 149, 094503 (Sept. 2018).
57. Balasubramanian, S., Mundy, C. J. & Klein, M. L. Shear viscosity of polar fluids: Molecular dynamics calculations
of water. The Journal of Chemical Physics 105, 11190–11195 (Dec. 1996).
58. Loerting, T. & Giovambattista, N. Amorphous ices: experiments and numerical simulations. Journal of Physics:
Condensed Matter 18, R919–R977 (Nov. 2006).
59. Cao, P. et al. Mechanical properties of bi- and poly-crystalline ice. AIP Advances 8, 125108 (Dec. 2018).
60. Moreira, P. A. F. P., de Aguiar Veiga, R. G. & de Koning, M. Elastic constants of ice Ih as described by
semi-empirical water models. The Journal of Chemical Physics 150, 044503 (Jan. 2019).
61. Plimpton, S. Fast Parallel Algorithms for Short-Range Molecular Dynamics. Journal of Computational Physics
117, 1–19 (Mar. 1995).
62. Maras, E., Trushin, O., Stukowski, A., Ala-Nissila, T. & Jónsson, H. Global transition path search for dislocation
formation in Ge on Si(001). Computer Physics Communications 205, 13–21 (Aug. 2016).
16AUGUST 7, 2020
63. Stukowski, A. Visualization and analysis of atomistic simulation data with OVITO–the Open Visualization Tool.
Modelling and Simulation in Materials Science and Engineering 18, 015012 (Dec. 2009).
64. Goswami, R., Goswami, A. & Singh, J. K. d-SEAMS: Deferred Structural Elucidation Analysis for Molecular
Simulations. Journal of Chemical Information and Modeling 60, 2169–2177 (Mar. 2020).
65. Giorgino, T. Computing diffusion coefficients in macromolecular simulations: the Diffusion Coefficient Tool for
VMD. Journal of Open Source Software 4, 1698 (Sept. 2019).
66. Evans, D. J. & Morriss, G. P. Nonlinear-response theory for steady planar Couette flow. Physical Review A 30,
1528–1530 (Sept. 1984).
67. Lees, A. W. & Edwards, S. F. The computer study of transport processes under extreme conditions. Journal of
Physics C: Solid State Physics 5, 1921–1928 (Aug. 1972).
68. Daivis, P. J. & Todd, B. D. A simple, direct derivation and proof of the validity of the SLLOD equations of motion
for generalized homogeneous flows. The Journal of Chemical Physics 124, 194103 (May 2006).
69. Engineering Plasticity and Its Applications From Nanoscale to Macroscale Apr. 2009.
70. Kumar, V., Nazari, B., Bousfield, D. & Toivakka, M. Rheology of microfibrillated cellulose suspensions in
pressure-driven flow. eng (2016).
17You can also read