Studies in Applied Finance - INVESTMENT THESIS FOR COSTCO WHOLESALE CORPORATION (NASDAQ: COST) - Johns Hopkins University
←
→
Page content transcription
If your browser does not render page correctly, please read the page content below
SAF/No.21/March 2018

          Studies in Applied Finance

            INVESTMENT THESIS FOR
              COSTCO WHOLESALE
                 CORPORATION
                (NASDAQ: COST)

                                Arshad Amin Ajani

Johns Hopkins Institute for Applied Economics,
   Global Health, and the Study of Business
                  Enterprise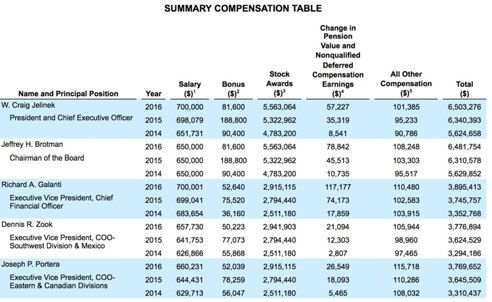
Investment Thesis for Costco Wholesale Corporation
                    (NASDAQ: COST)
                                   By Arshad Amin Ajani

Disclaimer: These research reports are primarily student reports for academic purposes and are
not specific recommendations to buy or sell a stock. Potential investors should consult a
qualified investment advisor before making any investment. This study was completed on
October 16th, 2017.

                                         About the Series
The studies in Applied Finance Series is under the general direction of Professor Steve H. Hanke
(hanke@jhu.edu), Co-Director of The Johns Hopkins Institute of Applied Economics, Global
Health, and study of Business Enterprise and Dr. Hesam Motlagh (hnekoor1@jhu.edu), a Fellow
at The Johns Hopkins Institute of Applied Economics, Global Health, and study of Business
Enterprise.

This working paper is one in a series on applied financial economics, which focuses on company
valuations. The authors are mainly students at The Johns Hopkins University in Baltimore who
have conducted their work at the Institute as undergraduate researchers.

                                              Author
Arshad Ajani (aajani2@jhu.edu) is a graduate of The Johns Hopkins University with a degree in
Economics. He conducted the research for this paper while serving as Prof. Hanke’s research
assistant at The Johns Hopkins Institute of Applied Economics, Global Health, and study of
Business Enterprise during the Fall of 2017. Currently, Arshad is an Investment Banking Analyst
at BNP Paribas in New York.

                                             Summary
The working paper is an in-depth financial analysis of Costco Wholesale Corporation (COST).
Our analysis examines COST’s business model and is combined with our proprietary Discounted
Cash Flow (P-DCF) model and a Monte-Carlo simulation. This results in distributions of probable
free cash flows. In addition to these quantitative factors, we also examine compensation plans
of Costco’s executives to assess the degree to which the executives’ compensation incentives
are aligned with the objective of creating shareholder value.

                                    Acknowledgements
Many thanks to Prof. Steve Hanke and Dr. Hesam Motlagh for guidance and draft comments.

Keywords: COST, Costco, Wholesale, Discounted Cash Flow, Free Cash Flow, Monte-Carlo
Simulations, Investment Thesis, Compensation.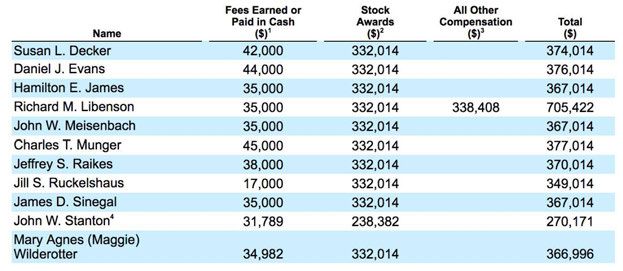
Investment Thesis for Costco Wholesale Corporation (NASDAQ: COST) by Arshad Amin Ajani

       Rating: Sell – Estimated Free Cash Flow per Share: $131.05

                                 Company Name      Costco Wholesale Corporation
                                            Date            10/16/17
                       Fiscal year ends (current
                                                      08/2017 (08/2017 Q4)
                                         period)
                                   Current Price              $157.49
                            52 week high (date)        $182.72 (06/06/17)
                             52 week low (date)        $136.59 (11/04/16)
                                    Market Cap              $69,432M
                                Enterprise Value            $70,613M
                                    Total Debt               $6,659M
                                          Cash               $5,779M
                     Net Debt/Enterprise Value                 1.25%
                                     Dividend                  1.26%
                      Shares Outstanding/Float          437.20M/429.70M
                                   Current P/E                 27.27x
                                2019 P/E (EPS)            22.66x ($7.01)*
                                2018 P/E (EPS)            24.68x ($6.44)*
                                2017 P/E (EPS)            27.28x ($5.82)*
                                     2016 EPS                 $5.33**
                                     2015 EPS                 $5.24**
                                     2014 EPS                 $4.65**
                              *Consensus Estimates as of 10/16/2017
                               **Comparable Actual from Bloomberg

                                                                                         1
Investment Thesis for Costco Wholesale Corporation (NASDAQ: COST) by Arshad Amin Ajani

Table of Contents
Executive Summary ................................................................................................................ 3
Catalysts & Risks .................................................................................................................... 3
Company Description and Historical Performance .................................................................. 3
   Business Segments ........................................................................................................................... 3
   Historical Performance ..................................................................................................................... 5
Model Assumptions................................................................................................................ 7
   Balance Sheet and Income Statement .............................................................................................. 7
   Value Drivers .................................................................................................................................... 8
   Model Results .................................................................................................................................. 9
Qualitative Analysis ...............................................................................................................13
   A. Capital Sources Analysis ............................................................................................................. 13
   B. Historical Allocation Analysis ...................................................................................................... 15
   C. Compensation and Corporate Governance ................................................................................. 17
Conclusion.............................................................................................................................20
Appendix ...............................................................................................................................21
Citations ................................................................................................................................22

                                                                                                                                                     2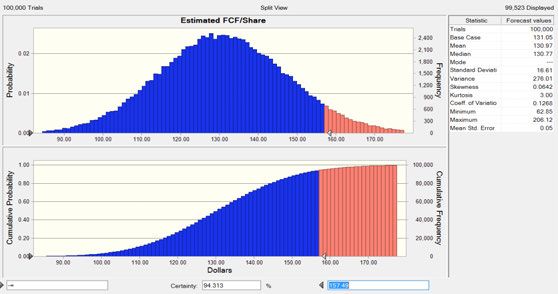
Investment Thesis for Costco Wholesale Corporation (NASDAQ: COST) by Arshad Amin Ajani

Executive Summary
Costco Wholesale Corporation is the largest American membership-only warehouse club.
Costco is headquartered in Issaquah, Washington but opened its first warehouse in Seattle in
1983. Costco offers products across six major segments: foods, sundries, hardlines, fresh foods,
softlines, and ancillary across three major geographic regions: United States, Canada, and Other
International countries. Based on historical averages and insights from earnings call reports, our
Probabilistic Discounted Cash Flow (PDCF) model in conjunction with Monte-Carlo simulations
reveal that COST’s estimated free cash flow per share is $131.05. This is based off of a very
optimistic approach taking into account strong e-commerce and new warehouse location
openings. Debt analysis has revealed strong corporate ratings above investment grade.
Management compensation is found to be quite vague in nature and exact management
incentive is hard to gauge. At the time of this evaluation (10/16/17), shares of COST are trading
at $157.49, therefore our estimated Free Cash Flow per Share represents a 16.79% discount to
the market share price. As there are also large uncertainties with future gas prices and foreign
exchange effects, we rate COST as a SELL.

Catalysts & Risks
   •   Large dependency on US and Canadian operations that comprise 87% of net sales and
       85% of total operating income in 2017
   •   Ability to capture, maintain, and grow strong membership loyalty and brand recognition
   •   Failure to develop and maintain relevant multichannel experiences for Costco members,
       especially with competition from Amazon delivery services
   •   Inability to attract, train, and retain highly qualified employees
   •   Volatility in gas price and foreign exchange currency rates
   •   Natural disasters continue to strongly effect international operations

Company Description and Historical Performance

Business Segments

Costco operates and competes with multiple industries. Its primary segment is the warehouse
club that include retail merchandise that is sold to customers in mostly large, wholesale,
quantities. These clubs are attractive to bargain hunters and small business owners. Warehouse
clubs like Costco are able to keep prices low through their “no-frills” model which operates on a
volume margin rather than a maximum profit per item basis. Examples of other warehouse
clubs operating in this sector include Sam’s Club and BJ’s Wholesale Club, both of which
operate in the United States. Costco, like the other wholesale clubs, has membership-only
chains that offer yearly memberships to their customers.

                                                                                                3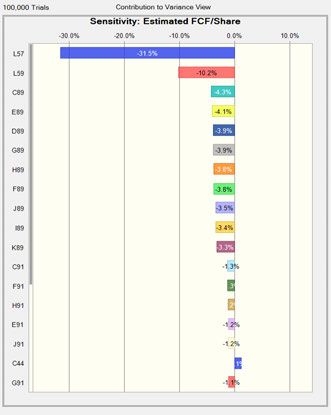
Investment Thesis for Costco Wholesale Corporation (NASDAQ: COST) by Arshad Amin Ajani

Costco also competes against a larger group of retail corporations and discount department
stores such as Target, Walmart, and The Kroger Company.

The Company’s business operations can be broken down into merchandise categories or
geographical regions. Merchandise inventory break up is as follows:

    •   Foods (including dry foods, packaged foods, and groceries) – ~22% of total revenue
    •   Sundries (including snack foods, candy, alcoholic and nonalcoholic beverages, and
        cleaning supplies) - ~21% of total revenue
    •   Hardlines (including major appliances, electronics, health and beauty aids, hardware,
        and garden and patio) - ~16% of total revenue
    •   Fresh Foods (including meat, produce, deli, and bakery) - ~14% of total revenue
    •   Softlines (including apparel and small appliances) - ~12% of total revenue
    •   Ancillary (including gas stations and pharmacy) - ~15% of total revenue 1

For accounting purposes , the Company reports its yearly revenue data by location separated
into three major categories. Costco is primarily engaged in membership warehouses in the U.S.,
Canada, Mexico, U.K., Japan, Australia, Spain, Iceland, and France. The three major geographic
segments followed by their percentage of net sales during 2017 are as follows:

    •   United States Operations – 73% net sales
    •   Canadian Operations – 15% net sales
    •   Other International Operations – 13% net sales

To illustrate the impact that each geographic segment has on the overall revenue, figure 1
below shows yearly revenue by location from fiscal year 2013 to fiscal year 2017. The United
States and Canada combined consist of over 80% of total revenue. For the purpose of this paper
we will highlight the major changes in U.S. locations, because changes in U.S. operations greatly
change our estimated Free Cash Flow. Figure 1 below emphasizes the strength of U.S.
operations by illustrating the size advantage it has. However, regardless of size, U.S. operations
have still been able to show strong signs of growth since 2013, even stronger than historic
growth of other categories. We will have to remain cognizant of this trend when projecting
future revenue growth.

1
 SEC Filing Annual 10-K Report (https://www.sec.gov/cgi-
bin/viewer?action=view&cik=909832&accession_number=0000909832-16-
000032&xbrl_type=v#)

                                                                                                4
Investment Thesis for Costco Wholesale Corporation (NASDAQ: COST) by Arshad Amin Ajani
Business Segment Revenue
100000
90000
Revenue (USD millions)
80000
70000
60000
50000
40000
30000
20000
10000
0
2013 2014 2015 2016 2017
Year
United States Operations Canadian Operations Other International Operations
Figure 1: COST Segmented Revenue by Year
Source: COST 10-K
Historical Performance
Costco’s common stock performance compared to the S&P 500 is shown in figure 2 below.
Figure 2: COST Stock Performance vs. the S&P 500
Source: Bloomberg Terminal. Command Accessed: 10/16/17
5Investment Thesis for Costco Wholesale Corporation (NASDAQ: COST) by Arshad Amin Ajani
Over the last five years, Costco’s share price has kept a consistently general upward trend along
with the market. Indeed, COST has a beta of 1.0, meaning it moved almost completely in
tandem with the broader market. However, gas prices and foreign exchange rates largely affect
Costco’s stock price. Over the past five years, foreign exchange rates have increased interest
income as much as 94% and decreased it by as much as 10%. Discussed in the earning call as
well as in the Company’s annual 10-K report, the recent large swings in gas prices and currency
exchange rates have been a strong predictor of positive or negative years for the Company.
One key event to note during 2017 is the Amazon acquisition of Whole Foods Market, Inc. After
the acquisition on June 16th, 2017, Costco’s stock price plunged 7.2%. This acquisition affected
not only Costco but also much of its peer group, including Target, Walmart, and Kroger.
Although this deal could provide Whole Foods Market with a competitive edge, as many
investors suspect, we contend the fundamental prospect and valuation of the Company
remained unchanged during this buyout proposition as a result of Costco’s unique business
model of offering products at cost in exchange for an annual membership. However sensitive
COST’s share price is to AMZN’s recent moves, we believe that Costco’s loyal membership base
will continue to grow regardless of this recent acquisition.
Next, it is important to discuss the Company’s gross margin and its focus on ensuring stability in
Merchandise Costs and Selling, General, and Administrative costs. Figure 3 tracks Merchandise
costs and Selling, General, and Administrative costs over the last five years since 2013.
Stability in Major Operating Costs
100% 87% 86% 86% 86% 86%
Percentage of Revenue
80%
60%
40%
20% 10% 10% 10% 10% 10%
0%
2013 2014 2015 2016 2017
Year
Merchandise Costs Selling, General, Administrative
Figure 3: COST Stability in Merchandise and Selling, General, and Administrative Costs
Source: COST SEC 10-K
From figure 3 above, we can implicitly observe the low gross margin (1-Merchandise Cost) that
Costco operates with. This is largely due to Costco’s business model of focusing on selling
volume with smaller profit margins. However, when we see that recent gross margin is only
6Investment Thesis for Costco Wholesale Corporation (NASDAQ: COST) by Arshad Amin Ajani
around ~11% we must also observe operating costs to evaluate the Company’s historical
efficiencies. As a percentage of revenue, we find that Costco’s ability to keep its operating costs
stable has been very effective. On the other hand, it is also hard to see any major growth in
efficiencies or potential increase in gross margin from cutting these costs. Costco’s main avenue
to experience gross margin increase is simply by focusing on increasing total Net sales.
Management discussed reaching their expansion goals of increasing top line revenue numbers
by increasing memberships across regions as well as growing their online presence. However,
there were no specific targets for cutting costs or changes in operating leverages to follow.
Over the past several years Costco has been committed to opening, on average, 25 store
locations per year with 60% of these stores opening in the United States. Referring back to our
gross margin analysis, it is clear that the Company has been successful in increasing their
percent gross margin in recent quarters. This is also achieved by leveraging their economies of
scale, by keeping the costs of opening new store locations low. Even after taking into
consideration any cannibalization of sales that may occur in these new locations, Costco’s
revenues have seen strong upward trends that further help bolster their margins.
Model Assumptions
Now that we have discussed the historical performance of COST, we turn to the model that will
be the foundation for our quantitative analysis. The PDCF uses historical averages and standard
deviations of growth and margins as the underlying basis of our future projections. For Costco,
we projected revenue across each of the company’s geographic locations. We find that Costco
models better when broken up into multi-business geography segments rather than
multinational businesses as per its management structure and growth prospects that effect
certain locations rather than specific business lines. Further, data that was provided on the 10-K
SEC filings for revenue growth were better organized for each business segment rather than
each region.
Balance Sheet and Income Statement
The results are contained in the ‘Balance Sheet’ and ‘Income Statement’ tabs of the
accompanying spreadsheet.
Starting at the top of the balance sheet we noticed a substantial decrease in Cash and Cash
Equivalents from 2015 to 2016. This is primarily a result of accelerated vendor payments of
approximately $1.70 billion made in the last week of fiscal 2016, in advance of implementing a
modern accounting system at the beginning of the next fiscal year. End of year payments to
vendors have previously also created small fluctuations in cash balances; however, 2016 was
abnormally large and so we highlight it here.
In 2017, a large portion of current debt totaling $2.20 billion was re-paid. This included a $1.10
billion payment of a 1.125% Senior Note paid in May 2017 which included the principal and
interest accrued and a $1.10 billion payment of a 5.50% Senior Note that was paid off in March
7Investment Thesis for Costco Wholesale Corporation (NASDAQ: COST) by Arshad Amin Ajani
2017 which also included the principal and interest accrued. Both debt payments were
completed through the company’s existing sources of Cash and Cash Equivalents and Short-
Term investments. We will discuss other outstanding debt obligations later in this investment
thesis.
Switching over to the income statement, we notice that fiscal year 2017 was relatively strong in
terms of growth in Net sales. This large jump from 2016 is directly correlated with an increase
in new warehouse locations. Other strong factors for this growth consist of: increase in gasoline
prices and favorable foreign exchange effects. Net sales were also negatively impacted by
slower than expected growth from Other International Operations. Comparable store sales also
drove the Company’s strong sales growth by hitting record shopping frequencies and an
increase in average consumer ticket (amount spent per customer per visit). Lastly,
cannibalization of sales between warehouse locations also has had a strong negative impact on
the growth of sales,2 however the overall net effect of opening warehouse locations is still very
much positive.
Merchandise costs consist of the purchase price of inventory sold, shipping charges, and all
costs related to the Company’s depot operations. Merchandise costs increased substantially in
fiscal 2017 as a result of stronger sales. No other description has been given for this category,
but overall effect of Merchandise Costs on gross margin has left a positive impact on
percentage of gross margin. Selling, general, and administrative (SGA) costs increased in 2017
especially in the fourth quarter (Q4) because of Hurricane Harvey.
Lastly, as a repeating theme throughout this investment thesis, foreign exchange rates took a
large toll on Interest Income in 2017. Effects of foreign exchange decreased Interest Income by
$12.00 million while the remaining $6.00 million decrease was due to organic decline.
Value Drivers
The results are contained in the ‘Value Drivers’ tab of the accompanying spreadsheet
The top portion of the tab starts with annual Revenue followed by its annual growth rate. This
helps us understand exactly how strong 2017’s growth rate was compared to the previous five
years. This reiterates the volatility of Costco’s business based on two main factors: gasoline
prices and foreign exchange effects. Although 2017 was historically high compared to the past
few years, management believes that revenue growth close to 8.00% can be achieved moving
forward. In 2017, net sales increased by 9% primarily due to a 4% increase in comparable store
sales during the same year. There is a large dependence on overall economic factors to
positively affect Net sales. However, management states that much of this year’s growth can
also be attributed to their new e-commerce platform that they introduced a year ago. The new
e-commerce platform is still in progress and is slowly making its way to Costco Warehouse
locations.
2
Transcripts, S. (2017, August 17). Costco Wholesale Corporation (COST) Q4 2017 Results
8Investment Thesis for Costco Wholesale Corporation (NASDAQ: COST) by Arshad Amin Ajani
This year, e-commerce was up 15% to $4.60 billion in US, Canada, UK, Mexico, Korea and
Taiwan which are the primary markets that currently have this service. For Q4, the Company
reported record growth of 27% in the same segment. Improved search functionality,
streamlined checkout process, improved member ability to track orders, and the addition of
new well-known and high end manufacturers such as Marmot, Spyder, ExOfficio, GE Appliances
and Jiffy Lube Services will carry this segment and help Costco achieve strong growth especially
in the United States operations for the next few years.
As analyzed earlier, historical Merchandise cost for the Company as a percentage of total
revenue basis has remained stable. SGA and Preopening expenses for new locations also show
similar signs of stagnation and will make for a very reliable assumption when we begin to tune
our model.
Turning to the cash flow drivers, we define Working Capital as: Current Assets – Current
Liabilities – Cash and Cash Equivalents. Because of our unique definition for Working Capital
combined with Costco’s substantial amount of cash on hand, the Working Capital calculation
reveals a negative working capital for most years. Later, we will discuss credit facilities and
other debt instruments. However, management states that the Company also uses credit
facilities to help provide for Working Capital needs.
As Costco continues to focus on increasing the number of locations and warehouses that they
own and lease, Capital Expenditures (CAPEX) have increased over the past few years to 2.75%
of total revenue in fiscal year 2017. This figure represents a 13.00% decrease from 2016.
However, CAPEX is expected to remain relatively steady over the long run as Costco continues
to focus on increase their number of warehouses. We do not expect major deviation from their
historic yearly warehouse openings.
Model Results
Values are contained in the P-DCF and MC tabs of the accompanying spreadsheet
For the purpose of this investment thesis, we have decided to portray optimistic assumptions to
help solidify our sell recommendation.
We begin with our Model Tuning Parameters. As previously mentioned, 2017 was an unusually
strong year for Costco and as such we saw a significant increase in Revenue and decrease in
SGA costs. However, for this model we have decided to project similar growth rates for the
Company into the future. This will help us asses the growth potential of the Company and help
us gain a better understanding of potential Estimated Free Cash Flow per Share.
As such, we begin by targeting an 8% Revenue growth rate over the next 10 years. In the annual
report and especially through the earnings call, management suggested that strong growth in
the future is expected. Consensus estimates also target a growth play for Costco in the future.
However, most estimates and primary sources suggest long term growth of Net sales to
9Investment Thesis for Costco Wholesale Corporation (NASDAQ: COST) by Arshad Amin Ajani
decrease and stabilize after a few years of strong growth from newly implemented e-commerce
strategies. Here, we have projected sales to grow at an 8% rate continuously for the next 10
years without any decline or plateau to a more likely long-term growth rate.
Accordingly, we have projected the highest growth rate to the United States Operations which
we set to this year’s growth rate of 8.44% which is around 3.00% higher than the historical
average over the last five years. Secondly, we project Canada (as the second strongest grower
in 2017) to grow at a rate 3.70% higher than its five-year historic average. Lastly, we create a
scenario where the smallest portion of Revenue, Other International Operations, is projected to
grow at a rate approximately equal to its fiscal 2017 rate of 8.00% (which is 1.00% more than its
historic average). Here, we pushed the limits of expected growth in all three categories which
will create a biased “best case scenario” for Costco.
Management stated in the 10-K that the decline in SGA in 2017 was due to the new co-branded
Visa Credit Card. They also specified that this decline in SGA costs was an anomaly and that it
would be tough to match next year. However, because we wanted to create an optimistic
situation that is still within the historic bounds of Costco’s previous performance, we have
projected SGA costs to mimic 2017 trend. We have considered Costco’s historic average for SGA
and have projected for a slight margin of improvement. Merchandise costs have also been set
close to 2017 margins to account for similar long-term asset growth as the Company prepares
for more sales and store openings in the future.
Non-operating costs, as exemplified in the Value Drivers tab, have been very stable over the
past five years, regardless of the quantity of sales. As such, we find it appropriate to leave non-
operating costs at their historic average as there is also no management guidance of any future
changes in these costs.
Over the past few years, the Company has tried to open around 25 to 30 new warehouses (total
of 715 warehouses as of September 2017) each year and for 2017, this target was reached.
Combining this with a lack of management guidance on any changes of warehouse growth, we
project long term capital expenditure (CAPEX) to maintain its long-term historic growth rate.
Next, we compare the model tuning parameters that include: Free Cash Flow Return on
Invested Capital (FROIC), Potential Free Cash Flow Yield (PFCFY), Long Term Asset Turnover
(LTAT), and Long Term Asset/Invested Capital (LTA/IC). Although our assumptions are on the
optimistic side of the spectrum, it is important to check that our model does not go too far out
of line with the historic range. Comparing our model’s projections versus historical minimums,
averages, and maximums we notice that our model is reasonably near historic data. Although
our model pushes the model assumption, we try to reasonably evaluate Costco’s ability to
strive for long-term growth. Figure 4 below represents the model tuning parameter
comparisons.
10Investment Thesis for Costco Wholesale Corporation (NASDAQ: COST) by Arshad Amin Ajani
Model Tuning Parameters
Model Historical
Min Avg Max Trend Min Avg Max Trend
FROIC 13.39% 14.38% 15.13% 10.23% 10.98% 12.44%
PFCFY 2.29% 2.30% 2.31% 1.83% 1.95% 2.05%
LTAT 0.20 0.20 0.20 0.20 0.21 0.22
LTA/IC 118.56% 125.85% 132.23% 110.87% 116.03% 123.88%
% DCF in TV 55.11%
Figure 4: Model and Historical Model Tuning Parameters
Source: COST SEC 10-K and P-DCF Tab Screenshot
The free cash flow per share obtained from these assumptions is $131.05. The current price
upon this evaluation is $157.49 per share. This represents a 16.79% downside to this
investment. We are having a hard time justifying the current share price with a 10% discount
rate, let alone any potential upside.
To asses how well-determined these forecasted values were, we performed a Monte-Carlo
(MC) Simulation (see figure 5). Further, we notice that the MC Simulation is relatively
dominated by the Merchandise costs. However, reflecting back on historic numbers we can
asses the practicality of our assumption when we realize that historic Merchandise costs have
been very stable over the past five years.
Our sensitivity analysis of the MC simulation can be viewed in figure 6. As we notice,
Merchandise Costs strongly affect the sensitivity of the Monte-Carlo simulation. However, as
mentioned before we believe that Merchandise costs should account for similar long-term
asset growth that we have seen in 2017 as the Company prepares for more sales and store
openings in the future. As such we have confidence in our 85% assumption but do acknowledge
the strong weight it has on our model.
11Investment Thesis for Costco Wholesale Corporation (NASDAQ: COST) by Arshad Amin Ajani
Figure 5: Monte-Carlo Simulation
Source: Crystal Ball, Monte Carlo Simulation on Estimated FCF/Share
Figure 6: Monte-Carlo Simulation Sensitivity Analysis
Source: Crystal Ball, Monte Carlo Simulation Sensitivity Analysis on Estimated FCF/Share
12Investment Thesis for Costco Wholesale Corporation (NASDAQ: COST) by Arshad Amin Ajani
Qualitative Analysis
A. Capital Sources Analysis
As mentioned earlier, Costco prioritizes using debt to fund their working capital needs on a
daily basis. The Company uses Cash and Cash Equivalents as well as proceeds from Short-term
Investments to pay off the long-term Senior Note debt obligations. Currently, the company is
responsible for the following Senior Notes including those that were due earlier this year.
Figure 7 below outlines the Total Long-Term Debt the Company currently holds. March 2017
and December 2017 maturities have already been paid as of March and May of this year,
respectively ($2.20 billion in total).
Figure 7: List of Current Long-Term Debt Obligations
Source: COST 10-K
The Company also uses short-term credit facilities as its main form of short-term borrowing.
Total short-term borrowing from credit facilities increased from $400 million in 2016 to $833
million in 2017. At the end of 2017 and 2016, there were no outstanding borrowings under
these credit facilities. During 2017, the amount of short-term borrowing was deemed
“immaterial.” However, in 2016, the average short-term borrowing was around $90.00 million
and carried an average interest rate of just 0.52% during the year.
The Company’s current Net Debt/Enterprise Value (EV) is 1.25% (Net Debt/EBITDA is 16.05%).
This shows that management has been on track to keep a cash balance large enough to fund
debt obligations. The Company’s corporate debt ratings are as outlined in figure 8. Although
Costco’s debt makes up a small percentage of their total EV, it is important to consider
13Investment Thesis for Costco Wholesale Corporation (NASDAQ: COST) by Arshad Amin Ajani
potential risk. As seen in figure 8, the Company maintains strong investment grade corporate
ratings by three major rating agencies and continue to have “stable” or “positive” outlooks. This
is a strong sign that taking on debt is a nonissue.
Figure 8: COST Corporate Bond Ratings
Source: Bloomberg Terminal. Command: Accessed: 11/01/17
As for debt distribution, the Company’s debt timeline is full of debt obligations that expire
almost every year for the next five years. Although initially alarming, Costco has a strong history
of carrying a large amount of cash (relative to long-term debt). Figure 9 below graphically
represents the debt timeline.
14Investment Thesis for Costco Wholesale Corporation (NASDAQ: COST) by Arshad Amin Ajani
Figure 9: Debt Distribution Timeline
Source: Bloomberg Terminal. Command: Accessed: 10/28/17
B. Historical Allocation Analysis
A strong trend that the Company has indulged in is keeping the amount of CAPEX constant. This
is directly a result of opening up new international warehouse locations. The Company will
focus its attention on operations within the United Sates; however, significant effort is being
made to increase store locations in Canada and abroad as well. This effort to remain consistent
in the number of warehouse openings per year has been mentioned earlier, but is also a key
part of their capital allocation strategy to boost top-line sales growth. Management believes
that the cannibalization of sales between store locations is strongly overcome by the increase in
Revenue and membership.
During the past five years, Costco has not attempted to make acquisitions. The most recent
buyout the Company participated in was in 2012 when they bought out the 50% non-
controlling interest in the Company’s joint venture in Mexico. Subsequent to the acquisition,
Costco included 100% of Mexico's operations within "net income attributable to Costco" in the
15Investment Thesis for Costco Wholesale Corporation (NASDAQ: COST) by Arshad Amin Ajani
consolidated statements of income. Costco is not expected to stray from their historical lack of
acquisitions and as such, no adjustments were made in the model for any such future buyout.
Costco uses two methods to return capital to its shareholders. One is through dividends and the
other is through yearly stock repurchase programs. Each year management authorizes around
$4.00 billion of share repurchases. During the past five years Costco has never fully executed
these share repurchases. However, they frequently repurchase large chunks of stocks averaging
around $350.00 million which, in our opinion, pushes the stock price even higher above its
already overvalued price.
Dividends are more systematically approached with around a $0.05 increase each year to their
quarterly dividend. This sends a strong sign to investors that the company is meeting its
expectations and is growing at a steady pace. This increases investor confidence and keeps
investors satisfied. Figures 10 and 11 below show yearly share purchases and quarterly dividend
amounts by year, respectively.
Yearly Share Repurchases
$600
Share Repurchases (millions of USD)
494 477 473
$500
$400 334
$300
$200
$100 34
$0
2013 2014 2015 2016 2017
Year
Figure 10: COST Historic Yearly Share Repurchases
Source: COST SEC 10-K
16Investment Thesis for Costco Wholesale Corporation (NASDAQ: COST) by Arshad Amin Ajani
Quarterly Dividend by Fiscal Year
$0.60
Dividends paid (USD per share)
$0.50
$0.50 $0.45
$0.40
$0.40 $0.36
$0.31
$0.30
$0.20
$0.10
$0.00
2013 2014 2015 2016 2017
Year
Figure 11: COST Historic Dividend Payment
Source: COST SEC 10-K
C. Compensation and Corporate Governance
Before diving directly into management compensation, we will evaluate the board of directors
that participate on various committees, including the Compensation Committee. The
Compensation Committee’s function is to review the salaries, bonuses, and stock-based
compensation provided to executive officers of the Company and to oversee the administration
of the Company’s compensation programs. As such, directors have a strong impact on
management’s yearly compensation package.
Figure 12: Composition of Board of Directors
Source: COST SEC DEF-14A
17Investment Thesis for Costco Wholesale Corporation (NASDAQ: COST) by Arshad Amin Ajani
Figure 12 represents a 75% independent Board of Directors. Costco, like many other
corporations, tries to separate management from Committee positions to prevent conflicts of
interest. As of August 2017, Jeffrey H. Brotman passed away and chief operating officer and
direct of Blackstone, Hamilton Evans “Tony” James replaced Brotman as the Chairman of the
Board. This tilted the board even further towards independent directors.
Compensation for directors is heavily weighted towards Stock Awards. Each non-employee
director earns $30,000.00 per year for serving on the Board and an additional $1,000.00 for
each Board and committee meeting attended. For fiscal 2016, non-employee directors were
also granted 2,150 restricted stock units (RSUs). These stock units are vested over three years,
beginning on year after they have been awarded. Figure 13 outlines exact compensation
amounts for each director.
Figure 13: Compensation Table for Board of Directors
Source: COST SEC DEF-14A
Elements of management compensation include the following segments:
1. Performance-based RSUs
2. Base salary
3. Cash bonus
4. Other elements
These elements are sorted into two different lengths of compensation: short-term and long-
term performance. Short-term incentives are evaluated on a twelve-month basis and consists
primarily of RSUs and to a lesser extent, cash bonuses. Longer-term incentives also consist
primarily of RSUs that vest over a five-year period and to a lesser extent certain benefit plans
(i.e. deferred compensation plan and 401(k) retirement plan matches).
18Investment Thesis for Costco Wholesale Corporation (NASDAQ: COST) by Arshad Amin Ajani
Chief Executive Officer (CEO) compensation consists of $700,000 annual base salary (which is
unchanged from the prior year) and a cash bonus of up to $200,000 (also unchanged from
2015) which is determined by the Board of Directors (the Board) or Compensation Committee
(the Committee). The RSU award is also determined by the Board or the Committee at the end
of the year. For fiscal 2016, the Committee granted 35,190 performance-based RSUs to Mr.
Jelinek. Also for 2016, the CEO received a cash bonus of $81,600. The cash bonus was
determined by the Company’s progress toward its pre-tax income goal (which was not fully
achieved in 2016).
Other Named Executive Officers (NEOs) 2016 compensation consists primarily of performance-
based RSUs. The exact amounts awarded were based on the recommendations of Mr. Jelinek.
Salaries for other NEOs were based upon the recommendation of Mr. Jelinek, who focused on
the amount of increase deserved compare to prior year’s salary level. Base salaries for 2016
were increased by 3.00% from fiscal year 2015. Other NEOS received cash bonuses of up to
$52,640 (less than 2015) as a result of not meeting pre-tax income goal for the Company. Bonus
criteria were approved by the Committee and were based off Mr. Jelinek’s recommendations.
Mr. Jelinek’s recommendation for 2016 included approximately 65.00% of total eligible amount
of up to $80,000.
Aside from CEO recommendations, bonus-eligible employees are measured by the Company’s
attainment of its internal pre-tax income target. For 2016, the target was $3.64 billion using
generally accepted accounting principles (GAAP) basis. 99.00% of the target was achieved as
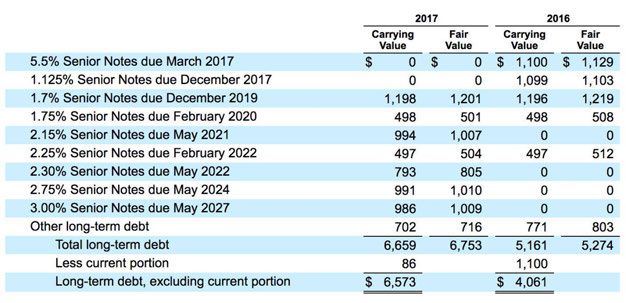
the actual pre-tax income was $3.62 billion. Summary compensation table for CEO and other
NEOs are as outlined in figure 14.
Figure 14: Summary Compensation Table
Source: COST SEC DEF-14A
19Investment Thesis for Costco Wholesale Corporation (NASDAQ: COST) by Arshad Amin Ajani
Stock ownership requirements for Costco state that all executive officers are required to own
and maintain at least 12,000 shares of common stock. Further, the Company prohibits
transactions that involve hedging of Company shares by directors and executive officers
without the approval of the Board.
Peer companies that Costco looks at to evaluate their management compensation include: Wal-
Mart Stores, inc., The Home Depot, Inc., Target Corporation, The Kroger Company, and Lowe’s
Companies. This list of peer companies represents a strong variety of companies bigger and
smaller (in terms of market capitalization) than Costco. The Company however outlines very
few peer group companies which restricts our ability to compare compensation. Whereas
companies like Target and The Home Depot list over 30 companies that make up their peer
group, Costco lists just five giving Costco the ability to pick and chose exactly how they want to
compensate their management. Costco’s compensation is nearly half of the average of its peer
group. This is reflective of their very volatile performance over the last year compared to their
competitors.
Overall, the Company bases compensation on two main factors: i) pre-tax income measured on
GAPP basis ii) discretion of individual performance through recommendation of CEO. These two
metrics are relatively vague in our opinion. Although GAAP accounting principles are used and
therefore we can be sure that no odd adjustments are made, there is a lack of strength when it
comes to evaluating management’s ability to create long-term value for the Company. Looking
at Costco’s peer group it is apparent that Costco compensates its management at a relatively
low level, however this list is made up of just a handful of names and is not comprehensive like
many of Costco’s rival companies. Therefore, we rate Costco’s management compensation as
neutral.
Conclusion
According to our assumptions, Costco currently has an estimated Free Cash Flow per Share that
is less than the current stock price. This is after we have assumed extremely optimistic growth
for the next 10 years. Secondly, management disclosure of fluctuations and anomalies in the
balance sheet and income statements are very scarce. There is a strong lack of description of
variation and accounting changes from year to year. Third, neutral management compensation
further dilutes any potential value proposition as it is hard to gauge exactly what incentivizes
management. For these reasons and a general uncertainty of gas prices and foreign exchange
effects on Costco’s business operations, we rate Costco a SELL.
20Investment Thesis for Costco Wholesale Corporation (NASDAQ: COST) by Arshad Amin Ajani
Appendix
Figure 15: COST Insider Holdings
Source: Bloomberg Terminal. Command Accessed: 11/01/17
Figure 16: COST Insider Transactions
Source: Bloomberg Terminal. Command: Accessed: 11/01/17
21Investment Thesis for Costco Wholesale Corporation (NASDAQ: COST) by Arshad Amin Ajani
Citations
EDGAR | Company Filings. (n.d.). Retrieved October 16, 2017, from
https://www.sec.gov/edgar/searchedgar/companysearch.html
Costco Wholesale Corporation. (2017). Annual report 2017. Retrieved from SEC EDGAR, from
https://www.sec.gov/Archives/edgar/data/909832/000090983217000014/cost10k9031
7.htm
Costco Wholesale Corporation. (2017). Quarterly report 2017. Retrieved from SEC EDGAR, from
https://www.sec.gov/Archives/edgar/data/909832/000090983217000009/cost10q5071
7.htm
Costco Wholesale Corporation. (2017). Proxy report 2017. Retrieved from SEC EDGAR, from
https://www.sec.gov/Archives/edgar/data/909832/000090983216000036/costproxy20
16.htm
Transcripts, S. (2017, August 17). Costco Wholesale Corporation (COST) Q4 2017 Results -
Earnings Call Transcript. Retrieved October 18, 2017, from
https://seekingalpha.com/article/4112046-costco-wholesale-corporation-cost-q4-2017-
results-earnings-call-transcript?part=single
Bloomberg. (2017) Bloomberg Professional. Retrieved October 16, 2017, from Johns Hopkins
University Subscription Service
22You can also read