TD Securities Mining Conference - January 23, 2020 - Lundin Mining
←
→
Page content transcription
If your browser does not render page correctly, please read the page content below
TD Securities Mining Conference
                                           January 23, 2020

TSX: LUN Nasdaq Stockholm: LUMI                                     Candelaria, Atacama Region, Chile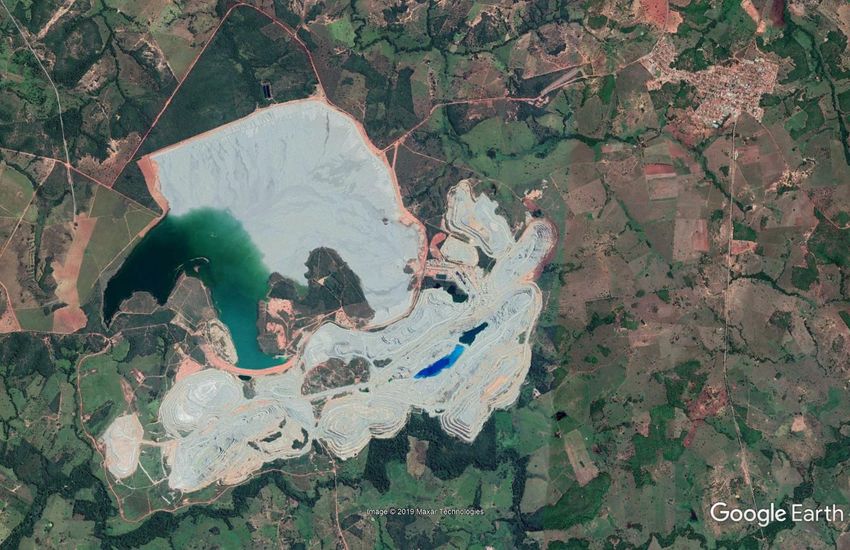
Cautionary Statements
Caution Regarding Forward-Looking Information and Non-GAAP Performance Measures
Certain of the statements made and information contained herein is “forward-looking information” within the meaning of applicable Canadian securities laws. All statements other than statements of historical facts included in this
document constitute forward-looking information, including but not limited to statements regarding the Company’s plans, prospects and business strategies; the Company’s guidance on the timing and amount of future production
and its expectations regarding the results of operations; expected costs; permitting requirements and timelines; timing and possible outcome of pending litigation; the results of any Preliminary Economic Assessment, Feasibility
Study, or Mineral Resource and Mineral Reserve estimations, life of mine estimates, and mine and mine closure plans; anticipated market prices of metals, currency exchange rates, and interest rates; the development and
implementation of the Company’s Responsible Mining Management System; the Company’s ability to comply with contractual and permitting or other regulatory requirements; anticipated exploration and development activities at
the Company’s projects; and the Company’s integration of acquisitions (such as the Chapada mine) and any anticipated benefits thereof. Words such as “believe”, “expect”, “anticipate”, “contemplate”, “target”, “plan”, “goal”, “aim”,
“intend”, “continue”, “budget”, “estimate”, “may”, “will”, “can”, “could”, “should”, “schedule” and similar expressions identify forward-looking statements.

Forward-looking information is necessarily based upon various estimates and assumptions including, without limitation, the expectations and beliefs of management, including that the Company can access financing, appropriate
equipment and sufficient labour; assumed and future price of copper, nickel, zinc, gold and other metals; anticipated costs; ability to achieve goals; the prompt and effective integration of acquisitions; that the political environment
in which the Company operates will continue to support the development and operation of mining projects; and assumptions related to the factors set forth below. While these factors and assumptions are considered reasonable by
Lundin Mining as at the date of this document in light of management’s experience and perception of current conditions and expected developments, these statements are inherently subject to significant business, economic and
competitive uncertainties and contingencies. Known and unknown factors could cause actual results to differ materially from those projected in the forward-looking statements and undue reliance should not be placed on such
statements and information. Such factors include, but are not limited to: risks inherent in and/or associated with operating in foreign countries; uncertain political and economic environments; community activism, shareholder
activism and risks related to negative publicity with respect to the Company or the mining industry in general; changes in laws, regulations or policies including but not limited to those related to permitting and approvals,
environmental and tailings management, labour, trade relations, and transportation; delays or the inability to obtain necessary governmental approvals and/or permits; regulatory investigations, enforcement, sanctions and/or
related or other litigation; risks associated with business arrangements and partners over which the Company does not have full control; risks associated with acquisitions and related integration efforts (including with respect to the
Chapada mine), including the ability to achieve anticipated benefits, unanticipated difficulties or expenditures relating to integration and diversion of management time on integration; competition; development or mining results not
being consistent with the Company’s expectations; estimates of future production and operations; operating, cash and all-in sustaining cost estimates; allocation of resources and capital; litigation; uninsurable risks; volatility and
fluctuations in metal and commodity prices; the estimation of asset carrying values; funding requirements and availability of financing; indebtedness; foreign currency fluctuations; interest rate volatility; changes in the Company’s
share price, and equity markets, in general; changing taxation regimes; counterparty and credit risks; health and safety risks; risks related to the environmental impact of the Company’s operations and products and management
thereof; unavailable or inaccessible infrastructure and risks related to ageing infrastructure; risks inherent in mining including but not limited to risks to the environment, industrial accidents, catastrophic equipment failures, unusual
or unexpected geological formations or unstable ground conditions; actual ore mined varying from estimates of grade, tonnage, dilution and metallurgical and other characteristics; ore processing efficiency; risks relating to
attracting and retaining of highly skilled employees; ability to retain key personnel; the potential for and effects of labour disputes or other unanticipated difficulties with or shortages of labour or interruptions in production; the
price and availability of energy and key operating supplies or services; the inherent uncertainty of exploration and development, and the potential for unexpected costs and expenses including, without limitation, for mine closure
and reclamation at current and historical operations; risks associated with the estimation of Mineral Resources and Mineral Reserves and the geology, grade and continuity of mineral deposits including but not limited to models
relating thereto; actual ore mined and/or metal recoveries varying from Mineral Resource and Mineral Reserve estimates; mine plans, and life of mine estimates; the possibility that future exploration, development or mining results
will not be consistent with expectations; natural phenomena such as earthquakes, flooding, and unusually severe weather; potential for the allegation of fraud and corruption involving the Company, its customers, suppliers or
employees, or the allegation of improper or discriminatory employment practices, or human rights violations; security at the Company’s operations; breach or compromise of key information technology systems; materially
increased or unanticipated reclamation obligations; risks related to mine closure activities; risks related to closed and historical sites; title risk and the potential of undetected encumbrances; risks associated with the structural
stability of waste rock dumps or tailings storage facilities; and other risks and uncertainties, including but not limited to those described in the “Risk and Uncertainties” section of the Annual Information Form for the year ended
December 31, 2018 and the “Managing Risks” section of the Company’s MD&A for the year ended December 31, 2018, which are available on SEDAR at www.sedar.com under the Company’s profile. All of the forward-looking
statements made in this document are qualified by these cautionary statements. Although the Company has attempted to identify important factors that could cause actual results to differ materially from those contained in
forward-looking information, there may be other factors that cause results not to be as anticipated, estimated, forecast or intended and readers are cautioned that the foregoing list is not exhaustive of all factors and assumptions
which may have been used. Should one or more of these risks and uncertainties materialize, or should underlying assumptions prove incorrect, actual results may vary materially from those described in forward-looking
information. Accordingly, there can be no assurance that forward-looking information will prove to be accurate and forward-looking information is not a guarantee of future performance. Readers are advised not to place undue
reliance on forward-looking information. The forward-looking information contained herein speaks only as of the date of this document. The Company disclaims any intention or obligation to update or revise forward‐looking
information or to explain any material difference between such and subsequent actual events, except as required by applicable law.

This presentation may contains certain financial measures such as net cash, net debt, operating cash flow per share, co-product cash costs and cash costs which have no standardized meaning within generally accepted accounting
principles under IFRS and therefore amounts presented may not be comparable to similar data presented by other mining companies. This data is intended to provide additional information and should not be considered in
isolation or as a substitute for measures or performance prepared in accordance with IFRS.
Note: All dollar amounts are in US dollars unless otherwise denoted.
                                                                                                                                                                                                                                2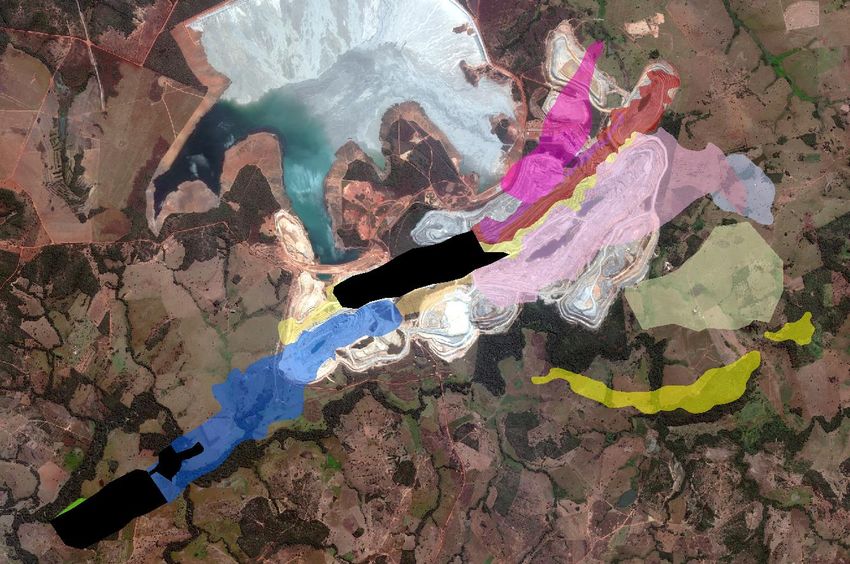
Lundin Mining
Our Strategy
Operate, upgrade and grow a base metals
portfolio that provides leading returns for our
shareholders throughout the cycle

 •   copper dominant
 •   competitive cost position
                                                                                                 Eagle                                             Zinkgruvan
 •   low-risk mining jurisdictions,                                                    Nickel-Copper-PGMs in U.S.A.                           Zinc-Lead-Copper in Sweden
     leverage current geographies
 •   pipeline of development and
     exploration projects
 •   maintain low leverage and flexible
     balance sheet while increasing
     direct shareholder returns

                                                                                                                                                  Neves-Corvo
                                                                                                                                              Copper-Zinc-Lead in Portugal

                                                                Candelaria1
                                                          Copper-Gold-Silver in Chile                                    Chapada
                                                                                                                      Copper-Gold in Brazil

                                          1. Lundin Mining holds an 80% interest in Candelaria                                                                               3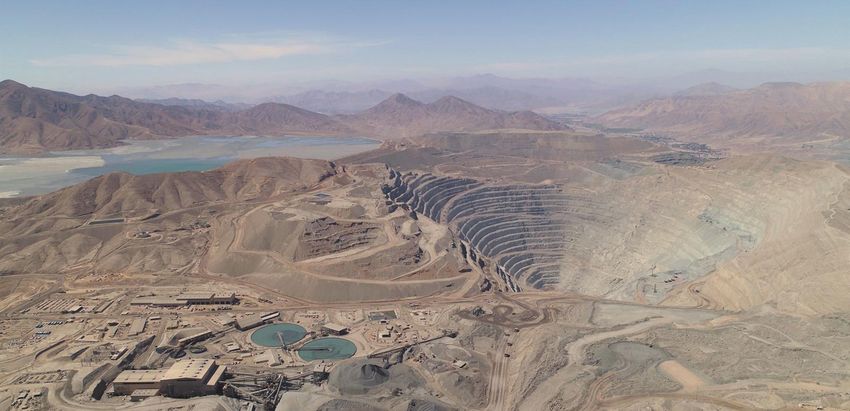
Responsible Mining
Safety
                                                                                     Total Recordable Injury Frequency
 •   2020 safety objective remains Zero Harm                                         per 200,000 person hours worked
 •   top-third performance of Western world mines

Social
 •   leading ISS Environment & Social Quality Scores                                        3.5

 •   strong stakeholder engagement and increased social investment                    3.1

Environmental                                                                                             2.5

•    robust risk and compliance management programs in place
                                                                                                                 2.0
•    environmental footprint reduction goals set for water, dust and energy
                                                                                                   1.6                  1.6

                  United Nations Global Compact (UNGC)
                                                                                                                               0.9
                  •   Lundin Mining joined the UNGC in 2016                                                                                         0.7    0.7
                                                                                                                                      0.6    0.6
                  •   our Mission, Values and Responsible Mining Policy align
                      with the UNGC Ten Principles on human rights, labour, the
                      environment and anti-corruption, as well as the 17
                                                                                     2009   2010   2011   2012   2013   2014   2015   2016   2017   2018   2019
                      Sustainable Development Goals (SDGs)
                  •   we continue to further integrate the SDGs into our business
                      strategy, day-to-day operations and our organizational
                      culture by creating shared value, fostering partnerships and
                      demonstrating environmental and economic performance

                                                                                                                                                                  4
Increasing Production Profile1 (kt)

                                     Copper                                                                                                         Zinc                                                                                                  Nickel
                                                                      294 - 318
                                                                                                                                                                                 227 - 237

                                                 272 - 296                                                                                                                                                                                                              15 - 18             15 - 18
                                                                                                                                                                                                                                   18

                                                                                         +30%
                                                                                                                                                                                                                                                       13
                                                                                                                                                            172 - 187                                +50%
                                                           including
                                                          180-200 koz
                                 235                    gold in 2020-212

                                                                                                                         152                 152

             200

           2018A               2019A                2020                 2021                                         2018A               2019A                 2020                2021                                        2018A               2019A                 2020                2021

1. Production profile based on certain estimates and assumptions, including but not limited to; Mineral Resource and Mineral Reserve estimates geological formations, grade and continuity of deposits and metallurgical characteristics. The 2020-2021 guidance was announced by news release on November
   26, 2019. The 2019 production results were announced in the press release dated January 22, 2020. Copper production for 2019 reflects attributable production for the Chapada Mine under Lundin Mining ownership.
2. Gold production guidance for Candelaria is 100-105 koz in 2020 and 110-115 koz in 2021, on a 100% basis. Currently, 68% of Candelaria’s total gold and silver production are subject to a streaming agreement. Gold production guidance for Chapada is 90-95 koz in 2020 and 70-75 koz in 2021. Chapada’ s
   gold production is unencumbered.                                                                                                                                                                                                                                                                             5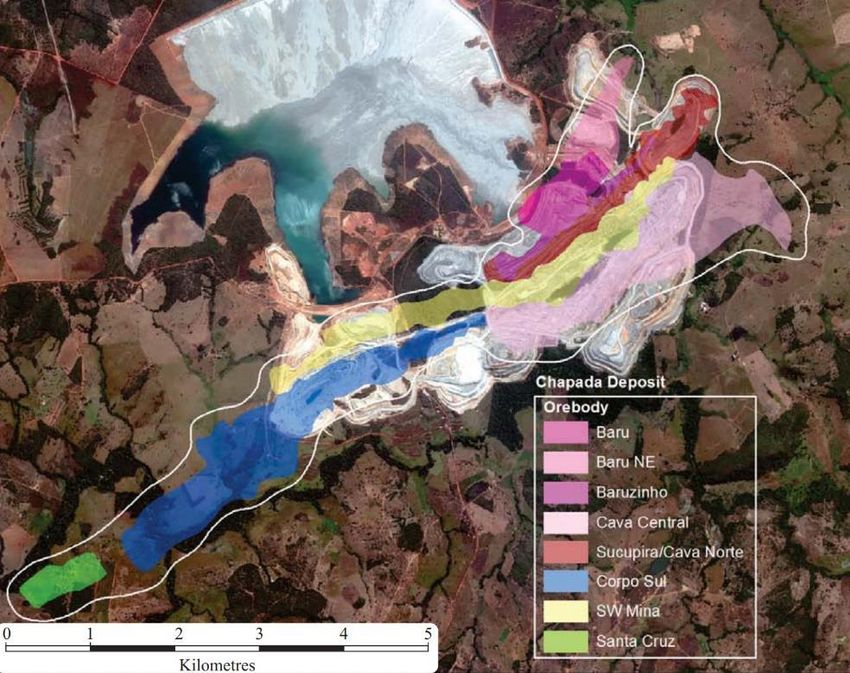
Notable Recent Events
                                                                                                                                       1
 Sale of Non-Core Interest in Kokkola Cobalt Refinery
    •    Freeport Cobalt joint venture sold its non-core stake in Kokkola cobalt refinery
         and related cobalt cathode precursor business
    •    total cash consideration of approximately $200M; 30% attributable to Lundin
         Mining
    •    received approximately $100M in distributed funds, including the proceeds of
         the transaction

 Anticipated Dividend Increase2
    •    33% increase in the quarterly dividend to C$0.04 per common share,
         C$0.16 annualized, anticipated to be declared in February 2020
    •    2.1% annualized yield3

                                                                                                                                                        Kokkola Cobalt Refinery

 Normal Course Issuer Bid (NCIB) Renewed2
    •    discretionary NCIB to be utilized from time-to-time to actively manage outstanding shares and make opportunistic purchases to create shareholder value
    •    as of December 31, 2019, Lundin Mining had purchased 4.3M common shares through open market transactions

1. Refer to Press Release “Lundin Mining Announces Closing of Sale of Interest in Kokkola Cobalt Refinery” dated December 2, 2019.
2. Refer to Press Release “Lundin Mining Provides Operational Outlook & Shareholder Returns Update” dated December 5, 2019.
3. Based on anticipated annualized dividend of C$0.16 per common share and Lundin Mining January 21, 2020 closing share price of C$7.46 per share.                            6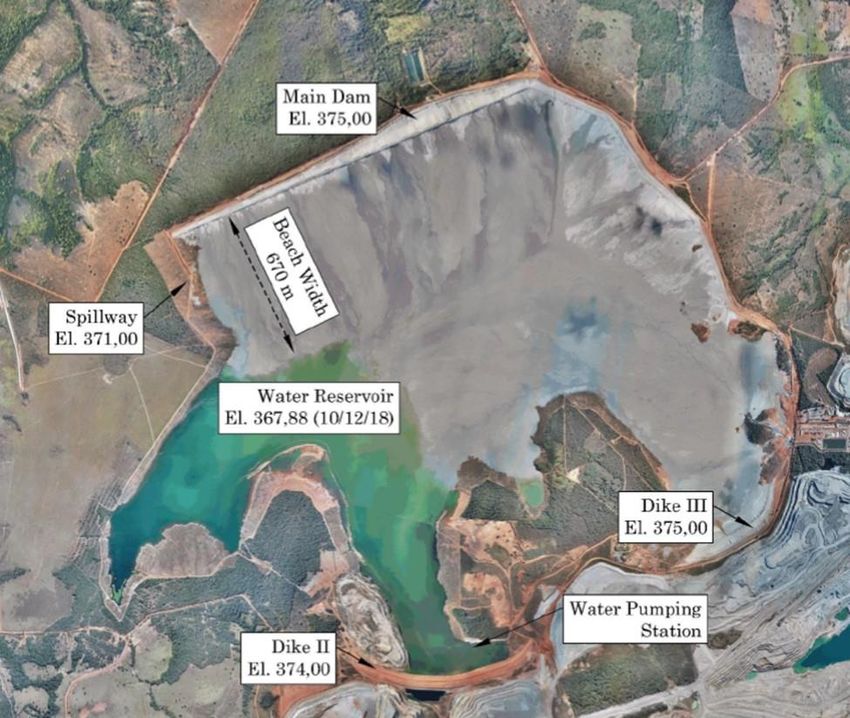
Candelaria
Increasing Production Profile
•    2019 copper production increased 9% year-on-year to 146,330 t                                              Copper Production & Cash Cost Outlook
                                                                                                                   (100% basis; kt & $/lb Cu, net of by-product credits)
•    positioned to deliver a further 16% copper production increase in 2020, at reduced
     cash costs, as benefits of reinvestment initiatives are realized
•    copper production is forecast to average approximately 180,000 tpa over the ten-year                                                                               185-195                Avg. +190
     period 2020 through 2029, including +190,000 tpa 2022 through 2025

                                                                                                                                               165-175

Capital Reinvestment
Projects Nearing Completion
                                                                                                                          146
 •   South Sector underground mine
     successfully transferred to
     operations ahead of schedule in
     Q3/19
 •   mill optimization project forecast                                                                                           1
                                                                                                                        $1.60
     to be complete in Q1/20
                                                                                                                                                 $1.45
 •   mine fleet reinvestment 99%
     complete with two remaining
     pieces to be delivered in 2021                                                                                    2019A                      2020                    2021                2022-2025
                                                                                                                                                                                                                 2

     and 2022

                                                                                                           Currently, 68% of Candelaria’s total gold and silver production are subject to a streaming agreement and as such C1
                                                                                                           cash costs guidance is based on receipt of $408/oz and $4.08/oz, respectively, in 2019 and $412/oz and $4.12/oz,
                                                                                                           respectively, in 2020 on the streamed portion of gold and silver sales.

                                                                                                           1.    2019 cash cost is guidance; production is reported actual.
                                                   Candelaria Ball Mill 2 motor replacement during Q4/19   2.    Average 2022-2025 production is based on the NI 43-101 Technical Reports dated November 28, 2018 which is
                                                                                                                 available on SEDAR under the Company’s profile page. See also slide 32.

                                                                                                                                                                                                                                 7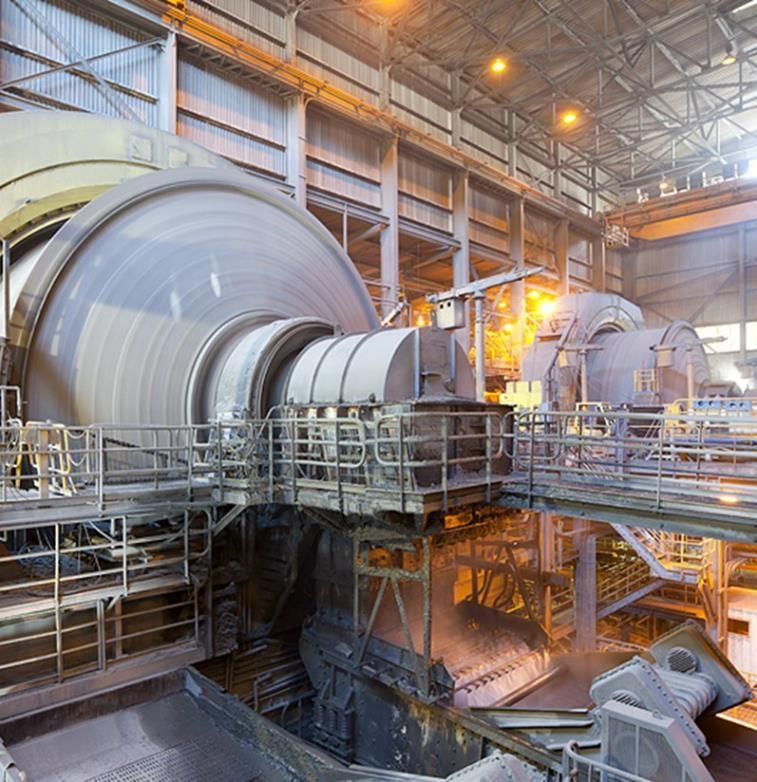
Chapada
Strong First Quarters Under Lundin Mining Ownership
•       copper production exceeded and gold production achieved 2019 guidance
                                                                                                                                                           Copper, Gold Production & Cash Cost Outlook
                                                                                                                                                               (100% basis; kt Cu, koz Au & $/lb Cu, net of by-product credits)
•       forecast annual copper production to be between 51,000 t and 56,000 t over the next
        three years based on the current 24 Mtpa throughput rate and mine plan
                                                                                                                                                                                                            90-95
•       annual gold production is forecast to be between 70,000 oz and 95,000 oz over the
        same period. The Chapada acquisition has materially increased the Company’s
        unstreamed gold production                                                                                                                                                                                                                            75-80
                                                                                                                                                                                                                                     70-75

Significant Increase in Exploration Underway                                                                                                                                         54           51-56                    51-56                    51-56
    •    increased exploration
         efforts are underway,
         largely focused on
         near-mine targets                                                                                                                                                  31

    •    $10M program in 2020
         including an expanded                                                                                                                                                 $0.80
                                                                                                                                                                                        2               $1.15
         50,000 m drill program
    •    advancing options for
         mine and plant                                                                                                                                                       2019A
                                                                                                                                                                                          1
                                                                                                                                                                                                        2020                     2021                      2022
         expansion in parallel
         with exploration
                                                                                                                                                                                                             Copper              Gold

                                                                                                                          Chapada processing facilities   1.   2019 production based on period of Lundin Mining’s ownership post closing of acquisition on July 5, 2019 (approximately half year).
                                                                                                                                                          2.   2019 cash cost is guidance; production is reported actual.

1. Refer to Press Release “Lundin Mining Announces 2019 Mineral Resource and Reserve Estimates” dated September 5, 2019 and “Technical Report on the
   Chapada Mine, Goiás State, Brazil” dated October 10, 2019. See also slide 32.

                                                                                                                                                                                                                                                                                       8
Chapada Production Profile1,2
120
100
Metal Production
80
60
40
20
0
2019A
2020
2023
2026
2027
2030
2033
2036
2037
2040
2043
2044
2046
2047
2050
2021
2022
2024
2025
2028
2029
2031
2032
2034
2035
2038
2039
2041
2042
2045
2048
2049
Copper (kt) Gold (koz)
1. Production shown is based on the NI 43-101 Technical Report dated October 10, 2019, available on the Company’s website and SEDAR under the Company’s profile page. See also slide 32.
2. 2019 production based on period of Lundin Mining’s ownership post closing of acquisition on July 5, 2019
9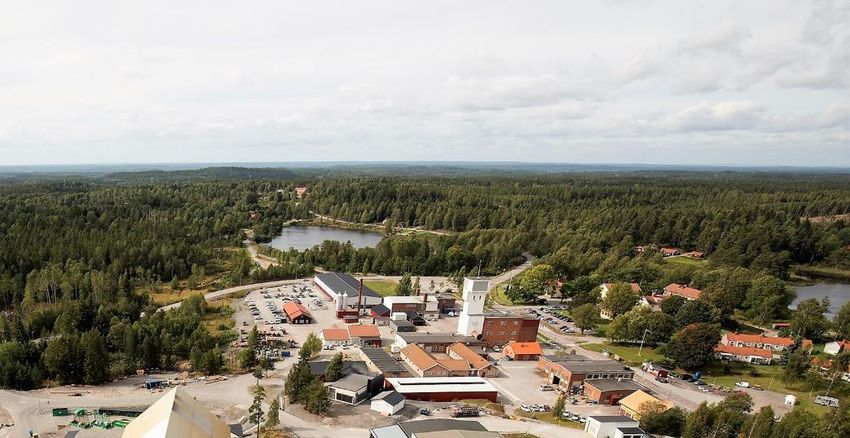
Chapada Near-Mine Exploration

         Near Mine Deposits                                                              Jatobá +
                 Chapada                                                                Buriti Norte
                 Sucupira/Cava Norte
                 Baruzinho
                 Baru/Baru NE
                SW Mina
                 Interpit
                Corpo Sul
                Santa Cruz
                Buriti
                Hidrotermalito
                Buriti Norte

                                                                          Sucupira SW

                                                 Corpo Sul / Santa Cruz

       Chapada deposits and near-mine exploration targets                                              10
Neves-Corvo
Increasing Zinc Production Profile
• achieved 2019 copper and zinc production guidance
• 2020 zinc production is forecast to increase 37% over 2019 production as the ZEP is Copper, Zinc Production & Cash Cost Outlook
commissioned and ramped-up during the year (kt & $/lb Cu, net of by-product credits)
• zinc production forecast to increase a further 30% in 2021 over 2020 with the ZEP
contributing a full year of production
155-160 155-160
Zinc Expansion Project (ZEP) Advancing
• on schedule and budget 95-105
for phased start-up and
production ramp-up in
2020 73
• phased ramp-up targets
commissioning the new 41 38-43 41-46 41-46
SAG mill in Q1/20 with first
ore in Q2/20 1
$1.60 $1.80
• preparation for first
commissioning of surface
process equipment 2019A 2020 2021 2022
initiated in Q4/19
Copper Zinc
1. 2019 cash cost is guidance; production is reported actual.
New ZEP mill and flotation buildings in foreground – January 2020
11Neves-Corvo – ZEP
Underground Construction Progress
• development of lower stopes well underway with first two sublevel accesses continuing
• installation of 3.5 km of underground conveyor systems well advanced
• underground jaw crusher installation nearing completion
• first phase of the hoisting shaft upgrade completed with installation of higher capacity skips and rope
Underground construction – December 2019
Installation of Transfer Station 3 ongoing Crusher chamber – rock breaker and hopper New skips and hoisting rope installed
12Neves-Corvo – ZEP
Surface Construction Progress
work continued with focus on:
• mechanical, electrical and instrumentation installation of materials handling system • backfill cyclone station piping installation
• SAG mill motor and hopper installation • tailings and water supply piping systems
• flotation and SAG mill building piping installation • new zinc filtration building steel and transfer tower steel works
Surface construction photos – December 2019
SAG mill motor and hopper installation New flotation building piping installation New filtration building and transfer tower steel works
13Eagle
Consistent Operating Performance
• achieved 2019 production guidance for both nickel and copper
• 2020 nickel production to increase more than 3,000 t (22%) over 2019, at reduced cash Nickel, Copper Production & Cash Cost Outlook
costs, as higher-grade Eagle East ore contributes to the mill feed (kt & $/lb Ni, net of by-product credits)
• copper production expected to increase more than 2,200 t (15%) in 2020
17-20
Successful Eagle East Development
15-18 15-18
15-18 15-18
• first Eagle East ore 14-17
mined in Q3/19 and 14
processed in Q4/19 13
• mine development
continued in Q4/19
allowing for full
access to the higher- $2.60
1
grade ores in 2020
$1.00
2019A 2020 2021 2022
Nickel Copper
1. 2019 cash cost is guidance; production is reported actual.
Eagle East – January 2020
14Zinkgruvan
Improved Mine & Mill Performance
• 2019 production of 78,313 t zinc and 2,906 t of copper achieved guidance for both metals
Zinc Production & Cash Cost Outlook
• zinc, lead and copper production were greater year-on-year in 2019 as a result of (kt & $/lb Zn, net of by-product credits)
sustained improvement in metal recovery and zinc ore head grades
• production of zinc in 2020 is expected to be similar to 2019, while copper production is
forecast to increase to 3,000 - 4,000 t
77-82
78
72-77
69-74
Focused Exploration Program
• exploration continued on
Dalby and Flaxen $0.55
• $15M exploration program 1
$0.40
planned in 2020 includes
50,000 m of drilling
• aimed at increasing and
upgrading Mineral
Resources at Dalby and
existing orebody extensions
2019A 2020 2021 2022
1. 2019 cash cost is guidance; production is reported actual.
Zinkgruvan mine Isometric
152020 Capital & Exploration Expenditure Guidance
Capital Expenditures1 Aggressive In and Near-Mine Exploration
• Candelaria capital expenditures to decrease compared to • $65M to be invested in 2020 in exploration programs
2018 & 2019 reinvestment years as low-risk initiatives to
increase value of operation are completed • over 210,000 m of planned drilling
• Neves-Corvo capital expenditures estimated to total $230M • $20M at Candelaria focused on increasing Española open pit and extending
in 2020, of which $155M is remaining pre-production capital underground mine lives
for ZEP • $15M at Zinkgruvan aimed at increasing Mineral Resources at Dalby
• $10M at Chapada including an expanded 50,000 m drill program
Sustaining Capital
Candelaria (100% basis) 265
Chapada3 60
Eagle 15
Neves-Corvo 75
Zinkgruvan 50
Total Sustaining 465
ZEP (Neves-Corvo) 155
Total Capital Expenditures2 $620M
Zinkgruvan – 2019 drilling program
1. During the production phase, waste stripping costs which provide probable future economic benefits and improved access to the orebody are capitalized to mineral properties. The Company capitalizes waste costs when experienced strip ratios are above the average planned strip ratio for each open
pit phase under development.
2. Excludes capitalized interest. Amounts forecast above are on a cash basis and may vary from accrual based estimates. 16
3. Estimated capital expenditures also include amounts for discretionary exploration land acquisitions which will be dependent on the availability of desired areas and whether agreement can be made with owners.Lundin Mining
High Quality Meaningful Scale
Financial Strength
Competitive Mines Growth Oriented
• strong margins at all operations • materially increasing copper and zinc • proven track record for rigorous investment
production profile approach, focused on value creation
• demonstrated operational excellence and
culture of continuous improvement • exploration upside and high-value • strong balance sheet with low leverage
expansion projects underway
• low-risk mining jurisdictions
17Appendices
18Responsible Mining
We recognize the important role of the metals we produce and are committed to mining these metals responsibly
We demonstrate this commitment through living our core values of Safety, Respect, Integrity and Excellence in all aspects of our decision-making
Lundin Mining has been reporting on our sustainability performance in a comprehensive, standalone document since 2011
https://www.lundinmining.com/responsible-mining/sustainability-reports/
19Candelaria Complex – Mineral Resources and Mineral Reserves1
Ownership 80%
Location Region III, Chile
Mine life 22 years
2020 exploration budget $20M
P&P Copper Mineral Reserves 3,604 kt contained (663,696 kt at 0.5%)
M&I Copper Mineral Resources 6,495 kt contained (998,635 kt at 0.7%)
Inferred Copper Mineral Resources 534 kt contained (67,354 kt at 0.8%)
P&P Gold Mineral Reserves 2.7 Moz contained (663,696 kt at 0.1 g/t)
M&I Gold Mineral Resources 4.9 Moz contained (998,635 kt at 0.2 g/t)
Inferred Gold Mineral Resources 0.3 Moz contained (67,354 kt at 0.3 g/t)
P&P Silver Mineral Reserves 37 Moz contained (663,696 kt at 2 g/t)
M&I Silver Mineral Resources 66 Moz contained (998,635 kt at 2 g/t)
Inferred Silver Mineral Resources 3.9 Moz contained (67,354 kt at 2 g/t)
1. For more information please refer to the Company’s Technical Report for the Candelaria Copper
Mining Complex, November 28, 2018 and the Company’s news release dated September 5, 2019
entitled “Lundin Mining Announces 2019 Mineral Resource and Reserve Estimates” on the
Company’s website (www.lundinmining.com). See also slide 32.
Candelaria Copper Mining Complex 20Candelaria Copper Production Profile1 (kt)
190 190 192 194
184 185
175 175 171 175
167
156 160
152 151
146 146
135 136
114
96
84
69
45
10
2016A 2017A 2018A 2019A 2020 2021 2022 2023 2024 2025 2026 2027 2028 2029 2030 2031 2032 2033 2034 2035 2036 2037 2038 2039 2040
December 2018 Technical Report December 2017 Technical Report At Purchase - October 2014 Techncial Report
Contained copper in the Mineral Reserve estimate2 has increased by 109%3 and the production profile significantly improved since acquisition
1. Production shown on 100% basis and is based on the NI 43-101 Technical Reports dated November 28, 2018, November 30, 2017, and October 6, 2014 copies of which is are available on SEDAR under the Company’s profile page. See also slide 29.
2. Refer to Press Release “Lundin Mining Announces 2019 Mineral Resource and Reserve Estimates” dated September 5, 2019. See also slide 32.
3. Mine depletion included.
21Candelaria Mine Fleet Reinvestment
Significantly Increased Production Profile and Extended Mine Life
on Exploration Success
• 20-year LOM when the open pit began production in 1994; most open pit equipment
dated back to when operation opened
• Mineral Reserve estimate now supports mine life to beyond 2040
New Equipment to Increase Haulage Capacity and Efficiency
• 38 new latest generation CAT 793F trucks which are faster, have larger capacity and
lower operating costs
First New Candelaria Haul Truck
• change to hydraulic shovels in backhoe configuration
High-Return Investment
• in excess of 20% IRR expected
• $220M total investment essentially complete
New Candelaria Excavators
22Candelaria Mill Optimization Project
Low-Risk Investments to Increase Metal Production, Reduce
Costs and Improve Safety
• primary crusher motor upgrade
• ball mill re-powering; pebble circuit upgrade; cyclone and feed pump upgrades
• flotation circuit upgrades
• front-end desalination plant and pipeline improvements
Throughput Capacity Forecast to Increase ~4ktpd and Copper
Recovery by ~1.7%
High-Return Initiatives
• in excess of 20% IRR expected
• $80M total investment; $15M planned in 2020 to complete the project
• on track for completion in Q1/20
Candelaria Mill
23Candelaria Underground Mine Expansions
Significant Underground Exploration Success Under Lundin Mining Ownership
• total estimated Candelaria underground Mineral Reserves1 now 148.2Mt at 0.85% copper
• Candelaria North and South Sectors continues to show significant exploration potential
Increasing Underground Production Rates
• permitted to expand Candelaria underground from 6ktpd to 14ktpd
South Sector in Production Ahead of Schedule
• South Sector successfully transitioned to operations team in Q3/19
• aim to operate both mines to ensure meeting the maximum combined
permitted limit of 14,000 tpd
Candelaria Underground Sectors
1. Refer to Press Release “Lundin Mining Announces 2019 Mineral Resource and Reserve Estimates” dated September 5, 2019. See also slide 32.
24Chapada – Mineral Resources and Mineral Reserves1
Ownership 100%
Location Goiás State, Brazil
Mine life 31 years
2020 exploration budget $10M
P&P Copper Mineral Reserves 1,757 kt contained (738,789 kt at 0.24%)
M&I Copper Mineral Resources 2,590 kt contained (1,090,829 kt at 0.23%)
Inferred Copper Mineral Resources 360kt contained (162,769 kt at 0.22%)
P&P Gold Mineral Reserves 4.6 Moz contained (803,984 kt at 0.18g/t)
M&I Gold Mineral Resources 5.9 Moz contained (1,238,346 kt at 0.19 g/t)
Inferred Gold Mineral Resources 0.6 Moz contained (175,334 kt at 0.11 g/t)
1. For more information please refer to the Company’s news release dated September 5, 2019
entitled “Lundin Mining Announces 2019 Mineral Resource and Reserve Estimates” on the
Company’s website (www.lundinmining.com). See also slide 32.
Chapada deposits and near-mine exploration targets
25Chapada – General Overview
Alto
• located in northern Goiás State
Horizonte
• 270 km northwest of national capital of Brasilia
and 320 km north of state capital of Goiânia
• supported by road access with good connections
to the local and national road network
• average elevation of approximately 300 masl
• low rolling hills with large contiguous flat areas
• tropical climate with two well defined seasons:
− rainy season from November to March
− dry season from April to October
• Alto Horizonte, the closest town, has a population
of roughly 5,800 people
• local economic activity is mainly agropastoral.
Some small scale gold and clay mining activities in
area
Chapada • ± 750 employees and 1,300 contractors
• 10% of the workforce is female
• majority of the workforce is between 26 to 35
years old (42%) and 36 to 45 years old (32%)
Source: Google Earth
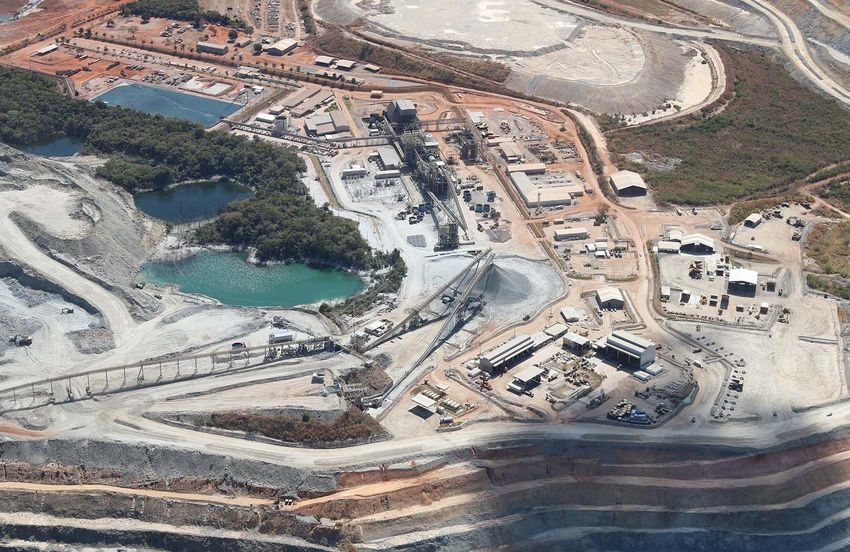
26Chapada Processing Facilities Overview
Conventional Crush, Grind, Float
Processing
Plant • single-line plant to treat sulphide ores
Plant
Facilities • current capacity of 65,000 tpd or 24.0 Mtpa
• produces a high-quality gold-rich copper
Mine concentrate
Power Facilities • in 2018 the mill:
Substation
ROM Ore − processed 22.9 Mt of ore
Stockpile Crushed Ore − average copper recovery of 82.4%
Stockpile
− average gold recovery of 63.3%
MMD − average concentrate grade of 24.1%
Crusher copper and 15.5 g/t gold
In-Pit Crusher
Conveyor Belt
Jaw
Crusher
Aerial photograph of Chapada mine processing facilities
27Chapada Tailings Storage Facility (TSF)
• TSF is located northwest of Chapada open pit
• all dams raised by centerline methods Main
• Main Dam and Dyke III comprise compacted earth Dam
fill starter dams raised with cyclone tailings
• Dyke II is a compacted earth fill dam for water
retention
• Main Dam is currently at an elevation of 376 masl
• current permitted capacity for approximately 2.5
years at the current production rate of 24.0 Mtpa
• design underway to raise and permit to 382 masl Spillway
• conceptual designs to raise to 398 masl to provide
additional storage capacity
Water Reservoir
• video monitoring and alarm system in place (10/12/18)
Dyke III
Water Pumping
Station
Dyke II
Chapada Tailings Storage Facility 28Eagle Mine – Mineral Resources and Mineral Reserves1
Ownership 100%
Location Michigan, USA
Mine life 5 years
P&P Nickel Mineral Reserves 108 kt contained (4,119 kt at 2.6%)
M&I Nickel Mineral Resources 132 kt contained (4,022 kt at 3.3%)
P&P Copper Mineral Reserves 91 kt contained (4,119 kt at 2.2%)
M&I Copper Mineral Resources 109 kt contained (4,022 kt at 2.7%)
Inferred Nickel Mineral Resources 12 kt contained (549 kt at 2.2%)
Inferred Copper Mineral Resources 8 kt contained (549 kt at 1.6%)
1. For more information please refer to the Company’s Technical Report on the Eagle Mine dated
April 26, 2017 and the Company’s news release dated September 5, 2019 entitled “Lundin Mining
Announces 2019 Mineral Resource and Reserve Estimates” on the Company’s website
(www.lundinmining.com). See also slide 32.
Eagle Mine
29Neves-Corvo – Mineral Resources and Mineral Reserves1
Ownership 100%
Location Alentejo region, Portugal
Mine life +10 years
2020 exploration budget $10M
P&P Zinc Mineral Reserves 2,214 kt contained (29,669 kt at 7.5%)
M&I Zinc Mineral Resources 4,958 kt contained (71,444 kt at 6.9%)
Inferred Zinc Mineral Resources 223 kt contained (3,828 kt at 5.8%)
P&P Copper Mineral Reserves 623 kt contained (27,917 kt at 2.2%)
M&I Copper Mineral Resources 1,427 kt contained (61,699 kt at 2.3%)
Inferred Copper Mineral Resources 229 kt contained (12,945 kt at 1.8%)
Inferred Semblana Copper Mineral Resources 223 kt contained (7,807 kt at 2.9%)
1. For more information refer to the NI 43-101 Technical Report for the Neves-Corvo Mine,
Portugal dated June 23, 2017 and the Company’s news release dated September 5, 2019 entitled
Schematic of Neves-Corvo Mine highlighting ZEP development and mining areas “Lundin Mining Announces 2019 Mineral Resource and Mineral Reserve Estimates” on the
Company’s website (www.lundinmining.com). See also slide 32.
30Zinkgruvan – Mineral Resources and Mineral Reserves1
Ownership 100%
Location Askersund, Sweden
Mine life +10 years
2020 exploration budget $15M
P&P Zinc Mineral Reserves 803 kt contained (10,816 kt at 7.4%)
M&I Zinc Mineral Resources 1,633 kt contained (20,275 kt at 8.1%)
Inferred Zinc Mineral Resources 1,381 kt contained (19,785 kt at 7.0%)
P&P Copper Mineral Reserves 55 kt contained (2,736 kt at 2.0%)
M&I Copper Mineral Resources 105 kt contained (4,632 kt at 2.3%)
Inferred Copper Mineral Resources 6 kt contained (293 kt at 2.1%)
1. For more information please refer to the Company’s Technical Report entitled NI 43-
101 Technical Report for the Zinkgruvan Mine, Central Sweden dated November 30,
2017 and the Company’s news release dated September 5, 2019 entitled “Lundin
Mining Announces 2019 Mineral Resource and Reserve Estimates” on the Company’s
website (www.lundinmining.com). See also slide 32.
Zinkgruvan Mine
31NI 43-101 Compliance
Unless otherwise indicated, Lundin Mining Corporation (the “Company”) has prepared the technical information in this presentation including Mineral Reserve and Mineral Resource estimates (“Technical
Information”) based on information contained in the technical reports and news releases (collectively the “Disclosure Documents”) available under the Company’s profile on SEDAR at www.sedar.com. Each
Disclosure Document was prepared by or under the supervision of a qualified person (“Qualified Person”) as defined in National Instrument 43-101 – Standards of Disclosure for Mineral Projects of the
Canadian Securities Administrators (“NI 43-101”). For readers to fully understand the information in this presentation, they should read the technical reports identified below in their entirety, including all
qualifications, assumptions and exclusions that relate to the information set out in this presentation which qualifies the Technical Information. Readers are advised that Mineral Resource estimates that
are not Mineral Reserves do not have demonstrated economic viability. The Disclosure Documents are each intended to be read as a whole, and sections should not be read or relied upon out of context.
The Technical Information is subject to the assumptions and qualifications contained in the Disclosure Documents.
The Technical Information in this presentation has been prepared in accordance NI 43-101 and has been reviewed and approved by Stephen Gatley, BSc (Eng), C.Eng. Vice President - Technical Services of
the Company, a "Qualified Person" under NI 43-101. Mr. Gatley has verified the data disclosed in this presentation and no limitations were imposed on his verification process.
Mineral Resource and Mineral Reserve estimates of the Company are shown on a 100 percent basis for each mine. The Measured and Indicated Mineral Resource estimates are inclusive of those Mineral
Resource estimates modified to produce the Mineral Reserve estimates. All estimates of the Company are prepared as at June 30, 2019. Estimates for all operations are prepared by or under the
supervision of a Qualified Person as defined in NI 43-101 or have been audited by independent Qualified Persons on behalf of the Company.
Mineral Resources at Candelaria are estimated using metal prices of US$3.16/lb copper and US$1,000/oz gold and an exchange rate of USD/CLP 600. Mineral Reserves at Candelaria were estimated using
metal prices of US$2.75/lb copper and US$900/oz gold and an exchange rate of USD/CLP 600. Mineral Resources at Chapada and Suruca SW copper-gold are estimated using metal prices of US$4.00/lb
copper and US$1,600/oz gold and an exchange rate of USD/BRL 3.95. For the Suruca gold only Mineral Resource estimates at Chapada a gold price of $1,500/oz has been used and an exchange rate of
USD/BRL 3.50. Mineral Reserves at Chapada were estimated using metal prices of US$3.00/lb copper and US$1,250/oz gold and an exchange rate of USD/BRL 3.95. Mineral Resource for Neves-Corvo and
Semblana have been estimated using metal prices of US$2.75/lb copper and US$1.00/lb zinc and an exchange rate of EUR/USD 1.25. The Semblana Mineral Resource has been reported using the same
metal prices and exchange rates as Neves-Corvo. Mineral Resources and Mineral Reserves at Zinkgruvan have been estimated using metal prices of US$2.75/lb copper, US$1.00/lb zinc and US$1.00/lb lead
and an exchange rates of USD/SEK 7.00. Mineral Resources and Mineral Reserves at Eagle and Eagle East have been estimated using metal prices of US$2.75/lb copper and US$8.00/lb nickel. Refer to the
Company’s news release dated September 5, 2019 entitled “Lundin Mining Announces 2019 Mineral Resource and Reserve Estimates” on the Company’s website (www.lundinmining.com).
For further Technical Information on the Company’s material properties, refer to the following technical reports, each of which is available on the Company’s SEDAR profile at www.sedar.com:
Candelaria: technical report entitled Technical Report for the Candelaria Copper Mining Complex, Atacama Region, Region III, Chile dated November 28, 2018.
Chapada: technical report entitled Technical Report on the Chapada Mine, Goiás State, Brazil dated October 10, 2019
Neves-Corvo: technical report entitled NI 43-101 Technical Report for the Neves-Corvo Mine, Portugal dated June 23, 2017.
Zinkgruvan: technical report entitled NI 43-101 Technical Report for the Zinkgruvan Mine, Central Sweden dated November 30, 2017.
Eagle Mine: technical report entitled Technical Report on the Eagle Mine, Michigan, U.S.A. dated April 26, 2017.
32www.lundinmining.com | TSX: LUN | Nasdaq Stockholm: LUMI
You can also read