Corporate Presentation - June 2020 - Lundin Mining Corporation
←
→
Page content transcription
If your browser does not render page correctly, please read the page content below
Corporate Presentation
                                         June 2020

TSX: LUN Nasdaq Stockholm: LUMI                            Candelaria, Atacama Region, Chile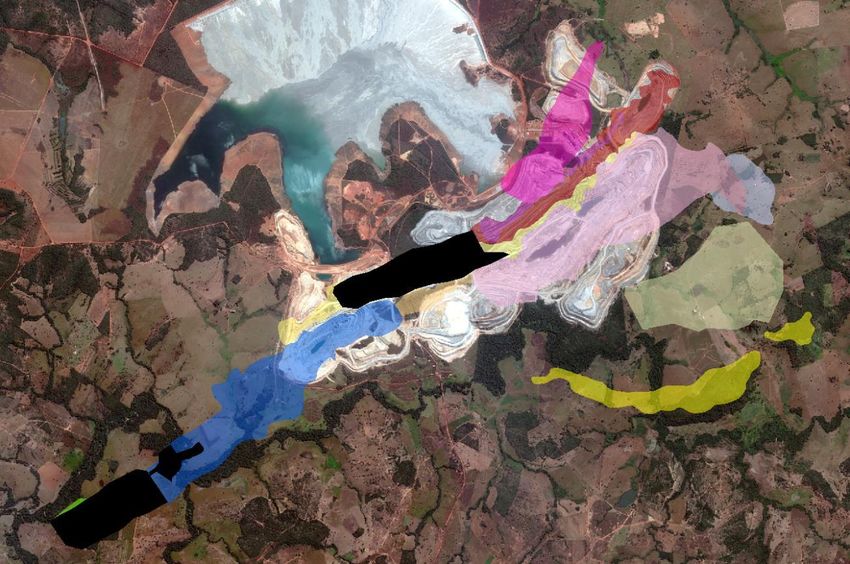
Cautionary Statements
Caution Regarding Forward-Looking Information and Non-GAAP Performance Measures
This document contains “forward-looking information” within the meaning of Canadian securities laws. All statements other than statements of historical facts constitute forward-looking
information, including but not limited to statements regarding plans, prospects and business strategies; timing and amount of future production; expectations regarding the results of operations
and costs; permitting requirements and timelines; timing and possible outcome of pending litigation; the results of economic studies or Mineral Resource and Mineral Reserve estimations, life of
mine estimates, and mine and mine closure plans; market prices of metals, currency exchange rates, and interest rates; the ability to comply with permitting or other regulatory requirements;
anticipated exploration and development activities; and the integration and benefits of acquisitions. Words such as “believe”, “expect”, “anticipate”, “contemplate”, “target”, “plan”, “goal”, “aim”,
“intend”, “continue”, “budget”, “estimate”, “may”, “will”, “can”, “could”, “should”, “schedule” and similar expressions identify forward-looking statements. Forward-looking information is necessarily
based upon various assumptions including, without limitation, the expectations and beliefs of management, including that the Company can access financing, equipment and labour; assumed
and future price of metals; anticipated costs; ability to achieve goals; the effective integration of acquisitions; the political environment supporting mining projects; and assumptions related to the
factors set forth below. While these factors and assumptions are considered reasonable by Lundin Mining as at the date of this document in light of management’s experience and perception of
current conditions and expected developments, these statements are inherently subject to significant business, economic and competitive uncertainties and contingencies. Known and unknown
factors could cause actual results to differ materially from those projected. Such factors include, but are not limited to: volatility in commodity prices; global financial conditions; risks inherent in
mining including but not limited to the environment, industrial accidents, catastrophic equipment failures, unexpected geological formations or unstable ground conditions, and natural
phenomena; uninsurable risks; equity markets volatility; outbreaks of viruses and infectious diseases (such as COVID-19); negative publicity and reputation risks; reliance on a single asset; fraud
and corruption risks; actual ore mined and/or recoveries varying from estimates; risks associated with the estimation of Mineral Resources and Mineral Reserves and the geology, grade and
continuity of mineral deposits; ore processing efficiency; foreign country and emerging markets risks; security; taxation regimes; health and safety risks; exploration, development or mining
results not being consistent with expectations; infrastructure risks; counterparty and credit risks and customer concentration; environmental regulation risks; exchange rate fluctuations;
stakeholder opposition; civil disruption; labour disputes or difficulties; interruptions in production; uncertain political and economic environments; litigation; regulatory investigations,
enforcement and/or sanctions; structural stability of waste rock dumps or tailings storage facilities risks; changes in laws or policies; climate change; cybersecurity risks; estimates of future
production, operations, capital and operating cash and all-in sustaining costs; permitting risks; compliance with laws; mine closure risks; challenges to title; the price/availability of supplies or
services; liquidity risks and limited financial resources; the estimation of asset carrying values; risks relating to dividends; and other risks and uncertainties, including but not limited to those
described in the “Risk and Uncertainties” section of the Annual Information Form and the “Managing Risks” section of the Company’s MD&A for the year ended December 31, 2019, which are
available on SEDAR at www.sedar.com under the Company’s profile. All of the forward-looking statements made in this document are qualified by these cautionary statements. Although the
Company has attempted to identify important factors that could cause actual results to differ materially from those contained in forward-looking information, there may be other factors that
cause results not to be as anticipated, estimated, forecast or intended and readers are cautioned that the foregoing list is not exhaustive of all factors and assumptions which may have been
used. Should one or more of these risks and uncertainties materialize, or should underlying assumptions prove incorrect, actual results may vary materially from those described in forward-
looking information. Accordingly, there can be no assurance that forward-looking information will prove to be accurate and forward-looking information is not a guarantee of future performance.
Readers are advised not to place undue reliance on forward-looking information. The forward-looking information contained herein speaks only as of the date of this document. The Company
disclaims any intention or obligation to update or revise forward‐looking information or to explain any material difference between such and subsequent actual events, except as required by
applicable law.

This presentation may contains certain financial measures such as adjusted earnings, adjusted loss, EBITDA, net cash, net debt, adjusted operating cash flow per share, co-product cash costs and
cash costs which have no standardized meaning within generally accepted accounting principles under IFRS and therefore amounts presented may not be comparable to similar data presented
by other mining companies. This data is intended to provide additional information and should not be considered in isolation or as a substitute for measures or performance prepared in
accordance with IFRS.

Note: All dollar amounts are in US dollars unless otherwise denoted.
                                                                                                                                                                                                         2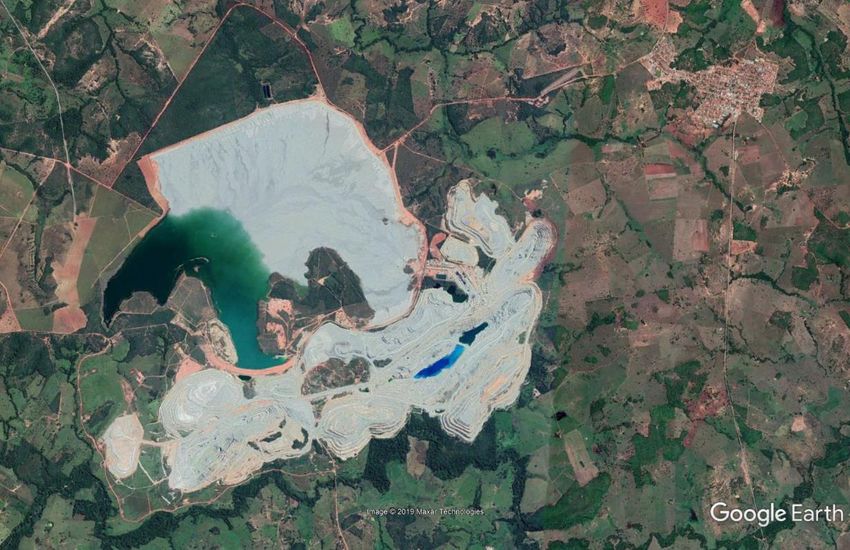
Lundin Mining
Our Strategy
Operate, upgrade and grow a base metals
portfolio that provides leading returns for our
shareholders throughout the cycle

 •   copper dominant
 •   competitive cost position
                                                                                                 Eagle                                             Zinkgruvan
 •   low-risk mining jurisdictions,                                                    Nickel-Copper-PGMs in U.S.A.                           Zinc-Lead-Copper in Sweden
     leverage current geographies
 •   pipeline of development and
     exploration projects
 •   maintain low leverage and flexible
     balance sheet while increasing
     direct shareholder returns

                                                                                                                                                  Neves-Corvo
                                                                                                                                              Copper-Zinc-Lead in Portugal

                                                                Candelaria1
                                                          Copper-Gold-Silver in Chile                                    Chapada
                                                                                                                      Copper-Gold in Brazil

                                          1. Lundin Mining holds an 80% interest in Candelaria                                                                               3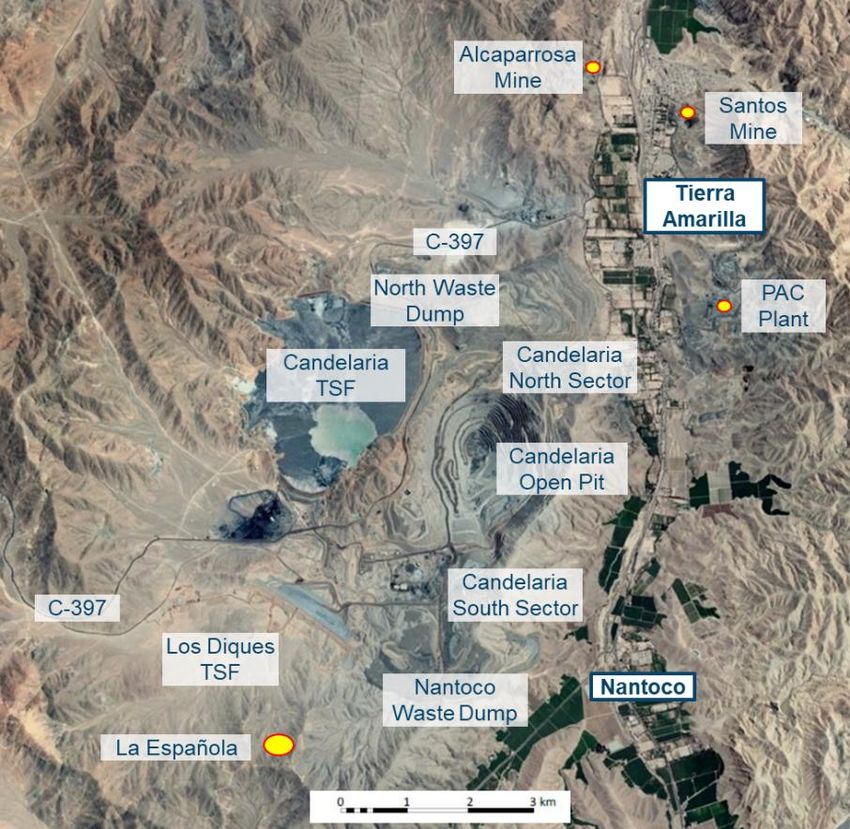
Responsible Mining
Social & Environmental                                                               Safety
•   strong stakeholder engagement and increased social investment                    •    overall safety performance continues to trend better
•   robust risk and compliance management programs in place                          •    2019 TRIF performance includes the successful integration of the Chapada
•   environmental footprint reduction goals set for water, dust and energy                mine and saw a significant increase in exposure hours with project
                                                                                          activities

COVID-19 Readiness & Response                                                            Total Recordable Injury Frequency
                                                                                         per 200,000 person hours worked
•   across Lundin Mining we continue to identify and implement measures to protect
    and ensure the needs of our workforce and communities are being addressed

                                                                                                  3.5

                                                                                            3.1

                                                                                                                2.5

                                                                                                                       2.0

                                                                                                         1.6                  1.6

                                                                                                                                     0.9

                                                                                                                                            0.6    0.6    0.7    0.7

                                                                                           2009   2010   2011   2012   2013   2014   2015   2016   2017   2018   2019

                                                                                                                                                                        4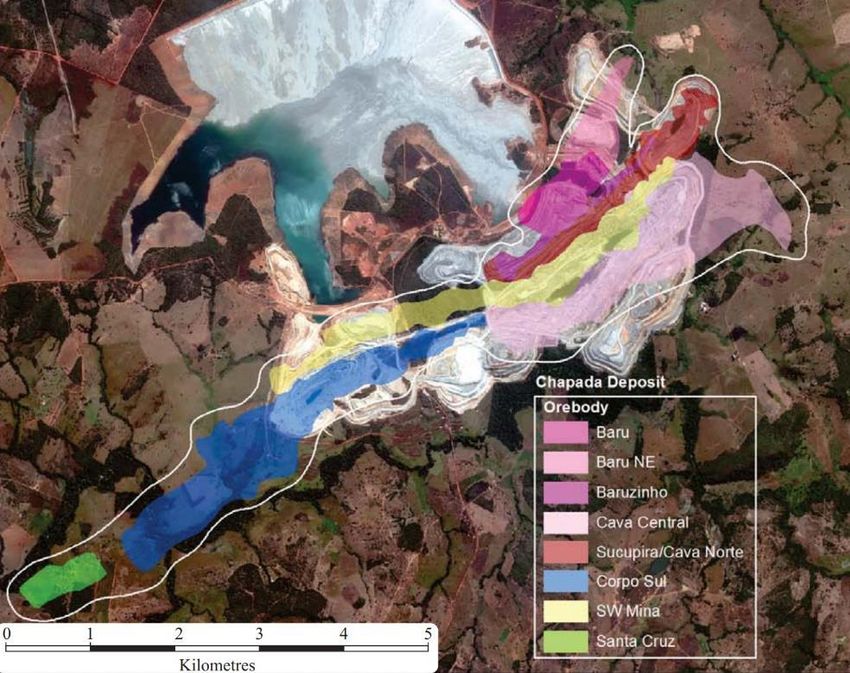
Increasing Production Profile1 (kt)

                                     Copper                                                                                                          Gold                                                                                                     Nickel

                                                                     294 - 318
                                                                                                                                                   175 - 190                    180 - 190

                                       264 - 293                                                                                                                                                                                                                 15 - 18                      15 - 18

                                                                                            +30%
                                                                                                                                                                                                                                        13

               235                                                                                                        142

                                                                                                                         2019A                         2020                         2021                                             2019A                         2020                         2021
             2019A                         2020                         2021

1. Production profile based on certain estimates and assumptions, including but not limited to; Mineral Resource and Mineral Reserve estimates geological formations, grade and continuity of deposits and metallurgical characteristics. The 2020-2021 guidance was announced by news release on November
   26, 2019, with 2020 guidance subsequently revised by news release on April 29, 2020. The 2019 production results were announced in the press release dated January 22, 2020. Copper production for 2019 reflects attributable production for the Chapada Mine under Lundin Mining ownership.
2. Gold production guidance for Candelaria is 90-100 koz in 2020 and 110-115 koz in 2021, on a 100% basis. Currently, 68% of Candelaria’s total gold and silver production are subject to a streaming agreement. This is to decrease to 40% for each gold and silver once a cumulative 720 koz of gold and 12 Moz
   of silver are delivered, respectively. Gold production guidance for Chapada is 85-90 koz in 2020 and 70-75 koz in 2021. Chapada’ s gold production is unencumbered.                                                                                                                                              5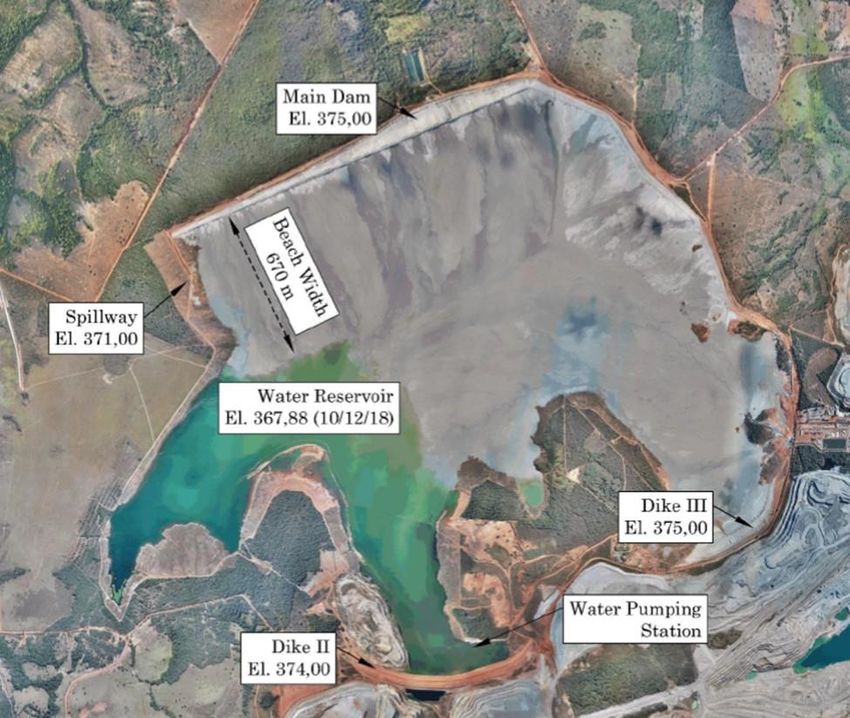
Q1/20 Summary Results

                                                                                    Production              Payable Sales
                                                                                    62,167 t of copper      61,923 t of copper

                                                                                    36,947 t of zinc        29,348 t of zinc

                                                                                    38,000 oz of gold       39,000 oz of gold

                                                                                    3,575 t of nickel       2,809 t of nickel

                                                                                    9,481 t of lead         7,322 t of lead

                                                                                       $378M in Sales by Metal
                                                                                                   Lead Other
                                                                                                         4%
                                                                                             Nickel 3%
                                                                                              6%
                                                                                       Zinc
                                                                                       8%

                                                                                                                Copper
                                                                                      Gold
                                                                                                                 64%
                                                                                      15%

                   Construction of new 1140 level service area in Zinkgruvan mine

                                                                                                                                 6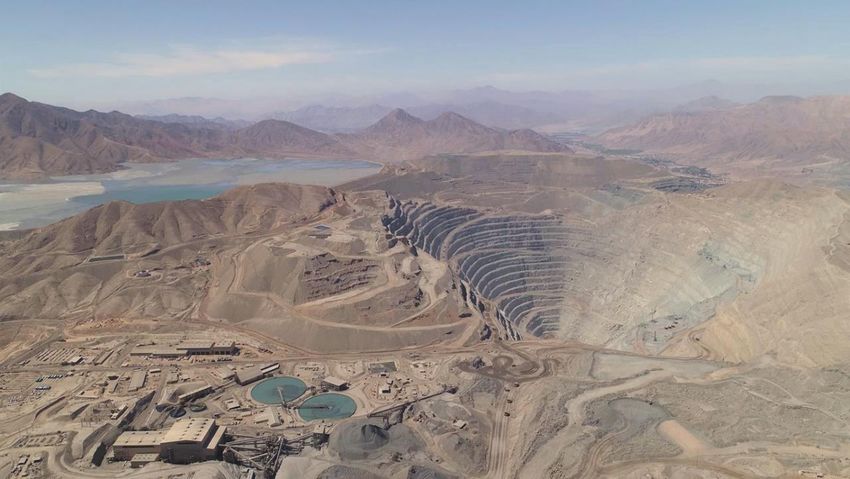
Candelaria
Increasing Production Profile
 •   Q1/20 production of 36,297 t of copper and approximately 21,000 oz of gold                                   Copper, Gold Production & Cash Cost1 Outlook
 •   $1.31/lb cash cost of copper benefited from favourable exchange rate3; full year                              (100% basis; kt Cu, koz Au & $/lb Cu, net of by-product credits)
     cash cost guidance improved to $1.35/lb of copper
 •   replacement of fourth ball mill motor under CMOP planned for H2/20                                                                                                                             Avg. +190
                                                                                                                                                                            185-195
 •   positioned to deliver approximately 15% copper production increase in 2020, at
                                                                                                                                                  160-175
     reduced cash costs, as benefits of reinvestment initiatives are realized
 •   copper production is forecast to average approximately 180,000 tpa over the ten-
     year period 2020 through 2029, including +190,000 tpa 2022 through 2025                                                146

                                                                                                                                                                                        110-115
Reduced Capital &                                                                                                                                                                                                Avg. +110
                                                                                                                                                               90-100
Exploration Expenditures
                                                                                                                                      88
 •   2020 sustaining capital expenditure
     guidance reduced to $230M, from $265M                                                                                     $1.54
                                                                                                                                                         $1.35
 •   exploration expenditure guidance
     lowered to $15M, from $20M
                                                                                                                                                                                                                             2
                                                                                                                              2019A                      2020                      2021                 2022-2025
 •   exploration deferral does not impact
     current 20-year mine life
                                                                                                                                                                   Copper             Gold
 •   over 50,000 m drilling planned

                                                                                                             1.    Currently, 68% of Candelaria’s total gold and silver production are subject to a streaming agreement and as such C1 cash costs
                                                                                                                   guidance is based on receipt of $412/oz and $4.12/oz, respectively, in 2020 on the streamed portion of gold and silver sales.
                                                                                                                   This streamed gold and silver production is to decrease to 40% for each once a cumulative 720 koz of gold and 12 Moz of silver
                                                                                                                   are delivered, respectively.
                                                                                                             2.    Average 2022-2025 production is based on the NI 43-101 Technical Reports dated November 28, 2018 which is available on
                                                                                                                   SEDAR under the Company’s profile page. See also slide 30.
                                                                                                             3.    Q1/20 average USD/CLP: 802 compared to assumption of 675 in previous guidance. Assumption revised to USD/CLP: 850 in
                                                                                                                   cash cost guidance announced by news release on April 29, 2020.
                                            Some of the measures implemented at Candelaria to protect our
                                                       workers health and safety (March 12 – May 18, 2020)                                                                                                                                7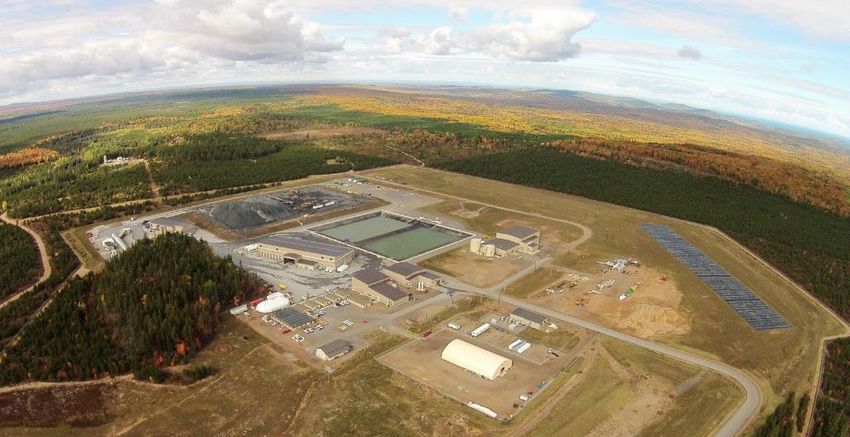
Chapada
Robust Mine and Mill Performance
 •      Q1/20 production of 11,881 t of copper and approximately 18,000 oz of gold
                                                                                                                                                                                    Copper, Gold Production & Cash Cost1 Outlook
                                                                                                                                                                                        (100% basis; kt Cu, koz Au & $/lb Cu, net of by-product credits)
 •      copper cash cost of $0.92/lb benefited from favourable exchange rate3 and gold price
 •      full year cash cost guidance improved to $0.85/lb of copper
 •      30-year mine life based on current Mineral Reserves4 and throughput rate of 24 Mtpa;                                                                                                                                       85-90
        near-mine exploration and expansion studies ongoing to optimize value and mine life
                                                                                                                                                                                                                                                                            75-80
                                                                                                                                                                                                                                                            70-75

Reduced Capital & Focused Exploration Expenditures
                                                                                                                                                                                                           54           51-56                     51-56             51-56
 •     2020 sustaining capital expenditure
       guidance reduced to $40M, from $60M,
       reflecting deferrals of small projects
       and reduction in capital stripping                                                                                                                                                         31
 •     exploration expenditure guidance
       lowered to $7M, from $10M
                                                                                                                                                                                                     $0.58                    $0.85
 •     over 40,000 m drilling planned
 •     expansion studies ongoing                                                                                                                                                                                2
                                                                                                                                                                                                    2019A                      2020                       2021         2022

                                                                                                                                                                                                                                    Copper                Gold

                                                                                 Chapada providing locally sourced food baskets, hygiene
                                                                                  products and educational games to local communities.

1.   Chapada cash costs are calculated on a by-product basis and do not include the effects of its copper stream agreements. Effects of the copper stream agreements are reflected in copper revenue and will impact realized price per pound.
2.   2019 production based on period of Lundin Mining’s ownership post closing of acquisition on July 5, 2019 (approximately half year).
3.   Q1/20 average USD/BRL: 4.46 and $1,583/oz gold compared to assumptions of 3.75 and $1,350/oz, respectively, in previous guidance. Assumptions revised to USD/BRL: 4.75 and $1,500/oz gold in guidance announced by news release on April 29, 2020.
4.   For more information please refer to the Company’s news release dated September 5, 2019 entitled “Lundin Mining Announces 2019 Mineral Resource and Reserve Estimates” on the Company’s website (www.lundinmining.com). See also slide 30.
                                                                                                                                                                                                                                                                                    8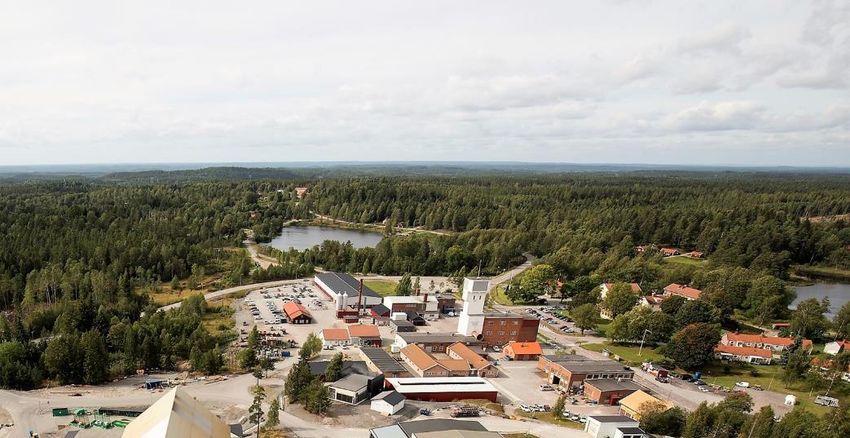
Chapada Near-Mine Exploration

         Near Mine Deposits                                                              Jatobá +
                 Chapada                                                                Buriti Norte
                 Sucupira/Cava Norte
                 Baruzinho
                 Baru/Baru NE
                SW Mina
                 Interpit
                Corpo Sul
                Santa Cruz
                Buriti
                Hidrotermalito
                Buriti Norte

                                                                          Sucupira SW

                                                 Corpo Sul / Santa Cruz

       Chapada deposits and near-mine exploration targets                                              9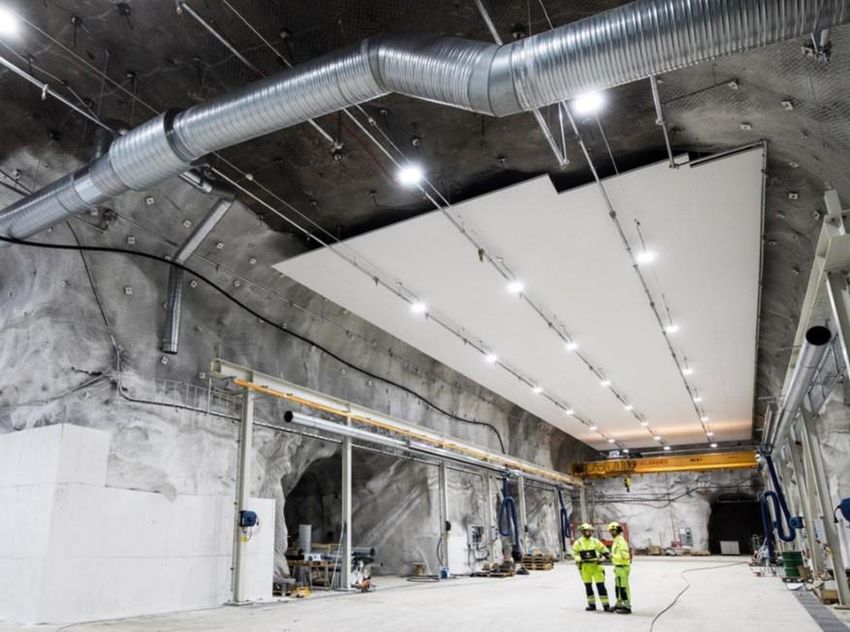
Neves-Corvo
Focused on Current Operations
    •   Q1/20 production of 9,075 t of copper, 17,948 t of zinc and 1,468 t of lead
    •   operating costs were better than plan, however, copper cash costs of $2.24/lb were                              Copper, Zinc Production & Cash Cost Outlook
        impacted by production levels and by-product zinc pricing                                                                (kt & $/lb Cu, net of by-product credits)

    •   full year copper production guidance has been lowered reflecting Q1 results
    •   zinc guidance revised to reflect production from current operation only following
        temporary suspension of the ZEP                                                                                                                    2021 Zinc Production
    •   copper cash cost guidance has been revised to $2.10/lb reflecting reduced zinc by-product                                                            Being Reviewed
                                                                                                                                 73            70-75
        production and lower pricing

                                                                                                                                                        41-46         41-46
Reduced ZEP and Sustaining Capital                                                                                          41         35-40
& Exploration Expenditures

•       2020 total capital expenditure guidance reduced
        to $110M, from $230M                                                                                                               $2.10
                                                                                                                             $1.59
•       majority of reduction ($100M) reflects temporary
        suspension of the ZEP
                                                                                                                             2019A         2020            2021              2022
•       Q1/20 total capital expenditures of $47M
•       exploration expenditure guidance lowered to                                                                                            Copper      Zinc
        $2M, from $7M

                                     Neves-Corvo donation of 360 protective masks and disposable suits to the Local
                                         Health Unit of Baixo Alentejo and the University Hospital Center of Algarve.
                                                                                                                                                                                    10
Neves-Corvo – ZEP
Underground & Surface Construction
• excellent progress prior to temporary suspension; Surface construction recorded highest monthly progress rates
• underground 88% progress with civil and mechanical works largely complete. Development of lower stopes advancing as planned with first two sublevel accesses
continuing
• surface construction was nearly 80% complete at quarter end with materials handling and SAG aspects more than 98% complete
• mechanical, electrical, instrumentation and pre-commissioning work advanced as planned for flotation circuits, dewatering circuit, backfill cyclone station, tailings
and water supply piping systems, and new paste fill tailings thickener
• demobilization of construction contractors and owner’s teams completed in March
Underground construction – Q1/20 Surface construction – Q1/20
Transfer tower #2 Crusher chamber SAG mill commissioning work Flotation building piping
11Eagle
Consistent Mine & Mill Operating Performance
• Q1/20 production of 3,575 t of nickel and 4,378 t of copper
• nickel headgrade impacted by mine resequencing in Eagle East ; copper production Nickel, Copper Production & Cash Cost Outlook
above plan (kt & $/lb Ni, net of by-product credits)
• 2020 nickel production to increase more than 3,000 t (22%) over 2019, at reduced
cash costs, as higher-grade Eagle East ore contributes to the mill feed
• copper production expected to increase more than 2,200 t (15%) in 2020
17-20
15-18 15-18 15-18 15-18
14-17
14
13
Eagle East Development Concludes Successfully
• Eagle East project development
completed in Q1/20
$2.84
• project completed one quarter
ahead of original schedule and $1.00
13% below original budget
• 2020 sustaining capital
expenditure guidance 2019A 2020 2021 2022
unchanged at $15M
Nickel Copper
Eagle’s donation of US$10,000 to the COVID-19 Community Response Fund will
help supply household necessities, food, sanitizing and caregiving supplies to
organizations supporting individuals and families in Marquette County.
12Zinkgruvan
Strong Mine and Mill Throughput Performance
• Q1/20 production of 18,999 t of zinc, 8,013 t of lead and 536 t of copper at cash cost of
$0.51/lb of zinc Zinc Production & Cash Cost Outlook
(kt & $/lb Zn, net of by-product credits)
• excellent mine and mill throughput performance continued through Q1/20
• mine sequence change has deferred production from some high-grade stopes to later in
the year
• zinc production guidance revised to 72,000 – 77,000 and zinc cash cost guidance revised
to $0.60/lb to reflect Q1/20 results. 78 72-77 72-77
69-74
Reduced Capital & $0.60
Exploration Expenditures
• 2020 sustaining capital $0.39
expenditure guidance reduced
to $45M, from $50M, reflecting
deferral of mobile equipment
• exploration expenditure
guidance lowered to $7M,
from $15M 2019A 2020 2021 2022
• approximately 17,000 m
drilling planned
Monika Andersson, Communications Manager, displays one of 400 escape
hoods with respiratory filters donated to the University hospital in Örebro.
13Production and Cash Cost Guidance1
Production C1 Cash
(contained metal in concentrate) Cost2
Copper (t) Candelaria (100%) 160,000 - 175,000 $1.353
Chapada 51,000 - 56,000 $0.854
Eagle 15,000 - 18,000
Neves-Corvo 35,000 - 40,000 $2.103
Zinkgruvan 3,000 - 4,000
Total 264,000 - 293,000
Zinc (t) Neves-Corvo 70,000 - 75,000
Zinkgruvan 72,000 - 77,000 $0.603
Total 142,000 - 152,000
Gold (oz) Candelaria (100%) 90,000 - 100,000
Chapada 85,000 - 90,000
Total 175,000 - 190,000
Nickel (t) Eagle 15,000 - 18,000 $1.00
Total 15,000 - 18,000
1. Guidance as outlined in the Management's Discussion and Analysis for the quarter ended March 31, 2020 and as announced by news release on April 29, 2020.
2. Cash costs are based on various assumptions and estimates, including but not limited to: production volumes, as noted above, commodity prices (Cu: $2.25/lb, Zn: $0.85/lb, Ni: $5.00/lb, Pb: $0.75/lb, Au: $1,500/oz), foreign exchange rates (€/USD:1.10, USD/SEK:9.50,
USD/CLP:850, USD/BRL:4.75) and operating costs.
3. 68% of Candelaria's total gold and silver production are subject to a streaming agreement and as such cash costs are calculated based on receipt of $412/oz and $4.12/oz respectively, on gold and silver sales in the year. Silver production at Zinkgruvan and Neves-Corvo are
also subject to streaming agreements, and cash costs are calculated based on approximately $4.40/oz and $4.30/oz.
4. Chapada cash costs are calculated on a by-product basis and do not include the effects of its copper stream agreements. Effects of the copper stream agreements are reflected in copper revenue and will impact realized revenue per pound.
14Capital & Exploration Expenditure
30% Reduction in Capital Expenditure Guidance 36% Reduction in Exploration Expenditure Guidance
• 2020 guidance lowered by $180M from $620M to $440M • 2020 exploration guidance lowered by $20M from $55M to $35M
• ZEP 2020 capital expenditure guidance reduced by $100M to • reduction includes deferred drilling, drift and geophysical surveys
$55M with project construction temporarily suspended. $31M
capitalized on project in Q1/20 • over 110,000 m of drilling remains in plan with focus on in and near-mine targets
• sustaining capital expenditure guidance reduced by $80M in
response to low metal price environment
Sustaining Capital
Candelaria (100% basis) 230
Chapada 40
Eagle 15
Neves-Corvo 55
Zinkgruvan 45
Total Sustaining 385
ZEP (Neves-Corvo) 55
Total Capital Expenditures1,2 $440M
New Zinkgruvan core shed completed in Q4/19
1. During the production phase, waste stripping costs which provide probable future economic benefits and improved access to the orebody are capitalized to mineral properties. The Company capitalizes waste costs when experienced strip ratios are above the average planned strip ratio for each open
pit phase under development.
2. Excludes capitalized interest. Amounts forecast above are on a cash basis and may vary from accrual based estimates. 15Appendices
16Responsible Mining
We recognize the important role of the metals we produce and are committed to mining these metals responsibly
We demonstrate this commitment through living our core values of Safety, Respect, Integrity and Excellence in all aspects of our decision-making
Lundin Mining has been reporting on our sustainability performance in a comprehensive, standalone document since 2011
https://www.lundinmining.com/responsible-mining/sustainability-reports/
United Nations Global Compact (UNGC)
• Lundin Mining joined the UNGC in 2016
• our Mission, Values and Responsible Mining Policy align with the UNGC Ten
Principles on human rights, labour, the environment and anti-corruption, as well as
the 17 Sustainable Development Goals (SDGs)
• we continue to further integrate the SDGs into our business strategy, day-to-day
operations and our organizational culture by creating shared value, fostering
partnerships and demonstrating environmental and economic performance
17Candelaria Complex – Mineral Resources and Mineral Reserves1
Ownership 80%
Location Region III, Chile
Mine life 20 years
2020 exploration budget $15M
P&P Copper Mineral Reserves 3,604 kt contained (663,696 kt at 0.5%)
M&I Copper Mineral Resources 6,495 kt contained (998,635 kt at 0.7%)
Inferred Copper Mineral Resources 534 kt contained (67,354 kt at 0.8%)
P&P Gold Mineral Reserves 2.7 Moz contained (663,696 kt at 0.1 g/t)
M&I Gold Mineral Resources 4.9 Moz contained (998,635 kt at 0.2 g/t)
Inferred Gold Mineral Resources 0.3 Moz contained (67,354 kt at 0.3 g/t)
P&P Silver Mineral Reserves 37 Moz contained (663,696 kt at 2 g/t)
M&I Silver Mineral Resources 66 Moz contained (998,635 kt at 2 g/t)
Inferred Silver Mineral Resources 3.9 Moz contained (67,354 kt at 2 g/t)
1. For more information please refer to the Company’s Technical Report for the Candelaria Copper
Mining Complex, November 28, 2018 and the Company’s news release dated September 5, 2019
entitled “Lundin Mining Announces 2019 Mineral Resource and Reserve Estimates” on the
Company’s website (www.lundinmining.com). See also slide 30.
Candelaria Copper Mining Complex 18Candelaria Copper Production Profile1 (kt)
190 190 192 194
184 185
175 175 171 175
167
156 160
152 151
146 146
135 136
114
96
84
69
45
10
2016A 2017A 2018A 2019A 2020 2021 2022 2023 2024 2025 2026 2027 2028 2029 2030 2031 2032 2033 2034 2035 2036 2037 2038 2039 2040
December 2018 Technical Report December 2017 Technical Report At Purchase - October 2014 Techncial Report
Contained copper in the Mineral Reserve estimate2 has increased by 109%3 and the production profile significantly improved since acquisition
1. Production shown on 100% basis and is based on the NI 43-101 Technical Reports dated November 28, 2018, November 30, 2017, and October 6, 2014 copies of which is are available on SEDAR under the Company’s profile page. See also slide 30.
2. Refer to Press Release “Lundin Mining Announces 2019 Mineral Resource and Reserve Estimates” dated September 5, 2019. See also slide 30.
3. Mine depletion included.
19Candelaria Reinvestments
Mine Fleet Reinvestment
• significantly increased production profile and extended mine life on exploration success. Mineral
Reserve estimate now supports mine life to beyond 2040
• new equipment increases haulage efficiency. 38 new latest generation CAT 793F trucks which are faster,
have larger capacity and lower operating costs. Change to hydraulic shovels in backhoe configuration
• high-return investment; in excess of 20% IRR expected. $220M total investment essentially complete
Candelaria Mill Optimization Project (CMOP)
• low-risk investments to increase metal production, reduce costs and improve safety
• primary crusher motor upgrade, ball mill re-powering, pebble circuit upgrade, cyclone and feed
pump upgrades, flotation circuit upgrades, front-end desalination plant and pipeline improvements First New Candelaria Haul Truck
• throughput capacity forecast to increase ~4 ktpd and copper recovery by ~1.7%
• high-return initiatives. In excess of 20% IRR expected. $80M total investment; $15M planned in 2020
to complete the project
Underground Mine Expansions
• significant underground exploration success under Lundin Mining ownership
• total estimated Candelaria underground Mineral Reserves1 now 148.2Mt at 0.85% copper. Candelaria
North and South Sectors continues to show significant exploration potential
• Candelaria South Sector successfully transitioned to operations team in Q3/19. Aim to operate Candelaria
North and South Sector mines to maximum combined permit-limite 14,000 tpd
Candelaria Mill
1. Refer to Press Release “Lundin Mining Announces 2019 Mineral Resource and Reserve Estimates” dated September 5, 2019. See also slide 30.
20Chapada – Mineral Resources and Mineral Reserves1
Ownership 100%
Location Goiás State, Brazil
Mine life 30 years
2020 exploration budget $7M
P&P Copper Mineral Reserves 1,757 kt contained (738,789 kt at 0.24%)
M&I Copper Mineral Resources 2,590 kt contained (1,090,829 kt at 0.23%)
Inferred Copper Mineral Resources 360kt contained (162,769 kt at 0.22%)
P&P Gold Mineral Reserves 4.6 Moz contained (803,984 kt at 0.18g/t)
M&I Gold Mineral Resources 5.9 Moz contained (1,238,346 kt at 0.19 g/t)
Inferred Gold Mineral Resources 0.6 Moz contained (175,334 kt at 0.11 g/t)
1. For more information please refer to the Company’s news release dated September 5, 2019
entitled “Lundin Mining Announces 2019 Mineral Resource and Reserve Estimates” on the
Company’s website (www.lundinmining.com). See also slide 30.
Chapada deposits and near-mine exploration targets
21Chapada – General Overview
Alto
• located in northern Goiás State
Horizonte
• 270 km northwest of national capital of Brasilia
and 320 km north of state capital of Goiânia
• supported by road access with good connections
to the local and national road network
• average elevation of approximately 300 masl
• low rolling hills with large contiguous flat areas
• tropical climate with two well defined seasons:
− rainy season from November to March
− dry season from April to October
• Alto Horizonte, the closest town, has a population
of roughly 5,800 people
• local economic activity is mainly agropastoral.
Some small scale gold and clay mining activities in
area
Chapada • ± 750 employees and 1,300 contractors
• 10% of the workforce is female
• majority of the workforce is between 26 to 35
years old (42%) and 36 to 45 years old (32%)
Source: Google Earth
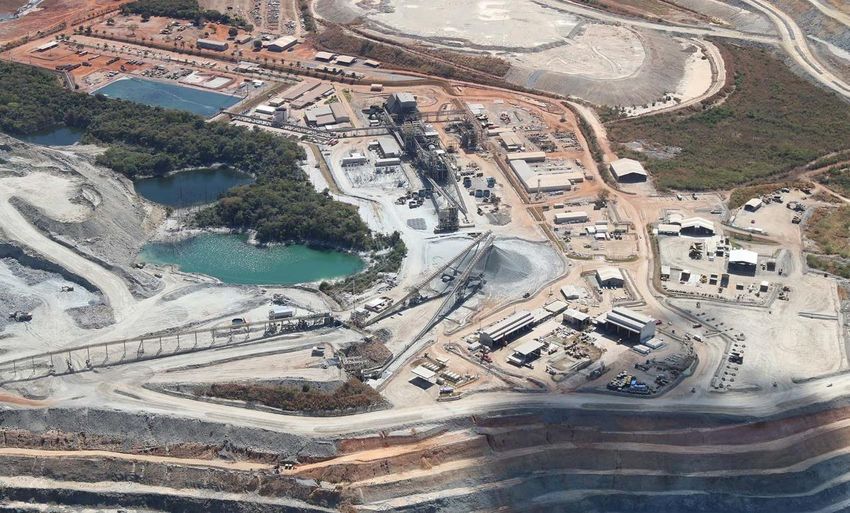
22Chapada Processing Facilities Overview
Conventional Crush, Grind, Float
Processing
Plant • single-line plant to treat sulphide ores
Plant
Facilities • current capacity of 65,000 tpd or 24.0 Mtpa
• produces a high-quality gold-rich copper
Mine concentrate
Power Facilities • Under LUN ownership1 in H2/19 the mill:
Substation
ROM Ore − processed 11.9 Mt of ore
Stockpile Crushed Ore − average copper grade of 0.31%
Stockpile
− average gold grade of 0.24 g/t
MMD − average copper recovery of 82.7%
Crusher − average gold recovery of 59.4%
− copper production of 30.5 kt
In-Pit Crusher
− gold production of 54 koz
Conveyor Belt
Jaw
Crusher
Aerial photograph of Chapada mine processing facilities
1. 2019 production based on period of Lundin Mining’s ownership post closing of acquisition on July 5, 2019 (approximately half year).
23Chapada Tailings Storage Facility (TSF)
• TSF is located northwest of Chapada open pit
• all dams raised by centerline methods Main
• Main Dam and Dyke III comprise compacted earth Dam
fill starter dams raised with cyclone tailings
• Dyke II is a compacted earth fill dam for water
retention
• current permitted capacity for approximately two
years at the current production rate of 24.0 Mtpa
• design to raise to 382 masl complete and submitted
to permitting authorities
Spillway
• conceptual designs to raise to 398 masl to provide
additional storage capacity
• video monitoring and alarm system in place
Water Reservoir
(10/12/18)
Dyke III
Water Pumping
Station
Dyke II
Chapada Tailings Storage Facility 24Chapada Production Profile1,2
120
100
Metal Production
80
60
40
20
0
2019A
2020
2023
2026
2027
2030
2033
2036
2037
2040
2043
2044
2046
2047
2050
2021
2022
2024
2025
2028
2029
2031
2032
2034
2035
2038
2039
2041
2042
2045
2048
2049
Copper (kt) Gold (koz)
1. Production shown is based on the NI 43-101 Technical Report dated October 10, 2019, available on the Company’s website and SEDAR under the Company’s profile page. See also slide 30.
2. 2019 production based on period of Lundin Mining’s ownership post closing of acquisition on July 5, 2019 (approximately half year).
25Eagle Mine – Mineral Resources and Mineral Reserves1
Ownership 100%
Location Michigan, USA
Mine life 5 years
P&P Nickel Mineral Reserves 108 kt contained (4,119 kt at 2.6%)
M&I Nickel Mineral Resources 132 kt contained (4,022 kt at 3.3%)
P&P Copper Mineral Reserves 91 kt contained (4,119 kt at 2.2%)
M&I Copper Mineral Resources 109 kt contained (4,022 kt at 2.7%)
Inferred Nickel Mineral Resources 12 kt contained (549 kt at 2.2%)
Inferred Copper Mineral Resources 8 kt contained (549 kt at 1.6%)
1. For more information please refer to the Company’s Technical Report on the Eagle Mine dated
April 26, 2017 and the Company’s news release dated September 5, 2019 entitled “Lundin Mining
Announces 2019 Mineral Resource and Reserve Estimates” on the Company’s website
(www.lundinmining.com). See also slide 30.
Eagle Mine
26Neves-Corvo – Mineral Resources and Mineral Reserves1
Ownership 100%
Location Alentejo region, Portugal
Mine life +10 years
2020 exploration budget $2M
P&P Zinc Mineral Reserves 2,214 kt contained (29,669 kt at 7.5%)
M&I Zinc Mineral Resources 4,958 kt contained (71,444 kt at 6.9%)
Inferred Zinc Mineral Resources 223 kt contained (3,828 kt at 5.8%)
P&P Copper Mineral Reserves 623 kt contained (27,917 kt at 2.2%)
M&I Copper Mineral Resources 1,427 kt contained (61,699 kt at 2.3%)
Inferred Copper Mineral Resources 229 kt contained (12,945 kt at 1.8%)
Inferred Semblana Copper Mineral Resources 223 kt contained (7,807 kt at 2.9%)
1. For more information refer to the NI 43-101 Technical Report for the Neves-Corvo Mine,
Portugal dated June 23, 2017 and the Company’s news release dated September 5, 2019 entitled
Schematic of Neves-Corvo Mine highlighting ZEP development and mining areas “Lundin Mining Announces 2019 Mineral Resource and Mineral Reserve Estimates” on the
Company’s website (www.lundinmining.com). See also slide 30.
27Zinkgruvan – Mineral Resources and Mineral Reserves1
Ownership 100%
Location Askersund, Sweden
Mine life +10 years
2020 exploration budget $7M
P&P Zinc Mineral Reserves 803 kt contained (10,816 kt at 7.4%)
M&I Zinc Mineral Resources 1,633 kt contained (20,275 kt at 8.1%)
Inferred Zinc Mineral Resources 1,381 kt contained (19,785 kt at 7.0%)
P&P Copper Mineral Reserves 55 kt contained (2,736 kt at 2.0%)
M&I Copper Mineral Resources 105 kt contained (4,632 kt at 2.3%)
Inferred Copper Mineral Resources 6 kt contained (293 kt at 2.1%)
1. For more information please refer to the Company’s Technical Report entitled NI 43-
101 Technical Report for the Zinkgruvan Mine, Central Sweden dated November 30,
2017 and the Company’s news release dated September 5, 2019 entitled “Lundin
Mining Announces 2019 Mineral Resource and Reserve Estimates” on the Company’s
website (www.lundinmining.com). See also slide 30.
Zinkgruvan Mine
28www.lundinmining.com | TSX: LUN | Nasdaq Stockholm: LUMI
NI 43-101 Compliance
Unless otherwise indicated, Lundin Mining Corporation (the “Company”) has prepared the technical information in this presentation including Mineral Reserve and Mineral Resource estimates (“Technical
Information”) based on information contained in the technical reports and news releases (collectively the “Disclosure Documents”) available under the Company’s profile on SEDAR at www.sedar.com. Each
Disclosure Document was prepared by or under the supervision of a qualified person (“Qualified Person”) as defined in National Instrument 43-101 – Standards of Disclosure for Mineral Projects of the
Canadian Securities Administrators (“NI 43-101”). For readers to fully understand the information in this presentation, they should read the technical reports identified below in their entirety, including all
qualifications, assumptions and exclusions that relate to the information set out in this presentation which qualifies the Technical Information. Readers are advised that Mineral Resource estimates that
are not Mineral Reserves do not have demonstrated economic viability. The Disclosure Documents are each intended to be read as a whole, and sections should not be read or relied upon out of context.
The Technical Information is subject to the assumptions and qualifications contained in the Disclosure Documents.
The Technical Information in this presentation has been prepared in accordance NI 43-101 and has been reviewed and approved by Stephen Gatley, BSc (Eng), C.Eng. Vice President - Technical Services of
the Company, a "Qualified Person" under NI 43-101. Mr. Gatley has verified the data disclosed in this presentation and no limitations were imposed on his verification process.
Mineral Resource and Mineral Reserve estimates of the Company are shown on a 100 percent basis for each mine. The Measured and Indicated Mineral Resource estimates are inclusive of those Mineral
Resource estimates modified to produce the Mineral Reserve estimates. All estimates of the Company are prepared as at June 30, 2019. Estimates for all operations are prepared by or under the
supervision of a Qualified Person as defined in NI 43-101 or have been audited by independent Qualified Persons on behalf of the Company.
Mineral Resources at Candelaria are estimated using metal prices of US$3.16/lb copper and US$1,000/oz gold and an exchange rate of USD/CLP 600. Mineral Reserves at Candelaria were estimated using
metal prices of US$2.75/lb copper and US$900/oz gold and an exchange rate of USD/CLP 600. Mineral Resources at Chapada and Suruca SW copper-gold are estimated using metal prices of US$4.00/lb
copper and US$1,600/oz gold and an exchange rate of USD/BRL 3.95. For the Suruca gold only Mineral Resource estimates at Chapada a gold price of $1,500/oz has been used and an exchange rate of
USD/BRL 3.50. Mineral Reserves at Chapada were estimated using metal prices of US$3.00/lb copper and US$1,250/oz gold and an exchange rate of USD/BRL 3.95. Mineral Resource for Neves-Corvo and
Semblana have been estimated using metal prices of US$2.75/lb copper and US$1.00/lb zinc and an exchange rate of EUR/USD 1.25. The Semblana Mineral Resource has been reported using the same
metal prices and exchange rates as Neves-Corvo. Mineral Resources and Mineral Reserves at Zinkgruvan have been estimated using metal prices of US$2.75/lb copper, US$1.00/lb zinc and US$1.00/lb lead
and an exchange rates of USD/SEK 7.00. Mineral Resources and Mineral Reserves at Eagle and Eagle East have been estimated using metal prices of US$2.75/lb copper and US$8.00/lb nickel. Refer to the
Company’s news release dated September 5, 2019 entitled “Lundin Mining Announces 2019 Mineral Resource and Reserve Estimates” on the Company’s website (www.lundinmining.com).
For further Technical Information on the Company’s material properties, refer to the following technical reports, each of which is available on the Company’s SEDAR profile at www.sedar.com:
Candelaria: technical report entitled Technical Report for the Candelaria Copper Mining Complex, Atacama Region, Region III, Chile dated November 28, 2018.
Chapada: technical report entitled Technical Report on the Chapada Mine, Goiás State, Brazil dated October 10, 2019
Neves-Corvo: technical report entitled NI 43-101 Technical Report for the Neves-Corvo Mine, Portugal dated June 23, 2017.
Zinkgruvan: technical report entitled NI 43-101 Technical Report for the Zinkgruvan Mine, Central Sweden dated November 30, 2017.
Eagle Mine: technical report entitled Technical Report on the Eagle Mine, Michigan, U.S.A. dated April 26, 2017.

                                                                                                                                                                                                                   30
You can also read