Organic farming in the EU - A fast growing sector - Europa EU
←
→
Page content transcription
If your browser does not render page correctly, please read the page content below
EU Agricultural Markets Briefs No 13 | March 2019
Organic farming in the EU
A fast growing sector
Contents Organic production is an overall system of farm management and food production that
contributes to the preservation of natural resources and applies high animal welfare
1. Organic production
and production standards.
2. Characteristics of organic
Recent production and market trends show the importance that organics has gained
farming
over the last decade. Organic farming responds to a specific consumer demand for
3. Consumption of organic sustainable food products, promoting more sustainable farming practices and
food contributing to the protection of the environment and improved animal welfare. This
4. Balancing demand and growing demand for organic products is matched by a rapidly growing production: EU
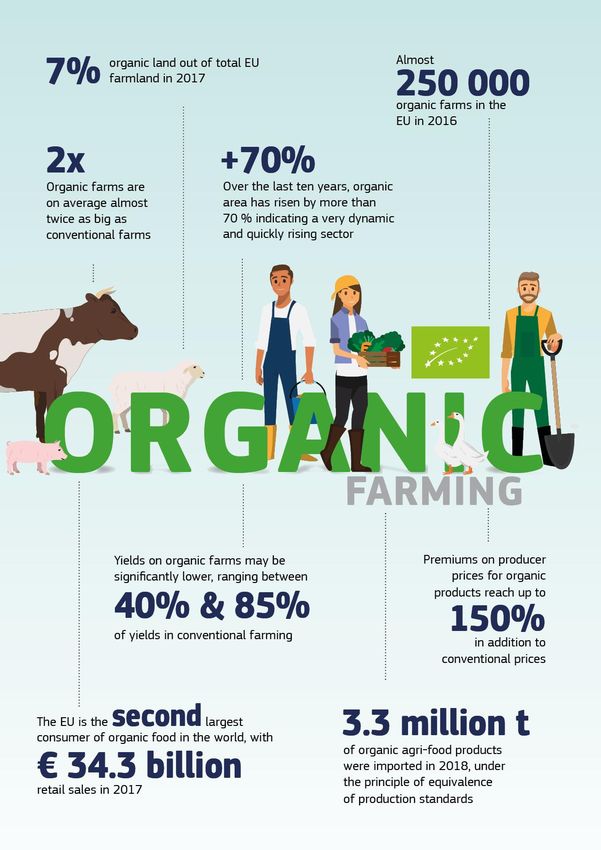
supply organic area increased by 70 % in the last ten years and organic retail sales reached
EUR 34 billion in 2017, providing farmers with further added value on their production.
5. EU subsidies and
national support to The aim of this brief is to describe the main features of the organic sector and report
organic on the latest production and consumption trends.
6. Conclusions
EU Agricultural Markets Briefs are available on Europa:
http://ec.europa.eu/agriculture/markets-and-prices/market-briefs/index_en.htm
Agriculture
and Rural
Development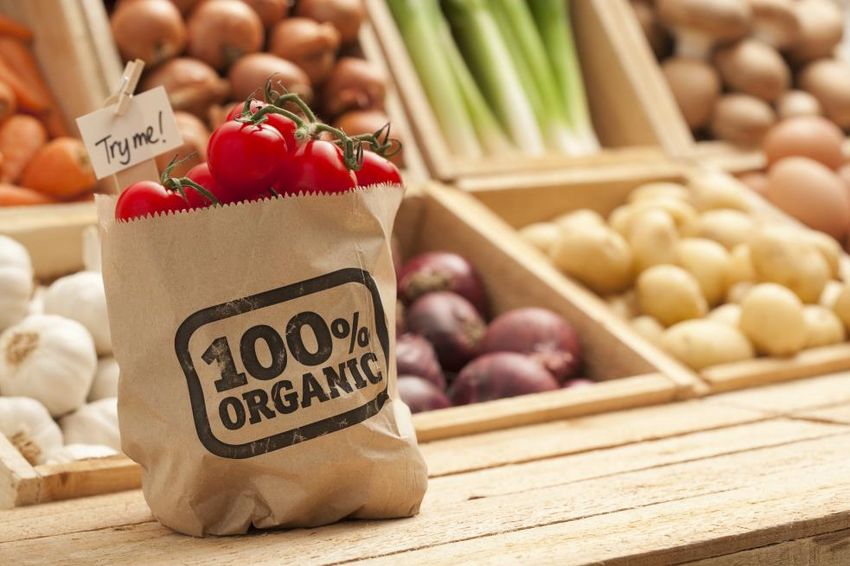
Organic farming in the EU – A fast growing sector
                                                    2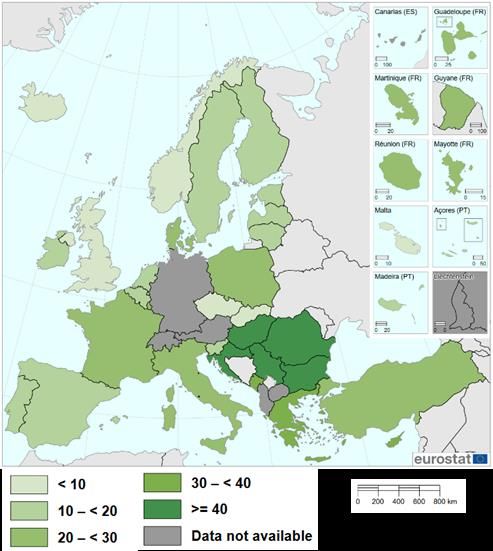
1. Organic production                                            agricultural land, leading countries are                    Austria
                                                                     (23 %), Estonia (20 %) and Sweden (19 %).
Growing organic area in the EU
                                                                     The    area    under   conversion   (20 %     of   the
At global level in 2017, 69.8 million ha were farmed                 12.6 million ha in 2017) provides an indication of the
organically (including area in conversion towards                    potential growth in the organic sector for the
organic). The EU reached 12.6 million ha in 2017,                    upcoming years. Eleven EU Member States had shares
which represents 18 % of the global organic area and                 of areas under conversion between 10 % and 20 %
7 % of total EU agricultural land. The impressive                    and eleven exceeded 20 %.
growth of organic production by 70 % over the past
                                                                     Figure 3 - Area under conversion to organic,
ten years reflects the importance gained by the
                                                                     2017 share of total organic area (%), by country
sector.
Figure 1 – Evolution of EU organic farmland,
2005-20171 (million ha)

Source: Eurostat

On average, organic area in the EU increased annually
by 5.6 % over the period 2007-2017.
Figure 2 – Organic land, area 2012 and 2017
(million ha), and share 2017 (%), main
producing countries                                                  Source: Eurostat

                                                                         Reform      of    the     organic              legislation:
                                                                         levelling the playing field
                                                                         Under the current legislation2, Member States
                                                                         benefit from the possibility to grant derogations
                                                                         from production rules on an ad hoc basis.
                                                                         Similarly, rules for imported organic products may
                                                                         also differ from those set in the EU legislation, as
                                                                         long as these are considered 'equivalent' or were
                                                                         certified organic.
                                                                         In 2021, the new legislation on organic production3
                                                                         will enter into force. The reform aims at building a
Source: Eurostat                                                         level playing field for the production of organic
Over half of the EU’s organic area is concentrated in                    products on the EU market, targeting EU
four countries: Spain, Italy, France and Germany.                        production and imported organic products.
However, looking at the share of organic in total
                                                                     2
                                                                       Council Regulation (EC) No 834/2007 28 June 2007 on organic
1
  The slowdown observed in the data in 2012-2013 may be related to   production and labelling of organic products and repealing Regulation
the change in survey methodology implemented from 2012 onwards,      (EEC) No 2092/91
rather than an actual slowdown in growth.                            3
                                                                       Regulation (EU) 2018/848 of the European Parliament and of the
                                                                     Council of 30th May 2018 on organic production and labelling of
                                                                     organic products and repealing Council Regulation (EC) No 834/2007

Organic farming in the EU – A fast growing sector
                                                                                                                                        3
The added value of the new regulation is to Overall, 72 % of all organic permanent crops are
harmonise rules for all actors. Imported goods will grown in Spain and Italy, covering together almost
have to comply with the same production and 1 million ha.
control rules as applied in the EU. Simplification is Figure 5 – Organic land use, share 2017 and
also an important element of the reform. In annual growth rate 2012-2017, by crop (%)
particular for small farmers, the new group
certification scheme is expected to reduce the
administrative burden and certification costs.
Another simplifying factor is the possibility to get
an exemption from the annual on the spot controls
if the holding has a clean record for the past three
consecutive years.
Grassland is the main organic land use
In 2016, the largest share of EU organic area was
permanent grassland (44 %), representing 5.6 million
ha. This area is used for organic cattle farming (both
meat and dairy), which requires access to outdoor
grazing areas. Further organic area is devoted to Source: Eurostat
green fodder (17 %), cereals (16 %) and permanent Organic animal production remains small
crops (11 %).
Despite a fast growth, EU organic animal production
Figure 4 – Land use of organic and conventional
remains small in comparison to total EU animal
land, 2017, by crop (%)
production, at about 3 %. In 2017, about 5 % of the
cattle herd and 6 % of the sheep and goat flocks were
estimated to be organic, while for poultry and pigs
this was estimated at respectively 3 % and less than
1 %. Extensive grass-fed systems of cattle, sheep and
goats can be easier and cheaper to convert into
organic. By contrast, this conversion is more complex
for grain-fed systems due to higher organic feed
expenses and stricter rules (e.g. in relation to animal
medication).
Figure 6 – Organic livestock, share 2017 and
annual growth rate 2012-2017, by livestock (%)
Source: Eurostat, 2016 data for Italy
While the share of organic area in total production
area of dry pulses (14 %), permanent crops (12 %),
green fodder (10 %) and permanent grassland (9 %)
are above the 7 % average, the share of organic
cereals (4 %) and oilseeds (2 %) lags well behind,
despite a strong annual growth rate of organic
oilseeds area of 13 % over the period 2012-2017.
The significant production of organic permanent crops
is driven by the high demand for organic fruits and for
organic wine. Area for organic fruit represents 29 % of
the total organic permanent crop area. Spain has the
largest area devoted to organic fruit (39 % of the Source: Eurostat, organic share in poultry: DG AGRI estimation
organic fruit area). A further 24 % of the permanent
crop area is devoted to vineyards, located mainly in Nevertheless, organic pig and poultry production show
Spain (33 %), France (24 %) and Italy (32 %). higher annual growth rates (respectively 6 % and
Organic farming in the EU – A fast growing sector
410 %). The growth of laying hens, which represent All EU Member states show an increase in organic milk
about 40 % of organic poultry, is estimated higher, at production, except for Poland and Estonia which show
around 13 %. a decrease of production in 2017 of respectively 26 %
and 41 % compared to 2012. Despite this increase,
Austria shows the highest share of organic livestock,
the share of organic milk in total milk production is
with 22 % of cattle, 29 % of sheep and goats and 3 % still low, just below 3 % in the EU in 2017, but
of pigs. Further countries with a high share of organic growing in most Member states. However, there are
animal production include Sweden (21 % of both four exceptions: organic milk accounts for a significant
cattle and sheep, 2 % of pigs), Denmark (13 % of share of production in Austria (16 %), Sweden
cattle and sheep and goats, 3 % of pigs) and Latvia (15 %), Latvia (10%) and Denmark (10 %). Within
(24 % of cattle, 31 % of sheep and goats). organic dairy, drinking milk holds the first place.
Figure 7 – Organic cattle, number of heads 2012 Figure 9 – Production of organic dairy products,
and 2017 (thousands), and share 2017 (%), volume (thousand t milk equivalent) 2017, main
main producing countries producing countries
Source: Eurostat Source: Eurostat
Organic dairy production in the EU is largely Environmental benefits of organic production
concentrated in the EU-15. Between 2012 and 2017,
Organic farming has to comply with strict
the size of the organic dairy herd in the EU has
standards with regard to the use of chemicals (no
increased annually by around 5.7% and the annual
synthetic fertilisers and pesticides, stricter rules on
milk production by around 6.3 %. Austria, France and
animal medication). Numerous studies show
Germany, hold 51 % of the organic dairy cows in the
evidence of the resulting positive environmental
EU.
impacts of organic agricultural practices. These
Figure 8 – Production of organic milk, volume include benefits in terms of greater biodiversity
2012 and 2017 (thousand t), and share 2017 and higher soil organic matter4. Besides, organic
(%), main producing countries
production is reported to lead to lower emissions of
nitrates ammonia and energy than conventional
farming on a per hectare basis5. There is however
no consensus on the precise contribution of organic
farming and the debate is ongoing.
4
Tuomisto, H.L., I.D. Hodge, P Riordan, D.W. Macdonald (2012),
Does organic farming reduce environmental impacts? A meta-analysis
of European research, Journal of Environmental Management, vol.
112, pp. 309-320
5
Mondelaers, K., J. Aertsens, G. Van Huylenbroeck (2009), A meta-
analysis of the differences in environmental impacts between organic
and conventional farming, British Food Journal, vol. 111:10, pp.
1098-1119; Tuomisto et al. (2012)
Source: Eurostat
Organic farming in the EU – A fast growing sector
5Critical voices claim also that organic agriculture is Observing the average size of farms, again a different
inefficient, as the yield gap (see below) requires pattern emerges: organic farms are on average
more area to produce a similar amount of food.6 almost two times larger (30 ha compared to 17 ha for
an average farm). This could be linked to the
extensive and grassland-based production systems in
the organic sector, but also to the low number of
2. Characteristics of organic farms organic farms in Romania8. Over 66 % of organic
holdings own 10 ha or more (vs. 20 % average for all
Organic farms tend to be bigger
farms) and only 7 % less than 2 ha (vs. 43% for all
In line with the growth in organic area, the number of farms).
organic holdings increased over the last years, in
A significant yield gap, possibly compensated by
contrast to the declining trend in total number of
higher producer prices
agricultural holdings. The number of organic farmers
grew by 9 % in 2016 compared with 2013. Organic production is characterised by a significantly
Figure 10 – Evolution of agricultural holdings lower yield than under conventional production. The
and organic holdings, 2003-2016 (thousands) gap is particularly important for wheat, with a yield
ranging between 40% (Germany) and 85% (Italy) of
conventional yields. The gap for organic maize yields
and milk yields is lower, but may still represent a
strong disincentive if not compensated by higher
prices.
Figure 12 – Organic yields compared to
conventional yields (= 100), average 2012-2016
Source: Eurostat 7
Figure 11 – Size of total holdings and organic
holdings, 2016 (%)
Source: EU-FADN9
Bridging the yield gap10
While organic yields seem lower than conventional
ones, the yield gap strongly differs depending on
factors such as location, agricultural practice
management or type of crop. This leads to strong
variations in profitability of organic production,
with however cases where the organic yield is
close to the conventional yield. This suggests that
Source: Eurostat research and innovation could improve organic
8
6
Also refer to: European Commission, DG Agriculture and Rural 33 % of all EU agricultural holdings are located in Romania, of which
Development (2018), EU Agricultural Outlook for markets and income 72 % below 2 ha. Less than 0.1 % of Romanian farms are organic.
9
2018-2030, box on Organic farming and climate change FADN data is based on a sample of farms, which is representative of
7
Data in the graph originates from the Farm Structure Survey from EU farming in terms of farm types and regions, but not representative
Eurostat. Differences in methodology compared to the annual survey of organic farms. Due to this limitation, FADN results should be
results in differences in data between both datasets. Moreover, it considered with care.
10
should be noted that not all farms are 100 % organic. Seufert V., N. Ramankutty, J.A. Foley (2012), Comparing the yields
of organic and conventional agriculture, Nature vol. 485, pp. 229-232
Organic farming in the EU – A fast growing sector
6farming practices and contribute to bridging the Resulting farm net income is not systematically
yield gap. higher
To assess organic farmers’ income, production cost
Lower yields seem however to be counterbalanced by should also be considered. Input costs are classically
higher producer prices. In Germany, organic wheat lower on organic farms, due to minimal use of
producers received up to 150% price premium over fertilisers and pesticides. The costs for fuel and
conventional prices. Price premium for milk producers lubricants are similar and sometimes higher, since
are on average lower. there is usually a stronger reliance on mechanical
Figure 13 – Premium on producer price for techniques in organic farming. Organic farming is on
organic wheat (conventional = 100), 2009-2016 average also more labour-intensive.12 Overall, in
terms of income, this results in varying performance
of organic farms over conventional.
Figure 15 – Net market income per annual work
unit for field crop farms, average 2012-2016
(thousand EUR/AWU)
Source: EU-FADN
Figure 14 – Premium on producer price for
organic milk (conventional = 100), 2009-2016
Source: EU-FADN
Figure 16 – Net market income per annual work
unit for milk farms, average 2012-2016
(thousand EUR/AWU)
Source: EU-FADN
While evidence suggests that organic farming creates
more added value and achieves higher margins per
production unit, organic farmers’ share of value-added
in the food chain do not significantly differ from those
in conventional supply chains (between 9 % and 62 %
Source: EU-FADN
share of retail prices for organic products compared to
between 6 % and 40 % in conventional).11 Despite increasing organic production in the EU, a
minimum of 2 % of organic producers were quitting
11 organic production annually over the last five years
Thünen Institute of Farm Economics (2016), Distribution of the
added value of the organic chain, study for the European Commission
12
Also refer to: European Commission, DG Agriculture and Rural
Development (2013), Farm Economics Brief, Organic versus
conventional farming, which performs better financially?
Organic farming in the EU – A fast growing sector
7(retiring or switching back to conventional farming). towards more natural alternatives.14 Recent food
Partial data reports on average 4 500 agricultural scandals have confirmed this trend and further
producers quitting organic production annually over stimulated organic.
the 2013-2017 period, compared to an average of
The pursuance of quality food is a further driver.
5 400 newly registered producers.13 Production
Organic food is sometimes associated with tastier and
constraints and costs associated to organic farming
more nutrient-dense food, in line with the “flavour-
appears to be an important motivation to switch back
over-appearance” belief. Social pressure could also
to conventional farming. In particular, bad crop years
potentially play a role.
can be triggering the decision. Further reasons include
the lack of local demand and the bureaucracy and While most consumers hold positive attitudes towards
costs of certification. The latter has also incentivised organic, the actual shift from purchase intention to
some producers to apply organic practices without actual purchase remains triggered by socio-
certification. demographic variables and level of income.15
Nevertheless, whatever the personal driver to switch
Under conversion labels for wine to consumption of organic products, the current
trends undeniably show that organic has become an
There is little doubt that organic wine is a success
integral part of the consumer’s shopping basket.
story, driven by a strong and growing demand for
a product with significant profit margins. France is Pesticides in bananas in Sweden contributed
the leading EU organic wine producer, with a 9 % to increased organic consumption
share and an 18 % growth in 2016 compared with In 2013, a debate rose in Sweden, when seven
2017. Despite a lower production, significant different types of pesticides were found in a single
growth is also observed in Italy (24 %) and Spain banana during tests by Testfakta, an independent
(11 %). testing and research company. Reactions were
Growing organic wine demands high labour strong and contributed amongst other drivers to
resources: conservation tillage, thorough vineyard the significant increase of the organic food market
observation to prevent intervention, manual work by 36 % annually over the next two years.
when weeding or preparing the soil, etc. Moreover, The EU ranks second in global organic
the average yield is significantly lower (e.g. consumption
averaging 70% of conventional yields in Spain).
In 2017, the global organic food and drink market
The three-year conversion period for wine to be
reached EUR 92 billion. The US accounts for 47 % of
granted with the organic label represents an
the global market, followed by the EU, with 37 %
important cost for the producer.
(EUR 34.3 billion). Over the last ten years, the EU
To partially compensate this loss, a specific label market doubled its size and it continues growing at a
has been set up in France, to designate wine significant pace (11 % in 2017 compared to 2016),
produced on a vineyard under conversion to indicating that it has not yet reached its maturity
organic. French winemakers may use this label stage.
after the first year, and therewith benefit from The penetration of organic food products varies
higher consumer prices. significantly between countries. The largest EU
markets for organic are Germany, with 10 billion EUR
3. Organic consumption (5.1 % organic in total retail sales), and France, with
7.9 billion EUR (4.4 %). The French organic retail
Health concerns are main driver for organic market is a good example of a country where organic
consumption has overcome its introduction stage and has now
earned its place. Consumers have become more
Environmental benefits of organic production have environmentally aware and organic sales increase
clearly contributed to building a positive consumer significantly (18 % in 2017).
attitude towards organic. But the organic practices
likewise address consumers demand for healthier
14
Mondelaers, K., W. Verbeke G. Van Huylenbroeck (2009),
food. The growing concern that excessive exposure to
Importance of health and environment as quality traits in the buying
pesticides and overuse of antibiotics have a negative decision of organic products, British Food Journal, Vol. 111 Issue: 10,
effect on health conditions is reorienting the society pp.1120-1139
15
Aertsens, J., W. Verbeke, K. Mondelaers, G. Van Huylenbroeck
(2009), Personal determinants of organic food consumption: a review,
13
Data available is very limited and countries covered by the data British Food Journal, Vol. 111 Issue: 10, pp.1140-1167
together represent only between 10 %-20 % (depending on the year)
of total organic producers registered. While the lack of data do not
allow grasping the extent of the phenomenon, it allows identifying it.
Organic farming in the EU – A fast growing sector
8Figure 17 – Organic retail sales, share and value Organic fresh fruit and vegetables represent another
(in billion EUR), 2017 success story of organic farming, with over 10 %
organic consumption in Austria, Denmark and
Sweden, and a sustained growth rate.
Consumption of organic dairy is also significant, in
particular in Austria and Sweden, respectively at 11 %
and 10 %. Penetration rates of organic drinking milk
are particularly high in Denmark and Austria with
respectively 32 % and 18 % of consumption.
Figure 18 – Growth in organic retail sales in
volume, annual growth rate 2012-2017 (%)
Source: The World of Organic Agriculture, Statistics and Emerging
Trends 2019, FiBL & IFOAM
In spite of the already high shares, organic integration
in Denmark and Sweden continues, with a respective
growth of 15 % and 9 % in 2017 compared to the
previous year. Denmark is with 13.3 % the country
with the highest integration of organic worldwide.
Over the last years, consumers in Denmark and
Sweden have been showing a great commitment to
high profile food and a growing interest on getting to
Source: Euromonitor International (2017), Fresh Food 2017
know the production methods and origins of what they
eat. Likewise, the organic share in Austria pursued its On the other hand, organic does not appear to take
growth in 2017 by 12 % to reach 8.6 % of retail sales. off as quickly in further food products, such as
beverages (excluding wine) and meat. However, with
A lower integration of organic products is observed in regard to organic meat, despite a relatively low
a number of other countries, including Spain (2.8 %) market share in most EU countries, retail sales
and Italy (3.2 %). Eastern European and Baltic indicate a high growth, up to 12 % in Italy and 13 %
countries also show a below average uptake of in the UK.
organic with 0.9 % in the Czech Republic, 2.6 % in
Estonia, 1.5 % in Latvia and 1 % in Lithuania. In Penetration rates are also particularly low (1 % or
these countries, organic is still at an early less) in a range of processed food products, such as
development stage and demand has not yet fully savoury snacks, sweet biscuits and confectionary,
emerged. Growth of the sector is nevertheless slightly frozen food, sauces and ready meals16.
above average in Spain and Italy at respectively 16 % Conventional stores represent the main
and 8 % in 2017, which is an indication that organic
distribution channel
consumption is taking off.
The distribution of organic products through the
This growing demand for organic is also well reflected
various retail distribution channels shows different
in the annual per capita expenditure, which averaged
patterns from country to country. In many EU
EUR 67 in 2017, compared to EUR 29 in 2007.
countries, conventional retailers (supermarkets)
Organic eggs dominate organic retail sales dominate the organic distribution market, with over
75 % in countries like Austria, Denmark and Sweden.
The market shares of specific organic food products
Conversely, in Portugal and Spain, distribution goes
provide useful information to assess consumption
primarily through the specialised channel, i.e. organic
trends more in detail. Here again, different
products specialised stores. The distribution structure
preferences emerge in different countries.
seems linked to the share of organic in retail sales:
Eggs have the highest retail market share in organic while organic products represent an integral part of
within the EU, with an exceptionally high penetration the shopping basket of many Swedes, Austrians and
in some countries: 33 % in Denmark, 30 % in France, Danish, these are made widely and easily accessible
22 % in Austria and 21 % in Germany. The growth
rate remains high. 16
Rabobank (2018), An Odyssey into a parallel Universe
Organic farming in the EU – A fast growing sector
9through the conventional distribution chain (e.g. can to a certain extent solve the issue – however,
supermarkets). In other countries like Spain or some consumers associate organic food with local
Portugal, organic food is still perceived as a niche food and perceive long-distance transport as
market with an exclusive status, mainly purchasable challenging the basic principles of organic17. Further
in specialised organic stores. consumption trends may also impact the demand for
organic products, such as for example veganism.
Other distribution channels include the catering
industry, online sales or direct sales (e.g. box scheme Remunerative outlets for unsold organic products may
delivery). A growth in consumption through these also be missing. For example, on the conventional
channels is reported in a number of EU countries over market, surplus milk can be processed into milk
the past years. For example, public procurement of powder or other goods with longer shelf life. This is
organic products (for catering in schools, hospitals, more difficult with organic milk surpluses, due to a
etc.) reached 33 % of public consumption in Sweden lack of demand for organic milk powder. Organic milk
in 2018 and 20 % in Denmark. therefore is sometimes sold as conventional, at the
same price as conventional milk. With a growing
Figure 19 – Organic retail sales by distribution
demand, the share of declassified milk shows however
channel, share 2017 (%)
a declining trend.
While a farmer’s decision to convert to organic
production needs to be taken several years in
advance, the uncertainty of finding a market for the
organically-produced food may refrain conversion to
organic, despite the steady growth in demand.
Organic producing countries are not
systematically the biggest consumers
While Italy and Spain are amongst the four largest
producers of organic, their consumption lags
behind. A large share of their production is
therefore exported. Similarly, countries with a high
share of organic land, like Austria and Sweden,
Source: The World of Organic Agriculture, Statistics and Emerging
Trends 2019, FiBL& IFOAM. 2016 data for Spain and Portugal:
may produce in excess of domestic demand. Little
Estrategia para la producción ecológica 2018-2020, Ministerio España data is available on intra-EU trade of organic food.
de Agricultura y Pesca, Alimentación y Medioambiente
The graph below sets in perspective the share of
The controversial discussion on packaging organic in retail sales with the share in land use.
Many voices highlight the ironic situation where Figure 20 – Organic retail sales, share and
organic food is sold in supermarkets wrapped up in value, and organic land use, share, 2017
non-environmentally-friendly packaging including
plastic, polywrap and metal. While legislation
requires organic products to be packaged to
prevent it being mixed with non-organic products,
a clear trend demands for greener packaging. A
wide range of companies in the sector has taken
on the challenge, proposing environmentally
friendly alternatives to plastic packaging in the
form of compostable biomaterials.
4. Balancing demand and supply
Finding a market for organic production
Source: Land use from Eurostat, retail sales from The World of
One of the challenges in the organic markets is the Organic Agriculture, Statistics and Emerging Trends 2019, FiBL &
delicate balance between demand and supply. A IFOAM
mismatch between demand and supply may occur
when the locally produced organic food exceeds the 17
Hermansen, J., M. Knudsen, C. Schader (2013), Globalization of
organic food chains and the environmental impacts, Organic
local demand for that particular food product. Trade Agriculture for Sustainable Livelihoods, Ch. 3
Organic farming in the EU – A fast growing sector
10The bubble size indicates the value of retail sales. and rice), oilmeals and oilseeds (20 %, including soya
In countries hovering around the 45° line, organic beans) and sugar (5 %).
retail sales are in line with the land use. Countries From equivalence to conformity
above this line are likely to show a higher self-
Under the current legislation (see box above),
subsistence level for organic products, while
imported organic products must prove they
countries below may show a deficit in domestic
conform to standards equivalent to European
production and may resort to more imports of
produced goods. To ensure this, a certification
organic products. It is important to note this figure
procedure is set up. For countries which standards
considers land use (including pastures) and not
and control measures have been assessed as
production. Moreover, no breakdown in products is
equivalent to those in place in the EU (e.g.
available and most probably a country may reveal
Australia, Canada, etc.), inspection is carried out
to produce some products in excess and others
by the national authorities of the country of origin,
insufficiently.
which then issues a certification of equivalence. In
all other countries, inspection and certification is
Compensating deficits in availability of organic
the responsibility of independent control bodies
products with imports
appointed by the European Commission to ensure
For a range of food products, demand seems to grow that organic producers follow standards and control
at a faster pace than supply. Factors behind this measures equivalent to the EU ones.
include the production costs and required
The new organic legislation shifts from the
investments, which may represent a disincentive for
principle of equivalence to the principle of
producers despite the price premium, as well as the
two to three-year conversion process, which creates a conformity and will hence require control bodies to
time lag to address demand. This translates for some certify the same production rules have been
products, such as pork meat, in a slow uptake of applied.
organic production and consumption.
Imports from outside the EU partly compensate the 5. EU subsidies and national support to
gap. In 2018, 3.3 million t of organic food were organic
imported. The CAP, a supporter of organic
Figure 21 – EU organic imports, share in The EU recognizes the role of organic farming as an
volume (t), 201818 asset for both the land and for consumers. Under the
Common Agricultural Policy – CAP for the period
2014-2020, organic farmers can benefit from several
support measures.
Overall, organic farmers receive more subsidies under
agri-environment and animal welfare subsidies than
conventional growers, in particular support for
maintenance and conversion to organic farming. In
2016, 56 % of EU organic land was granted this
support, receiving on average EUR 139/ha of CAP
support and EUR 75/ha national co-financing. They
also receive higher support under the Areas with
Natural Constraints (ANC, Less Favoured Areas (LFA)
under the 2007-2013 CAP), which encourages
agriculture in areas with natural handicaps. Further
Source: DG AGRI
Rural Development measures also support the
Significant products include food not or little produced development of organic production including
in the EU, such as tropical fruits and nuts (24 % of investments in organic farming practices and aid for
organic import volumes) and coffee and tea (4 %), or marketing and promotion of organic products. Organic
commodities with a low share of organic EU farmers receive therefore higher subsidies under Rural
production, including cereals (22 %, including wheat Development than their conventional counterparts do.
18
In addition, organic producers qualify under the
Imported organic wine is included under the category ‘Other’ and
represents 0.7 % of imported volume. Its share in value terms is requirements for greening payments. Producer
estimated higher but is difficult to assess due to data limitations. organisations of organic fruit and vegetables also
Organic farming in the EU – A fast growing sector
11benefit from increased co-financing rates through National support to organic boosts supply and
operational programmes. Overall, organic farmers demand
usually (with a few exceptions) benefit from higher
total EU subsidies. Alongside EU aid, almost all EU countries have also
shown their determination and willingness to develop
Figure 22 – Subsidies per AWU to field crop the organic sector. Strategic national or regional plans
farms by type, average 2012-2016 (thousands) support organic land use and consumption of organic.
For example, Germany launched a program in 2017 to
reach a 20 % share of organic area by 2030. Further
countries launched similar programs to increase the
organic surface19.
On the consumption side, national plans usually target
public procurement of organic, for consumption in
public schools, kindergartens, hospitals and residential
homes. For example, in Copenhagen (Denmark),
90 % of meals served in public entities were organic,
just one year following the launch of a program for
organic in 2015. Similarly, in Sweden, the objective
was set to reach 60 % share of organic in public
sector consumption by 2030. At the end of 2018,
consumption of a wide range of products already
Source: EU-FADN, AWU = annual work unit
overpassed 50 %, including coffee and tea,
Figure 23 – Subsidies per AWU to milk farms by leguminous plants and seed, cereals, dairy products,
type, average 2012-2016 (thousands) eggs, fish and other seafood). Similar strategies are
found in a number of countries, including non-
exhaustively Croatia, Finland, France, Germany, Italy,
Latvia and Slovenia20.
6. Conclusions
The organic sector responds to an increasing desire
for sustainable food production, and as such, it fits
perfectly under the CAP objectives. At the same time,
it provides higher prices to farmers. Over the next
years, improved farming practices and increased use
of technology and digitalisation have the potential to
reduce production costs, with positive impacts on farm
income and consumer prices.
The strong growth rates in both production and
Source: EU-FADN consumption indicate that the organic market has not
yet reached its maturity stage and further growth can
Organic farming is further recognised under the
still be expected. Organic farming is already
legislative proposals for the CAP beyond 2020 and it
responding to further emerging consumer trends such
complies with several of its objectives, including
as veganism and demand for locally produced food
environmental care, contributing to preserving
products, turning these challenges into opportunities.
landscapes and biodiversity and responding to societal
demands on food health, sustainable food and animal
welfare. 19
IFOAM and FiBL (2015), Organic action plans, a guide for
stakeholders
20
Progress Consulting (2018), Sustainable procurement of food,
study for the European Committee of the Regions
This document does not necessarily represent the official views of the European Commission
Contact: DG Agriculture and Rural Development, Unit Analysis and outlook
Tel: +32-2-29 91111 / E-mail: Agri-C2@ec.europa.eu
http://ec.europa.eu/agriculture/markets-and-prices/index_en.htm
© European Union, 2019 — Reproduction authorised provided the source is acknowledged
Organic farming in the EU – A fast growing sector
12You can also read