EMBASSY REIT BUILDING RELATIONSHIPS ENRICHING LIVES

Page created by Barry Pearson
 
CONTINUE READING
EMBASSY REIT BUILDING RELATIONSHIPS ENRICHING LIVES
EMBASSY REIT
BUILDING RELATIONSHIPS
ENRICHING LIVES
EMBASSY REIT BUILDING RELATIONSHIPS ENRICHING LIVES
Disclaimer

By attending the meeting where this presentation (the “Presentation”) is made, or by reading the Presentation materials, you agree to be bound by the following limitations:
This Presentation is strictly private and confidential and is intended exclusively for the intended recipients. This Presentation and the information contained herein may not be disclosed,
reproduced, retransmitted, summarized, distributed or furnished, in or whole or in part, to any other person or persons. Any printed form of this Presentation must be returned to us
immediately at the conclusion of the Presentation.
This Presentation is for information purposes only without regards to specific objectives, financial situations or needs of any particular person, and the information contained herein does
not constitute or form part of any offer for sale or subscription of or solicitation or invitation of any offer to buy or subscribe for, or advertisement with respect to, the purchase or sale of
any security (including any units or securities of Embassy Office Parks REIT (the ”REIT”) in the United States or in any other jurisdiction, and no part of it shall form the basis of or be
relied upon in connection with any contract or commitment whatsoever.
The material that follows is a Presentation of general background information. We don’t assume responsibility to publicly amend, modify or revise any forward looking statements on the
basis of any subsequent development, information or events, or otherwise. This Presentation comprises information given in summary form and does not purport to be complete and it
cannot be guaranteed that such information is true and accurate. This Presentation should not be considered as a recommendation to any person to subscribe to any security. This
Presentation includes statements that are, or may be deemed to be, “forward-looking statements”. By their nature, forward-looking statements involve risks and uncertainties because
they relate to events and depend on circumstances that may or may not occur in the future. Forward-looking statements are not guarantees of future performance including those relating
to general business plans and strategy, future outlook and growth prospects, and future developments in its businesses and its competitive and regulatory environment. No
representation, warranty or undertaking, express or implied, is made or assurance given that such statements, views, projections or forecasts, if any, are correct or that the any objectives
specified herein will be achieved.
Neither we, nor any of our affiliates or advisors, as such, make any representation or warranty, express or implied, as to, and do not accept any responsibility or liability with respect to,
the fairness, accuracy, completeness or correctness of any information or opinions contained herein and accept no liability whatsoever for any loss, howsoever, arising from any use or
reliance on this Presentation or its content or otherwise arising in connection therewith. Unless otherwise stated in this Presentation, the information contained herein is based on
management information and estimates. The information contained herein is subject to change without notice and past performance is not indicative of future results.
Embassy Office Parks REIT is proposing, subject to, receipt of requisite approvals, market conditions and other considerations, to make an initial public offering of its Units and has filed
the Offer Document dated March 11, 2019 ("Offer Document") with SEBI. The Offer Document is available on the websites of SEBI, BSE, NSE at www.sebi.gov.in, www.bseindia.com
and www.nseindia.com respectively GCBRLMs at www.morganstanley.com, www.investmentbank.kotak.com, www.jpmipl.com and www.ml-india.com and BRLMs at
www.axiscapital.co.in, www.creditsuisse.com, www.db.com/India, www.goldmansachs.com, www.hsbc.co.in/1/2/corporate/equitiesglobalinvestmentbanking, www.iiflcap.com,
www.jmfl.com & www.nomuraholdings.com/company/group/asia/india/index.html Potential investors should note that investment in Units involves a high degree of risk and for details
relating to the same, see "Risk Factors" beginning on page 22 of the Offer Document.
The units or securities of the REIT have not been and will not be registered under the U.S. Securities Act, 1933, as amended (“U.S. Securities Act”) or any state securities laws in the
United States, and unless so registered may not be offered or sold within the United States, except pursuant to an exemption from, or in a transaction not subject to, the registration
requirements of the U.S. Securities Act and applicable state securities laws. The units or securities have not been and will not be registered, listed or otherwise qualified in any other
jurisdiction outside India and may not be offered or sold, and bids may not be made by persons in any such jurisdiction, except in compliance with the applicable laws of such jurisdiction.
We do not intend to register securities or to conduct a public offering of securities in the United States. By attending this meeting, you confirm that you are either (i) a “qualified institutional
buyer” as defined in Rule 144A under the U.S. Securities Act, or (ii) outside the United States. Any failure to comply with the foregoing and below restrictions may constitute a violation of
applicable securities laws.
This document is just a Presentation and is not intended to be a “prospectus” or “draft offer document” or “offer document” or “final offer document” or “offer letter” or “offering
memorandum” (as defined or referred to, as the case may be, under the Companies Act, 2013 and the rules notified thereunder, and the Securities and Exchange Board of India (Real
Estate Investment Trusts) Regulations, 2014, as amended, or any other applicable law). It is clarified that this Presentation is not intended to be a document or advertisement offering for
subscription or sale of any securities or inviting offers or invitations to offer or solicitation to offer from the public (including any section thereof) or any class of investors. This Presentation
has not been and will not be reviewed or approved by a regulatory authority in India or elsewhere or by any stock exchange in India or elsewhere.
If the we should at any time commence an offering of securities, any decision to invest in any such offer to subscribe for or acquire securities must be based wholly on the information
contained in a final offer document or offering circular (including the risk factors mentioned therein) issued or to be issued in connection with any such offer and not on the contents
hereof. Any offering circular will only be provided to potential investors in the United Arab Emirates upon request.
This Presentation is not intended to be an offer or placement for the purposes of the Alternative Investment Fund Managers Directive (“AIFMD”), and any “marketing” as defined under
AIFMD may only take place in accordance with the national private placement regimes of the applicable European Economic Area jurisdictions.                                                               2
EMBASSY REIT BUILDING RELATIONSHIPS ENRICHING LIVES
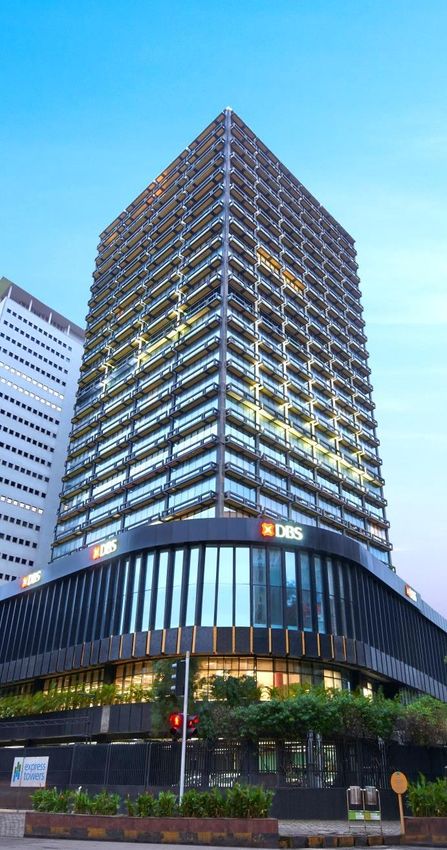
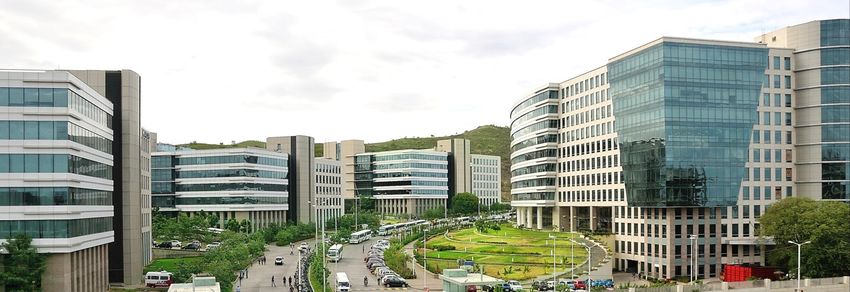
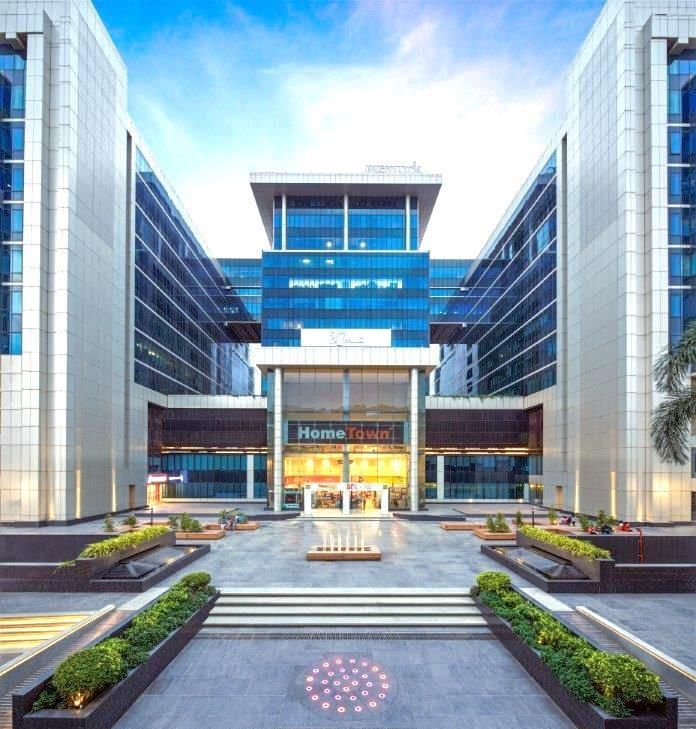
(1)
Seven Infrastructure-like Office Parks (31 msf)

Embassy Manyata                                                                                         Embassy Quadron
Bengaluru (14.2 msf)                                                                                    Pune (1.9 msf)

Embassy Golflinks                                                                      Embassy Techzone
Bengaluru (2.7 msf)(2)                                                                 Pune (5.5 msf)

Embassy Oxygen                                                       Embassy Galaxy                 Embassy Qubix
Noida (3.3 msf)                                                      Noida (1.4 msf)                Pune (1.5 msf)

Note: For additional detail, please see notes at the end of the Presentation.                                             3
EMBASSY REIT BUILDING RELATIONSHIPS ENRICHING LIVES
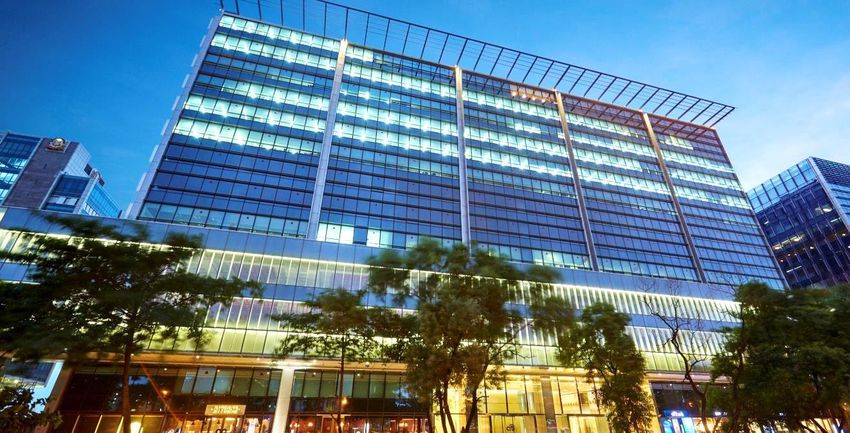
Four Prime City-center Offices (2.4 msf)

Express Towers             FIFC
Mumbai (0.5 msf)           Mumbai (0.4 msf)

                           Embassy 247        Embassy One
                           Mumbai (1.2 msf)   Bengaluru (0.3 msf)

                                                                    4
EMBASSY REIT BUILDING RELATIONSHIPS ENRICHING LIVES
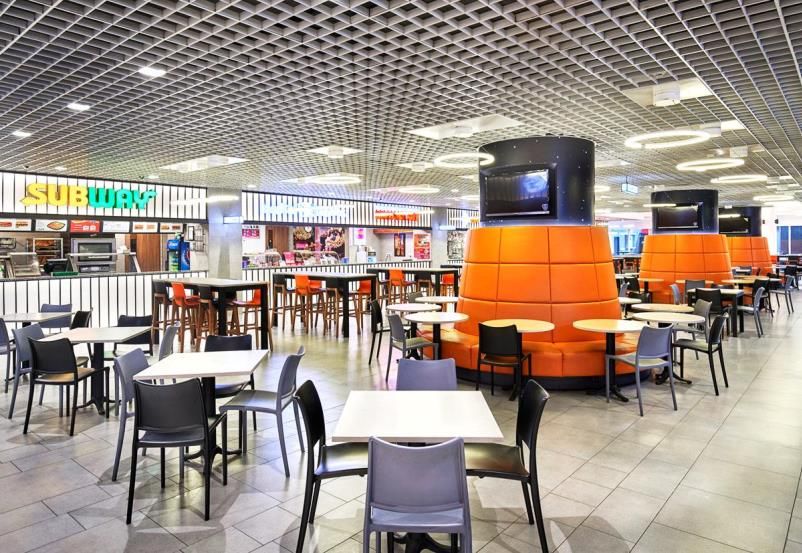
Pan-India Best-in-class Office Portfolio

                33 msf
              Leasable Area(1)

                                                                                                                          Noida (8.9%)
                         75
High Quality Office Buildings
   across 11 Commercial
           Offices

                                                                                                   Mumbai (16.2%)

                           4
                                                                                                              Pune (14.4%)
               Gateway Cities

                                                                                                                            Bengaluru (60.5%)
                    160+
        Marquee Tenant Base

Note: City wise split by % of Market Value.
(1) Includes 24.8 msf sf of Completed Area, 2.5 msf of Under Construction Area and 5.4 msf of Proposed Development Area                         5
EMBASSY REIT BUILDING RELATIONSHIPS ENRICHING LIVES
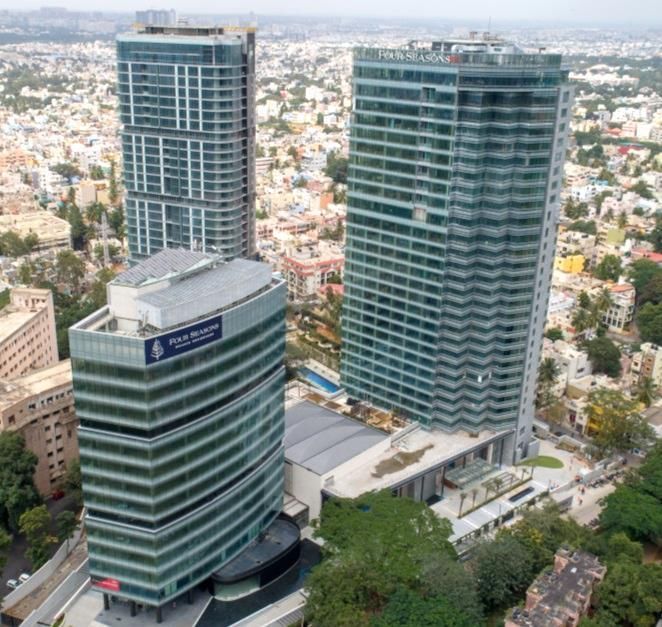
Compelling Business Opportunity

 High quality office portfolio, serving as essential corporate infrastructure to multinational tenants, with
    significant embedded growth aspects
                                                   India has become a global hub for corporates services over the last 20 years leading to 15% annual
 Compelling Industry                                    employment growth in the technology services sector
   Fundamentals                                    Outsized services sector growth has in turn resulted in key Indian cities having amongst the highest
                                                        office absorption globally(1)

                                                   Embassy REIT provides infrastructure-like office parks with best-in-class amenities at competitive
                                                        rents to multinationals
    Best-in-class
   Portfolio with                                  95% leased to marquee tenants with 81% of rents from multinational corporations
Multinational Tenants                              Located in India’s key office markets with our assets outperforming the market

                                                   Asia’s largest office REIT(2) – 33 msf portfolio of office parks and prime city-center offices

                                                   7 year WALE(3) with contractual escalations

                                                   34% mark-to-market growth potential(4); 48% re-leasing spreads on 2.7 msf over last three years and
   Simple Business                                      nine months
  Model with Strong
  Embedded Growth                                  7.9 msf on-campus development pipeline to accommodate tenant expansion and potential ROFO
                                                        assets to enhance growth
                                                   Low leverage(5) provides flexibility for growth through value accretive acquisitions

    Experienced                                    Seasoned management team with 20 years average experience
  Management Team
                                                   Active asset management driving stable occupancy and strong rent growth
   and Renowned
     Sponsors                                      Backed by renowned sponsors – Embassy Group and Blackstone
Note: For additional detail, please see notes at the end of the Presentation.                                                                              6
EMBASSY REIT BUILDING RELATIONSHIPS ENRICHING LIVES
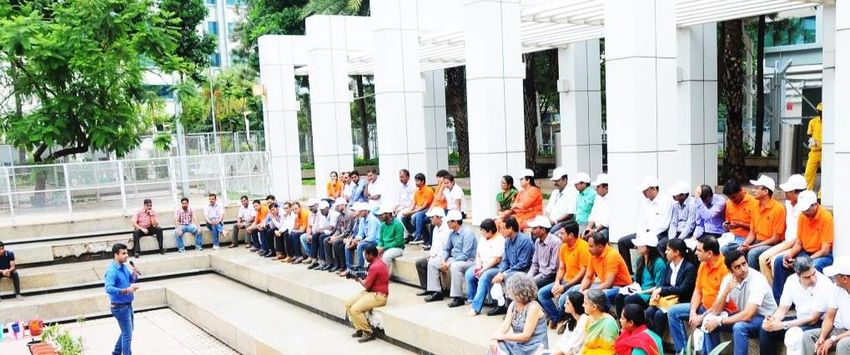
Multinational Tenant Base of Blue-chip Companies

        81%     of Rents from                                     43%   of Rents from
      Multinational Corporations                                  Fortune 500 Tenants
           (as of December 31, 2018)                                   (as of December 31, 2018)

                                            Technology
                                                         Google      Microsoft       IBM           Cognizant

                                          Financial
                                          Services
         Indian                                             Goldman           JP Morgan              Wells
       Corporates                                            Sachs                                   Fargo
          19%

                                            Consulting
                                                                  PwC               Accenture

                                                                                               Rolls-

                                            E&M
                                                         Volkswagen            NOKIA           Royce
                       Multinational

                                            Healthcare
                        Corporate
                         Tenants                                            Legato
                           81%

                                            Others
                                                            Maersk               Target            Lowe’s

                                                                                                               7
EMBASSY REIT BUILDING RELATIONSHIPS ENRICHING LIVES
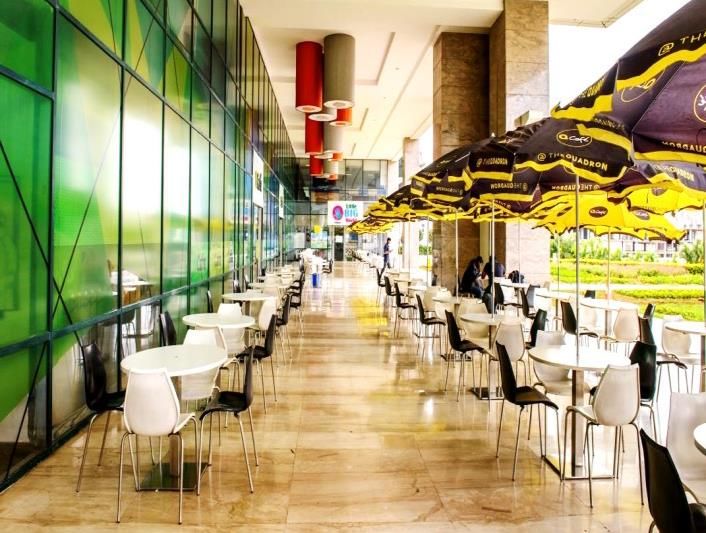
Capital Values Significantly Below Peers

 Real estate capital values in Embassy REIT’s markets are significantly below other global peers

                                                                                     Capital Values
                                                                                             (USD psf)

                Embassy REIT’s                                                             $3,100 -   $3,100 -
                   Markets                                                                  3,150      3,150

                                                                                                                                                                $2,100 -
                                                                                                                                                                 2,150

                                                                                                                          $1,450 -
                                                                                                                           1,500
                                                                                $1,000 -
                                                                                 1,100                                               $850 -                                $900 -
                                                                                                                                                       $800 -              1,000
                                                                                                                                      950               900
                                                                     $600 -
                                                                      700                                        $400 -                       $350 -
                                       $275 -                                                                     500                          450
          $150 -        $160 -          325           $175 -
           210           220                           225

        Bengaluru         NCR          Mumbai          Pune        Shanghai Beijing          Hong        Tokyo   Munich   Central     New       Los      San    Singapore Sydney
                                                                                             Kong                         London      York    Angeles Francisco

Note: CBRE Research, 2018.
Note: For additional detail, please see notes at the end of the Presentation.                                                                                                       8
EMBASSY REIT BUILDING RELATIONSHIPS ENRICHING LIVES
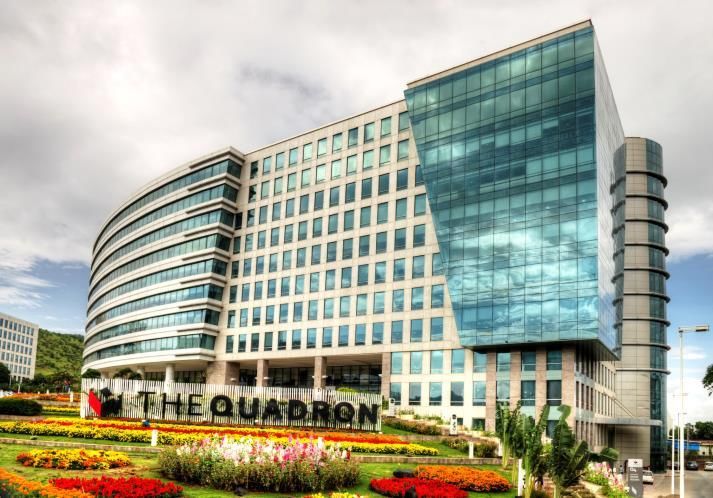
Considerable Cost Arbitrage in Terms of Office Rents

 Embassy REIT’s markets offer significantly cheaper rentals compared to global commercial hubs

                                                                                    Market Rents in Major Global Cities
                                                                                                     Q1 CY 2018 (USD psf /year)

                 Embassy REIT’s
                    Markets

                                                                                                                                              $147.9

                                                                                    $120.0
                                                                                                 $108.0            $108.0

                                                                       $85.0                                                                                                          $89.0

                                                                                                                                                            $61.9
                                                                                                                                                                             $56.7
                                                                                                                                 $50.3
                                                                                                                                                                                               $44.0
                                                                                                                                                                    $35.9
                                          $24.9
             $14.4          $14.9                        $15.6

           Bengaluru         NCR          Mumbai          Pune       Shanghai Beijing                Hong         Tokyo         Munich            Central   New       Los      San    Singapore Sydney
                                                                                                     Kong                                         London    York    Angeles Francisco

Note: CBRE Research, 2018.
Note: Years refer to the calendar year ending December 31 respectively. For additional detail, please see notes at the end of the Presentation.                                                          9
EMBASSY REIT BUILDING RELATIONSHIPS ENRICHING LIVES
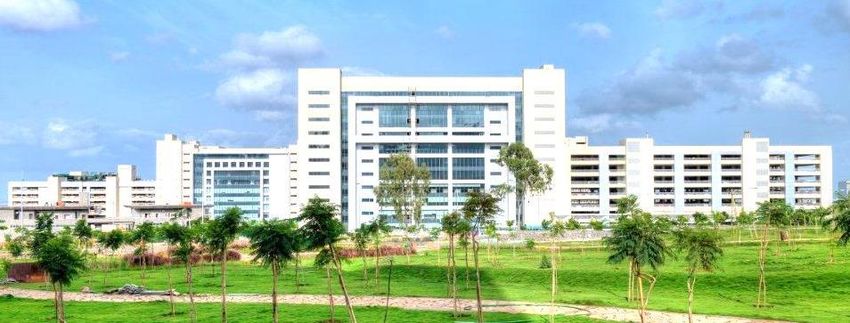
Strong U.S. Labour Market Driving Indian Technology Services Growth

 Low unemployment and strong wage growth in the U.S. improves attractiveness of Indian technology
    services

  Decadal Low Unemployment in the U.S. Resulting                                                                                Strong U.S. Wage Growth Driving
         in 2.5m STEM Employee Shortage                                                                                      Technology Sector Employment in India
                                         (% unemployment)                                                                                           (Rebased to 100 in 2011)

                                                                                                                                                                                                           (3)
                                                                                                                                                                                                        159
               10.0%

 5.6%                                                                                                                                                                                                        (2)
                                                                                          4.0%                                                                                                         117

                                                                                                                                    (1)
                                                                                                                             100

  Jun-08           Jun-10          Jun-12           Jun-14           Jun-16           Jun-18                                 2011 2012 2013 2014 2015 2016 2017 2018

                                                                                                                                    U.S. Private Sector Wages                     India Technology Employment

Note: CBRE Research, US Bureau of Labor Statistics.
Note: STEM denotes employees engaged in the fields of science, technology, engineering and mathematics. For additional detail, please see notes at the end of the Presentation.                                    10
Abundant Talent and Cost Savings Driving Economic Growth and Office Absorption

 Availability of skilled English speaking talent and a low cost base continues to attract global
    companies to use India for large services operations leading to high office absorption

                   India’s Competitive Advantages                         Space Occupied by Technology Sector
                                                                                                    (msf)

                                                                                                                  318

    Large                      6.4 million
 Talent Pool                   Graduates annually

    Cost                       85%
  Advantage                    Lower cost structure than US Tier
                                                                                     37
                               II cities

                                                                                   2000                         2018F
 Technology                    15% CAGR                                                                     High Value,
   Sector                      Technology sector employee                   Cost Arbitrage                  Less Cost
   Growth                      growth from 2000 to 2018F                     Services(1)                     Sensitive
                                                                             (call centers, BPOs,            Services
                                                                                    testing)
                                                                                                            (R&D, Healthcare)

Note: CBRE Research, 2018.
Note: Years refer to the calendar year ending December 31 respectively.                                                         11
(1) For pre-2000 period.
Our Markets Continue to Witness Strong Fundamentals

 Embassy REIT’s markets have witnessed strong absorption growth (up 26% from 2013 to 2018F) with
    forecast supply remaining constrained and expected to be below historical average absorption

                                          Absorption(1)                                                                                                        Supply(1)
                                                    (msf)                                                                                                        (msf)

                                                                               30.1

                                                                                                                                                                              24.6
                          23.8                                                                                                                      24.1

                         2013                                                2018F                                                                 Avg. from                 Avg. from
                                                                                                                                                  2013–2017                2018F–2019F
Note: CBRE Research, 2018.
Note: Years refer to the calendar year ending December 31 respectively. For additional detail, please see notes at the end of the Presentation.                                          12
Key Indian Cities Have amongst the Highest Office Absorption Globally

 Our four markets have experienced total absorption of 136 msf from CY 2013 to Q1 2018, more than 11
    global cities combined
                                                                                                          Absorption
                                                                                                    CY 2013–Q1 2018 (msf)

                              135.8 msf
                                                                                                                                             128.4 msf
                            Embassy REIT’s
                                                                                                                                         Other Global Cities
                               Markets

              56.7

                            31.1
                                           29.1                         28.6

                                                         18.9                                                      19.0
                                                                                      17.2
                                                                                                                                 14.6
                                                                                                                                                        10.0    9.6      9.1
                                                                                                      5.4                                         5.6                             6.3
                                                                                                                                                                                            3.1

           Bengaluru         NCR         Mumbai          Pune        Shanghai Beijing                Hong         Tokyo         Munich        Central   New      Los      San    Singapore Sydney
                                                                                                     Kong                                     London    York   Angeles Francisco

Note: CBRE Research, 2018.
Note: Years refer to the calendar year ending December 31 respectively. For additional detail, please see notes at the end of the Presentation.                                                     13
Portfolio Overview

   In-fill Locations with                                 Strategically located in India’s key office markets of Mumbai, Bengaluru, Pune and Noida
     Significant Scale                                    Our assets outperform their markets: 940 bps higher occupancy, 270 bps higher rent CAGR(1)

                                                          7 infrastructure-like office parks and 4 prime city-center offices
    World-Class Assets
     with Outstanding                                     Complete business ecosystem with landscaped environments and amenities such as 1,096 on-
        Amenities
                                                               campus hotel keys(2), food courts, gymnasiums, childcare and employee transportation

                                                          Stable tenant base with 95% committed occupancy and 81% tenant retention over the last three

                                                               years and nine months
   Highly Occupied by
                                                          72% of our tenant base is from the services sector (key driver of India’s growth)
  Marquee Tenant Base
                                                          6.8 msf of new leasing over the last three years and nine months without incurring material

                                                               Tenant Improvements (“TI”) capex

         Attractive Yield                                 175 bps–575 bps premium to capitalization rates for assets of similar quality and tenant profile
             Spreads                                           in United States, Japan and China

Note: For additional detail, please see notes at the end of the Presentation.                                                                                 14
Embassy REIT’s Assets Are Well Positioned in India’s Four Key Office Markets

                                                                                                                           Embassy REIT’s Markets Represent                     77% of
                                                                                                                                    India’s Office Absorption
                                          72%                                                                                      2013–Q1 2018 (% of absorption for Top 7 Indian Cities)

                   Of India’s Grade A office stock
              concentrated in Embassy REIT’s markets(1)

                                                                                                                                                    Others
                                                                                                                                                     23%              Bengaluru
                                          26%                                                                                                                           32%

                       Absorption growth since 2013 for
                         Embassy REIT’s markets(2)
                                                                                                                                             Pune
                                                                                                                                             11%

                                                                                                                                                                      NCR
                                                                                                                                                    Mumbai
                                                                                                                                                                      18%
                                  780 bps                                                                                                            17%

                   Increase in occupancy since 2013 for
                        Embassy REIT’s markets(3)

Source: CBRE Research, 2018. India’s top 7 cities include Mumbai, NCR, Bengaluru, Pune, Chennai, Hyderabad and Kolkata.
Note: Years refer to the calendar year ending December 31 respectively. For additional detail, please see notes at the end of the Presentation.                                             15
Infrastructure-like Office Parks with Best-in-class Amenities

Embassy Quadron
Pune (1.9 msf | 25 acres)

Hilton at Embassy Golflinks                   Food Court at Embassy Galaxy
Bengaluru (247 Keys)                          Noida

                                                                             16
Our Assets Provide a Complete Business Ecosystem

Alfresco Dining               Gymnasium                          Tenant Engagement

Amphitheatre                              Childcare Facilities

Sports Facilities    Public Transport                Social Responsibility

                                                                                     17
Sustainability Initiatives

 Our focus on energy sustainability and environment conservation is a key differentiator

                                                                                 100 MW Solar Plant

                       100MW Solar Plant supplying green power to
    Sustainable          Bengaluru assets and hotels
      Energy
                       Many LEED Platinum / Gold rated assets

                                                                                 Awards and Certifications
                       2 British Safety Council Sword of Honour winning

   Environment,          parks (2017) for select assets
  Health and Safety    Environmental, Health and Safety Certifications such
                         as ISO / OHSAS for select assets

                                                                                 Cycling Event
                       Create a sense of community by organizing cultural,

    Community            lifestyle and corporate social responsibility events
    Engagement         Undertaken environment friendly green initiatives such

                         as employee transportation facilities

                                                                                                             18
Embassy REIT’s Assets Have Outperformed Their Markets

 High quality assets with robust infrastructure and amenities backed by professional asset
    management has resulted in strong outperformance by our Portfolio
                                                                         (1)                                                                                        (2)
                                                 Occupancy                                                                                                  Rents
                                                            (%)                                                                              2013 – Q1 2018 (Indexed Rents 2013 = 100)

                                                                                                                        150

            94.3%                                                               94.7%              95.0%
                             92.8%            93.4%            93.4%
                                                                                                                                                                                   CAGR: 6.9%

                                                                                                   940 bps              130
                                                                                                                                                                                         270 bps

                                                                                 85.5%            85.6%
                                                                84.5%
                                                                                                                                                                                    CAGR: 4.2%
                                              81.4%                                                                     110
                            80.8%

          77.8%

                                                                                                                          90
            2013              2014             2015             2016              2017          1Q 2018                                2013        2014      2015         2016   2017    1Q 2018

                                                                  Embassy REIT’s Markets                                            Embassy REIT’s Assets

Note: CBRE Research, 2018.
Note: Years refer to the calendar year ending December 31 respectively. For additional detail, please see notes at the end of the Presentation.                                                    19
Deep Tenant Relationships and Asset Quality Driving Strong Leasing Traction

 Scale and quality of our assets have resulted in 6.8 msf of new leasing over the last three years and
      nine months without incurring material TI CapEx

                6.8 msf of New Leasing                                Typical TI Capex
                                                                     (% of Rental Revenue)(1)
over the Last Three Years and nine months
                               Area Leased (msf)
                                                                 15%–20%

                     New
                   Tenants
                     38%

                                               Existing
                                               Tenants                                          2%–5%
                                                 62%

                                                                US real estate              Indian real estate
                                                                 companies                     companies

(1)   Source: CBRE Research.                                                                                     20
Embedded Mark-to-market Growth Potential

                             Market Rents Are 34% above                                29% of Occupied Area Expiring
                                    In-place Rents                                       between Q4 2019 – FY 2023
                                        Rents (INR psf/month)(1)                                Area Expiring (msf)

                                                                                                                                  3.2
                                                                   83

                                                                                                                        1.4
                            62
                                                                                                 0.9
                                                                                                            0.8
                                                                                        0.5

                                                                                       Q4-FY   FY 2020   FY 2021      FY 2022   FY 2023
                                                                                       2019

                                                                         Mark-to-
                                                                         Market         8.3%    37.3%     59.3%
                                                                         Opportunity

                                                                         Rents
                  In-place Rents                          Market Rents   Expiring       1.8%    4.9%       3.8%        6.1%      9.4%
                                                                         (%)

(1)   Based on management's estimates                                                                                                     21
Strong Track Record in Re-leasing to Market with High Value Tenants

  Achieved 48% Average Re-leasing Spreads                           Re-leasing to High-Value
  on 2.7 msf Area over last three years and nine                        Services Tenants
                    months                                                     (Rents INR psf/month)
                      (% Increase in Base Rents)

                                                            Embassy Golflinks
                                                            (145k, 9mFY19)                             133
                           60.7%

         48.0% Average                                                  46
                                                   49.3%

                                                                      Before
                                                                   Leading Retail                     After
                                                                                                     Leading
                                         35.3%                         Store                     Technology Tenant
                                                            Embassy Manyata
             26.6%                                          (56k sf, 9mFY19)
                                                                                                        77

                                                                         51
            FY 2016       FY 2017       FY 2018    9mFY19
Area
Re-
leased       0.3          1.1            0.5       0.8
                                                                LeadingBefore
                                                                        Software                    Leading
                                                                                                       After
(msf)
                                                                   Developer                    Technology Tenant

                                                                                                                     22
Complete On-campus Development Pipeline

 Demonstrated development capability with 4.1 msf delivered over the last five years and nine months

              Development Experience & Future Potential                                                                 De-risked Development
                                                        (msf)(1)                                                            (High Pre-leasing)

                                                                                                          Perspective                    Actual

                                                                                               3.0

                        3.6 msf & 0.5 msf
                    added in Manyata & Oxygen
                                                                                                                        Embassy Oxygen | 0.5 msf
                                                                                  0.3
                            respectively                                                                                          (Tower 3)
                                                                                  0.6
                                                                                               0.7

        1.4
                                                                                  1.8
                                                                                               1.5
                                                                                                                                   92%
                            1.3                                                                                                 Pre-leased
                                                 0.9
                                                                     0.5                                                    (Nov-18 completion)
      FY 2014            FY 2016              FY 2018              FY 2019      FY 2021    Post FY 2021
                            Manyata                       Oxygen                Techzone

(1)    Excludes 619 hotel keys across Hilton and Hilton Garden Inn in Manyata                                                                      23
Strong Embedded Growth

 Contracted NOI growth drives approximately 50% of projected NOI growth (FY 2019 – FY 2021)

                                                                                  NOI Bridge
                                                                                  (INR in millions)

                                                                                                             1,209
                                                                                       1,469
                                                                2,629

                                                                                                                              21,447
                16,141

                FY 2019                                  Contracted             Vacancy Lease-up &    Re-leasing at Market,   FY 2021
                                                                    (1)
                                                         NOI Growth                Development        Hotel Stabilization &
                                                                                                             Others (2)

            % of Total
                                                                 50%                     27%                   23%
             Growth

Note: For additional detail, please see notes at the end of the Presentation.                                                           24
Embassy Sponsor’s Potential ROFO Assets to Drive Growth

 Embassy REIT will have a ROFO on certain assets owned by the Embassy sponsor potentially
  expanding our presence to Chennai which is other key Indian office market
              Embassy TechVillage
              (Bengaluru | 12.2 msf)
                                                              42.8 msf | 4 assets
                                                        Being developed by Embassy across strong markets such
                                                                       as Bengaluru & Chennai

                                                                          ROFO Mechanism

             Embassy Splendid TechZone                                  Market value not less than INR 7.5
                                                        Asset Size
                 (Chennai | 5.0 msf)                                     billion

                                                                        Compliant with REIT regulations
                                                      Specifications
                                                                        At least 50% area developed

                                                                        Controlling interest of Embassy Group
                                                       Applicability    Triggered upon any change in
                                                                         controlling interest by Embassy
                                                                                                                 25
Flexible Capital Structure for Disciplined Acquisition Strategy

 Conservative balance sheet, post utilization of IPO proceeds, provides significant flexibility for growth
      through value accretive ROFO and third-party acquisitions

                                              Net Debt to GAV

                                           Less than 15%
                                          (Post utilization of IPO
                                                proceeds)

         Hong Kong                                                   18 - 22%
        based REITs

          Singapore
                                                                                   30 - 40%
       based REITs

(1)   Source: CBRE Research.                                                                                  26
Simple Business Model

                                         Stable, long-term contracted rents with 10%–15% contractual escalations every 3–5 years
      Stable Cash Flows
                                         81% of rents from multinationals with 43% from Fortune 500 companies

      Near-Term                          Lease-up of existing 5% vacancy – largely transitional and concentrated in select assets
Leasing Upside to Drive
        Growth                           Significant mark-to-market opportunity – market rents are 34% above in-place rents(1)

                                         2.5 msf currently under construction on entitled land within Embassy REIT’s assets
      On-campus
                                         Hilton branded hotels totaling 619 keys currently under construction within our assets
 Development Potential
                                         Further 5.4 msf of Proposed Development Area to accommodate tenant expansion

                                         Lowly leveraged initially with less than 15% loan-to-value post utilization of IPO proceeds
  Strong Balance Sheet
                                         Significant flexibility enables growth through ROFO asset and third-party acquisitions

(1)   Based on management's estimates                                                                                                   27
Embassy REIT Manager

 Highly experienced senior management team with over 20 years of average experience
                                                                                                                                             Ritwik
                          Michael
                                                   Vikaash Khdloya       Rajesh Kaimal           Sachin Shah        Bhhavesh Kamdar       Bhattacharjee
                          Holland
                                                  Deputy CEO / COO 1         CFO                     CIO              Head, Leasing       Head, Investor
                           CEO
                                                                                                                                            Relations

                    20+ Years                     11+ Years           23+ Years             17+ Years            26+ Years          12+ Years
                     Experience                       Experience         Experience             Experience            Experience          Experience
                    Former           Former MD,                       Worked in various  Key person of           Former Deputy      Former ED at
                     Country Manager   Blackstone Real                   positions with the     Samsara Fund          General Manager     Nomura
      Experience

                     and Managing      Estate                            Manipal Group          Advisors Private      – Leasing and       Singapore Limited
                     Director of JLL                                                            Limited               Marketing           and Director at
                                      Former VP at
                     India                                                                                            (Commercial) at     UBS AG
                                       Piramal Fund                                            Former VP of
                                                                                                                      Larsen & Toubro     Singapore Branch
                    Former CEO of     Management                                               Acquisitions at
                                                                                                                      Limited
                     Assetz Property   (erstwhile                                               Starwood Capital
                     Group             IndiaREIT)                                               Group

                                                The Manager and the Asset SPVs together have over 60 employees
       Management
                                                Hands on expertise in asset management, leasing, development, acquisitions and financing
        Summary
                                                Strong relationships with tenants, lenders and capital providers

(1)          Will be deputy CEO/COO on the date of listing                                                                                                    28
Active Asset Management Driving Strong Performance

                        6.8 msf of new leasing over the past three years and nine months
      Leasing
                        7.7 msf of renewals over the past three years and nine months

                        7.1% Same-Store Rental CAGR across portfolio assets & investment from FY
   Rental Growth         2016 to FY 2018

                        48% re-leasing spreads on 2.7 msf over the past three years and nine months

    Development
                        Completed 4.1 msf of development over the last five years and nine months
     Expertise

  Asset Upgrades /      Upgraded 7 food courts and 33 office lobbies across assets over the last three
  Refurbishments         years and nine months

  Tenant Initiatives    Pioneered tenant engagement programs such as “Energize” and “Q-Life”

                                                                                                          29
Strong Corporate Governance Framework

 Embassy REIT has incorporated adequate corporate governance standards to protect unitholder value

                                           50% independent directors on the Board, with 50% representation on all committees

                                           Manager can be removed with 60% approval of unrelated unitholders
          Manager
                                           Alignment with unitholder interests due to a distribution linked management fees
                                            structure

                                           Minimum 80% of value in completed and leased properties

             Asset                         Minimum 90% of distributable cash flows to be distributed

                                           Restrictions on speculative land acquisition

                                           Majority unitholder approval required if debt(1) exceeds 25% of asset value
              Debt
                                           Debt cannot exceed 49% of asset value

                                           Sponsors are prohibited from voting on their related party transactions
  Strong Related  Majority unitholder approval required for acquisition or disposal of asset which exceeds
       Party       10% of REIT value
    Safeguards
                                           Acquisition or sale price of new asset cannot deviate from average valuation of two
                                            independent valuers by +/- 10%

(1)   Debt includes consolidated borrowings and deferred payments of the REIT, Hold Co and SPV’s.                                 30
Experienced Board

            Nominee Directors                            Independent Directors

         Jitendra Virwani                                Vivek Mehra
          Chairman & Managing Director,                  Ex-Partner for PricewaterhouseCoopers Private
           Embassy Group                                   Limited

         Christopher Heady                               Anuj Puri
          Chairman of Blackstone Asia Pacific            Director at ANAROCK Investment Advisors
                                                           Private Limited
          Head of Blackstone Real Estate Asia

         Tuhin Parikh                                    Dr. Punita Kumar Sinha
          Senior Managing Director of Blackstone Real    Ex-Portfolio manager, Oppenheimer Asset
           Estate’s operations in India                    Management

         Aditya Virwani                                  Dr. Ranjan Pai
          On the board of several Embassy group          Former Managing Director and CEO of Manipal
           companies                                       Group

                                                                                                           31
Credible Sponsors with Significant Local and Global Expertise

                            45 MSF                                    $119B
           Completed area across                                      Investor Capital
             residential and office                                   under management (1)
                     development

                            Extensive        Local     Global   473 Real Estate
                            Land bank held
                                across the   Expert   Manager   Professionals
                                   country                      Working globally (1)

                 Integrated
                   Platform
        Project management,
        land acquisitions and                                         Public offerings
       marketing of real estate                                       Hilton and
                        assets                                        Invitation Homes

(1)   As of June 30, 2018                                                                    32
Notes

 All figures in this presentation are as of December 31, 2018 unless specified otherwise

 All figures corresponding to year denoted with “FY” are as of or for the one year period ending (as may be relevant) 31st
   March of the respective year. Similarly, all figures corresponding to year denoted with “CY” are as of or for the one year
   period ending (as may be relevant) 31st December of the respective year
 Some of the figures in this Presentation have been rounded-off to the nearest decimal for the ease of presentation

 Any reference to long-term leases or WALE (weighted average lease expiry) assumes successive renewals by tenants at
   their option
 Key Terms and Definitions:

   1. 1. Embassy Group: refers to the Embassy Sponsor or its subsidiaries or limited liability partnerships

   2. 2. Mumbai: represents MMR – Mumbai Metropolitan Region

   3. 3. NCR: represents Delhi National Capital Region

   4. 4. NOI: Net Operating Income calculated by subtracting Direct Operating expenses from Revenue from operations

   5. 5. Occupancy / % Occupied / % Leased: refers to Committed Occupancy unless specified otherwise. Committed
      Occupancy is defined as the ratio of the Occupied Area including Completed Area under letter of intent and the
      Completed Area
   6. 6. Rents: refers to Gross Rentals unless specified otherwise. Gross Rentals are defined as the sum of Base Rentals,
      fit-out and car parking income from Occupied Area for the month of March 2018
   7. 7. Rolls-Royce: refers to Rolls-Royce India Private Limited

   8. 8. Years: refers to fiscal years unless specified otherwise

                                                                                                                                33
Notes

Page 3:
(1) Includes 7.9 msf of Under Construction and Proposed Development Area
(2) Details for 100% of GLSP; Embassy REIT will own a 50% economic interest in GLSP
Page 6:
(1) Source: CBRE Research. In terms of total absorption for select major office centers from CY 2013–Q1 CY 2018
(2) As at December 31, 2018. Largest REIT by area amongst comparable Asian office REITs. Includes 24.8 msf completed area and 7.9 msf
development potential
(3) Weighted Average Lease Expiry assuming that each tenant exercises the right to renew for future terms after expiry of initial commitment period
(4) Based on management’s estimates
(5) Post utilization of IPO proceeds
Page 8:
(1) NCR represents Delhi National Capital Region, which includes Noida
Note: For Bengaluru, NCR, Pune, Mumbai and Sydney, the capital values highlighted above have been computed based on the indicative yields
prevalent in the respective markets and representative of Grade A office spaces. For all other cities the values are average capital values for strata sold
developments in the respective cities.
Page 9:
(1) Noida, where Embassy Oxygen and Embassy Galaxy are located, is a submarket of NCR (National Capital Region)
Note: New York, Los Angeles and San Francisco represents Gross Asking Rent; Hong Kong, Tokyo, Singapore, Beijing, Shanghai represents Grade A
rent on Net Floor Area; Sydney represents rent for all grades on Net Floor Area; Central London, Munich, Mumbai, Pune, NCR and Bengaluru
represents Grade A rent on Gross Area. Rents for Central London and Munich are representative of Prime Rents. Rents for Bengaluru, NCR, Mumbai
and Pune have been calculated based on the weighted average of market rents and occupied stock of the respective sub markets within the city.
Page 10:
(1) Represents 2.5 million people employed in the India technology industry and an hourly wage of $23.0 in the US Private Sector in FY 2011
(2) Represents an average hourly wage of $26.8 in FY 2018
(3) Represents 3.97 million employed in FY 2018
Page 12:
(1) For Embassy REIT’s markets – Bengaluru, Pune, Mumbai and NCR
(2) Average of the annual supply in the relevant period

                                                                                                                                                              34
Notes

Page 13:
(1) Noida, where Embassy Oxygen and Embassy Galaxy are located, is a submarket of NCR (National Capital Region)
Note:
(1) For office stock in India, CBRE defines “Grade A” as a development type, of which tenant profile should include prominent multinational
   corporations, while the building area should not be less than 100,000 square feet. The development should include an open plan office with large
   size floor plates, adequate ceiling height, 24x7 power back-up, supply of telephone lines, infrastructure for access to internet, central air-conditioning,
   spacious and well-decorated lobbies, circulation areas, good lift services, sufficient parking facilities and should have centralized building
   management and security systems.
(2) For office stock outside of India, “Grade A” development has different definitions depending on the jurisdictions the developments are located in
Page 14:
(1) Source: CBRE Research, 2018. For Embassy REIT’s markets. Occupancy figures as of March 31, 2018. Rent CAGR over CY 2013–Q1 CY 2018
(2) Includes 477 completed and 619 under construction hotel keys
Page 15:
(1) As of March 31, 2018. Includes Bengaluru, Pune, Mumbai and NCR
(2) Calculated as the percentage increase in the absorption expected for CY 2018 over the CY 2013 actual absorption
(3) Includes Bengaluru, Pune, Mumbai and NCR. Occupancy has increased to 85.6% in Q1 CY 2018 from 77.8% in CY 2013
Page 19:
(1) Occupancy for REIT assets is as on March 31 of the respective year
(2) Market rents for assets as per CBRE
Page 24:
(1) Includes incremental NOI of INR 455 million on account of solar assets
(2) Includes incremental NOI from hotels (INR 423 million) and mark-to-market opportunity (INR 174 million)
Note: Excludes 50% interest in Embassy Golflinks as that is a JV interest. Our 50% stake in Embassy Golflinks contributes a further INR 1,648 million
and INR 2,026 million NOI in FY 2019 and FY 2021, respectively.

                                                                                                                                                                 35
THANK YOU

27/03/20
You can also read