INVESTOR PRESENTATION - Year ended 31 December 2017 INVESTOR PRESENTATION, Spring 2017 - Gamesys

 
CONTINUE READING
INVESTOR PRESENTATION - Year ended 31 December 2017 INVESTOR PRESENTATION, Spring 2017 - Gamesys
INVESTOR PRESENTATION, Spring 2017

INVESTOR
PRESENTATION
Year ended 31 December 2017
INVESTOR PRESENTATION - Year ended 31 December 2017 INVESTOR PRESENTATION, Spring 2017 - Gamesys
DISCLAIMER
    IMPORTANT: YOU MUST READ THE FOLLOWING BEFORE CONTINUING: This presentation has been prepared and issued Jackpotjoy plc (the "Company") and its subsidiaries (together, the
    "Group"), and is being furnished to each recipient solely for its own information. For the purposes of this notice, "presentation" means this document, its contents or any part of it, any oral
    presentation, any question or answer session and any written or oral material discussed or distributed during a presentation meeting.
    This presentation speaks as of the date specified on the cover page and has not been independently verified and no representation, warranty or undertaking, express or implied, is given by or on
    behalf of the Group or any of its directors, officers, employees, agents, affiliates or advisers as to, and no reliance should be placed on, the fairness, accuracy, reliability, completeness, appropriateness,
    validity, quality, reasonableness, truth or correctness of the information or opinions (including any statements, estimates and financial outlooks contained and/or referred to in this presentation) or in
    any other written or oral communication made available in connection with this presentation; and no responsibility or liability is assumed by any such persons for such information or opinions or for
    any errors, omissions or misstatements contained herein. This presentation contains summary information only and does not purport to be comprehensive and is not intended to be (and should not
    be used as) the sole basis of any analysis or other evaluation. The information set out in this presentation is indicative and for discussion purposes only and will be subject to updating, revision,
    completion, verification and amendment without notice and such information may change materially. None of the Group or its directors, officers, employees, agents, affiliates or advisers is under an
    obligation to update, complete, revise or keep current the information contained in this presentation nor to provide the recipient with access to any additional information that may arise in
    connection with it, and any opinions expressed in this presentation are subject to change without notice and none of them will have any liability whatsoever (in negligence or otherwise) for any loss
    whatsoever arising (including in respect of direct, indirect or consequential loss or damage), from any use of this presentation or its contents or otherwise arising in connection with this presentation.
    No duty of care is owed or will be deemed to be owed to you or any other person in respect of the information in this presentation.
    This presentation and the information contained herein does not and is not intended to constitute or form part of, and should not be construed as, any offer, invitation, solicitation or
    recommendation to purchase, sell or subscribe for any security, commodity or instrument or related derivative in any jurisdiction, nor does it constitute an offer or commitment to deal in any
    product, lend, syndicate or arrange a financing, underwrite or purchase or act as an agent or advisor or in any other capacity with respect to any transaction, or commit capital, or to participate in any
    trading strategies, and does not constitute investment, legal, regulatory, accounting or tax advice to the recipient. Neither the issue of the information nor anything contained herein shall form the
    basis of or be relied upon in connection with, or act as an inducement to enter into, any contract, investment activity or financial promotion. This presentation does not purport to contain all of the
    information that may be required to evaluate any investment in the Group or any of its securities and should not be relied upon to form the basis of, or be relied on in connection with, any contract
    or commitment or investment decision whatsoever. This presentation is intended to present background information on the Group, its business and the industry in which it operates and is not
    intended to provide complete disclosure upon which an investment decision could be made. The merit and suitability of an investment in the Company should be independently evaluated and any
    person considering such an investment in the Company is advised to obtain independent advice as to the legal, regulatory, tax, accounting, financial, credit and other related advice prior to making an
    investment. Investors should not subscribe for or purchase any securities except on the basis of information in a final form prospectus that may be published by the Company, which would supersede
    this presentation in its entirety.
    To the extent available, the industry and market data contained in this presentation has come from official or third party sources. Third party industry publications, studies and surveys generally state
    that the data contained therein has been obtained from sources believed to be reliable, but that there is no guarantee of the accuracy or completeness of such data. While the Company believes that
    each of these publications, studies and surveys has been prepared by a reputable source, the Company has not independently verified the data contained therein.
    In addition, certain of the industry and market data contained in this presentation comes from the Company's own internal research and estimates based on the knowledge and experience of the
    Group’s management in the market in which the Group operates. While the Company believes that such research and estimates are reasonable and reliable, they, and their underlying methodology
    and assumptions, have not been verified by any independent source for accuracy or completeness and are subject to change without notice. Accordingly, undue reliance should not be placed on any
    of the industry or market data contained in this presentation.

2
INVESTOR PRESENTATION - Year ended 31 December 2017 INVESTOR PRESENTATION, Spring 2017 - Gamesys
DISCLAIMER (CONT’D)
Certain statements in this presentation may constitute forward looking statements, beliefs or opinions, including statements relating to, among other things, the Company's business, financial
condition, performance, results of operation, potential new market opportunities, growth strategies, and expected growth in the Company’s markets and in the online gaming industry, together
with expectations regarding the Group’s financial outlook, revenue, adjusted net income, adjusted EBITDA, and diluted adjusted net income per share and the industry in which the Group
operates, as well as statements relating to the use and terms of the exchangeable shares. These statements may be identified by words such as "expectation", "belief", "estimate", "plan", "target",
"anticipation", "projection", "propose", "potential", "intention" or "forecast" and similar expressions or the negative thereof; or by statements that certain actions, events or results "may", "will",
"could" or "should" be taken, occur or be achieved, or by the forward-looking nature of discussions of strategy, plans or intentions; or by their context. These statements reflect the Company's
beliefs and current expectations and involve risk and uncertainty because they relate to events and depend on circumstances that will occur or may change in the future, are based on numerous
assumptions regarding the Company's present and future business strategies and the environment the Company will operate in and are subject to inherent risks and uncertainties that may cause
actual results to differ materially from those described or implied in these statements. Forward looking statements involve inherent known and unknown risks, uncertainties and contingencies
because they relate to events and depend on circumstances that may or may not occur in the future and may cause the actual results, performance or achievements of the Company to be
materially different from those expressed or implied by such forward looking statements, including but not limited to, the Company’s ability to secure, maintain and comply with all requirements
to carry out business in the jurisdictions in which it currently operates or intends to operate; governmental and regulatory actions; general business, economic and market conditions;
competition; expected growth of the online gaming market; the Company’s existing businesses and potential new market opportunities; anticipated and unanticipated costs; protection of the
Company’s intellectual property rights; the Company’s ability to successfully integrate and realise the benefits of its completed acquisitions; the expected earn-out payments required to be made
in connection with the Company’s completed acquisitions; and the Company may not obtain all of the benefits it expects to receive from the London listing. Many of these risks and uncertainties
relate to factors that are beyond the Company's ability to control or estimate precisely, such as future market conditions, currency fluctuations, the behavior of other market participants, the
actions of regulators and other factors such as the Company's ability to continue to obtain financing to meet its liquidity needs, changes in the political, social and regulatory framework in which
the Company operates or in economic or technological trends or conditions, the lack of available or qualified personnel or management, stock market volatility, taxation policies, changes in
regulation, foreign operations and the Group’s limited operating history, as well as the risk factors described in the Company’s most recent annual information form (the “AIF”), and other
publicly disclosed documents available under the Company’s SEDAR profile at www.sedar.com. As a result, you are cautioned not to place undue reliance on such forward looking statements.
Neither the Group nor any of its subsidiary undertakings, affiliates, agents or advisers or any such persons’ directors, officers, employees or agents, nor any other person accepts any
responsibility for the accuracy of the opinions expressed in this presentation or the underlying assumptions. Past performance should not be taken as an indication or guarantee of future results,
and no representation or warranty, express or implied, is made regarding future performance. Some of the information is still in draft form and will only be finalised, if legally verifiable, at a later
date. Forward looking statements speak only as of their date and the Group and its respective directors, officers, employees, agents, affiliates or advisers expressly disclaim any obligation or
undertaking to supplement, amend, update, keep current or revise any of the forward looking statements made herein, except where it would be required to do so under applicable law.
This presentation includes non-IFRS financial measures, including but not limited to, adjusted net income, adjusted EBITDA, and diluted adjusted net income per share. See "Non-IFRS Measures".
This presentation includes financial outlooks prepared by the Company relating to revenue, adjusted net income, adjusted EBITDA, and diluted adjusted net income per share to provide a
reasonable estimate of the Company’s potential earnings and revenues (subject to, among other things, the assumptions and risks discussed herein and in the AIF), and should not be relied upon
for any other purpose. These financial outlooks are not forecasts or projections of future results. The Company believes that the financial outlooks have been prepared on a reasonable basis,
reflecting management’s best estimates and judgment.
All historical financial and operational information relating to the Jackpotjoy business prior to the Company’s acquisition of the Jackpotjoy brands from the Gamesys group in this presentation is
based exclusively on information made available by the Gamesys group and its representatives, and has not been independently verified by the Company. Although the Company has no reason to
doubt the accuracy or completeness of the information provided by the Gamesys group, such information may be incomplete or inaccurate and any omission or inaccuracy in such information
could result in unanticipated liabilities or expenses, or may adversely affect the operational plans of the Company and its results of operations and financial condition.

 3
INVESTOR PRESENTATION - Year ended 31 December 2017 INVESTOR PRESENTATION, Spring 2017 - Gamesys
INVESTOR PRESENTATION

  1   Business Overview

  2   FY17 Financial Results

  3   Strategy and Opportunities

  4   Appendix – Additional Information
INVESTOR PRESENTATION - Year ended 31 December 2017 INVESTOR PRESENTATION, Spring 2017 - Gamesys
HIGHLY EXPERIENCED MANAGEMENT TEAM

     Source: Company information.
                           • Joined the Board of Jackpotjoy plc in August 2016
                           • Neil occupied key positions at Marston’s plc as Non-Executive Director from 2009-17. He also chaired
                              the Remuneration Committee and the Audit Committee during his directorship at Marston plc
                           • He also held board level positions for 25 years within the Leisure industry across Ladbrokes,
                              Compass, Allied Leisure and Gala Coral
                           • He advised the government on gambling matters as a member of the Responsible Gambling Strategy
       Neil Goulden
    Executive Chairman
                              Board (2008-11), and Chairman of The Responsible Gambling Trust (2011-16)

                           • Co-founded Jackpotjoy Group in 2013 and was appointed to the Board in September 2016
                           • Previously, Keith was a principal at Newcourt Capital, a boutique private equity group; he served as
                             the CFO and then President of Prolexic Technologies from 2004-08, the CFO and Business
                             Development Director of Elixir Studios, a UK based video gaming software developer, from 2001-04
                           • Keith also served in various corporate development, mergers and acquisitions, and gaming
                             consultant roles in London, England and Toronto, Canada
       Keith Laslop
           CFO
                           • Keith is a Chartered Accountant and CFA charterholder

                           • Joined Jackpotjoy plc in November 2017.
                           • Formerly, the CEO of Gala Leisure and managing director at Gala Coral Group where he oversaw the
                             successful turnaround plan of its bingo division
                           • Simon was consultant to Ladbrokes Coral on its merger integration plans
                           • Simon also served as managing director of the Mecca Bingo division at Rank Group and completed a
      Simon Wykes            number of other operational roles for various leisure and gaming businesses
        JOL CEO

5
                                                                                                                                    1
INVESTOR PRESENTATION - Year ended 31 December 2017 INVESTOR PRESENTATION, Spring 2017 - Gamesys
JACKPOTJOY PLC UPDATE

                                    No. 1 bingo-led operator globally, with the deepest liquidity

         1
      #1 Online
       Bingo                        Leading portfolio of online gaming brands, delivering high customer retention rates
     Business(1)
                                    Attractive demographic profile with a primarily female audience

                                    Highly cash generative business with 97%(2) operating cash flow conversion
          2
      Attractive
      Financial                     LTM Dec 17(3) group revenue of £305 million and Adj. EBITDA(4) of £109 million
       Profile
                                    Attractive revenue growth profile with all 3 business segments profitable

                                    Gaming revenue increased 14% in FY 2017(3) (up against previous comparable period),
          3
      Positive
      Trading                       Adj. EBITDA(4) increased 6% in FY 2017(3) (up against previous comparable period)
     Momentum
                                    Average Active Customers(5) grew 6% yoy in LTM Dec-17(3)

       Highly                      Highly regarded management team with focus on organic growth
      Regarded                     Supported by an experienced and strengthened Board
     Leadership
                                   Fully compliant with the UK Corporate Governance Code

       Highly
      Regarded
     Leadership

    12
    Source:   Company information and Gambling Compliance Research Services estimates. (1) Based on Gambling Compliance Research Services estimates for the UK in H1 2015. (2) Calculated as (Adj. EBITDA –
6             Capex)/ Adj. EBITDA. (3) Based on year ended 31 December 2017 figures. (4) Non-IFRS measure. See “Non-IFRS Measures”, “Reconciliation of Consolidated Adjusted EBITDA” on slides 31-33, and the
              Company’s news release dated 20 March 2018 (the “FY 2017 Release”), (5) For additional details, please refer to the information under the heading “Key performance indicators” in the FY 2017 Release
INVESTOR PRESENTATION - Year ended 31 December 2017 INVESTOR PRESENTATION, Spring 2017 - Gamesys
CORE SEGMENTS & BRANDS

                                                                                                                                                                                                              Mandalay

                                                              B2C Online Bingo (Jackpotjoy,                                         B2C Online Casino                                                 B2C Online Bingo
                                                                       Botemania)                                                (Vera&John, InterCasino)
                                                                  B2C Online Casino                                                                                                                    Affiliate Business
               Products                                                (Starspins)                                                      B2B White Label                                                (Casino Choice)
                                                                    B2C Social Slots                                                     (Plain Gaming)
                                                           (Jackpotjoy Social, Starspins Social)

          Software Provider                                                Gamesys group                                                     Proprietary                                               888 (Dragonfish)

               Licenses1                                               Gibraltar, Spain, UK                                          Malta, UK, Denmark                                                  Gibraltar, UK

          FY 2017 Revenue                                                   £211.3 million                                                  £73.2 million                                                 £20.2 million

    FY 2017 Adj. Net Income2                                                 £95.1 million                                                  £16.1 million                                                     £7.1 million

            Core Brands

     1.      Jackpotjoy licenses registered to the Gamesys group. Vera&John holds a restricted license for Denmark. Mandalay operates under 888 Holdings plc licenses
7    2.      Non-IFRS measure. See “Non-IFRS Measures” and “Reconciliation of Consolidated Adjusted Net Income” on slides 31-33, and the Company’s news release dated 20 March 2018 (the “FY 2017 Release”)
INVESTOR PRESENTATION - Year ended 31 December 2017 INVESTOR PRESENTATION, Spring 2017 - Gamesys
BUSINESS SNAPSHOT
LTM to 31 December 2017 Revenue Segmentation

    Geographic                                                             Regulatory Mix                                                            LTM December 2017 Revenue: £305m
                                                                                                                                                     LTM December 2017 Adj. EBITDA: £109m1
                       ROW
                        13%                                                    Unregulated                                                               Core markets
    Rest of Europe                                                                24%
         10%

       Nordics2
        14%                                        UK
                                                   63%                                                           Regulated
                                                                                                                   76%

    Product                                                              Divisions
                         Social                                                                   Mandalay
                          5%                                                                        7%

      Casino
                                                                           Vera&John
       31%
                                                                              24%

                                                Bingo-led
                                                   64%                                                                     Jackpotjoy
                                                                                                                              69%

       Source:    Company information for LTM 31 December 2017
8      1.         Non-IFRS measure. See “Non-IFRS Measures”, “Reconciliation of Consolidated Adjusted EBITDA” on slides 31-33 and the FY 2017 Release.
       2.         Nordics region includes Finland, Norway and Sweden.
INVESTOR PRESENTATION - Year ended 31 December 2017 INVESTOR PRESENTATION, Spring 2017 - Gamesys
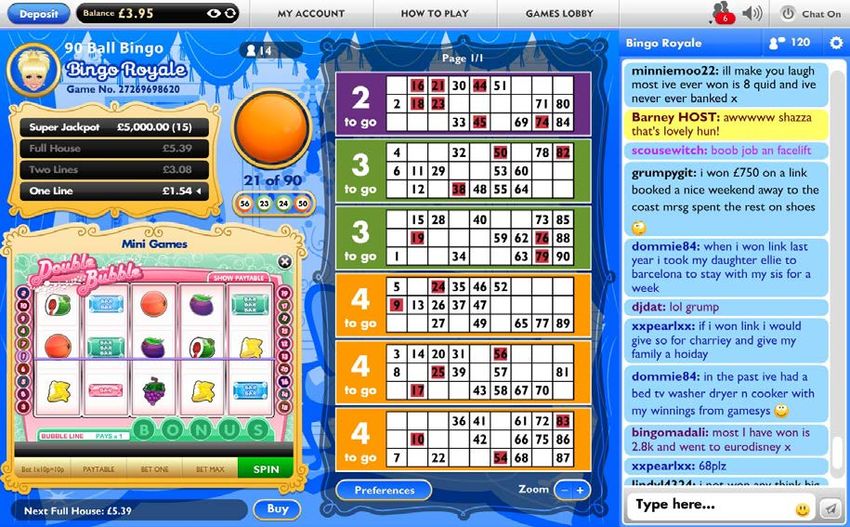
ONLINE BINGO CHARACTERISTICS

Engaging user interface facilitating significant cross-sell to casino games…

                                  Site Photos                                              Key Highlights

              4

                         3                                                     1   Bingo draws happening every 6 minutes

                                                                               2   Side games provide >80% of revenue

                  2                                                            3   Small and more “personal” forums
                              1

                                                                               4   Recreational gamers base

                                                                               5   Live chat feature

                                                                    5

9
INVESTOR PRESENTATION - Year ended 31 December 2017 INVESTOR PRESENTATION, Spring 2017 - Gamesys
FOCUSED ON THE FEMALE AUDIENCE
Active Members Gender and Age Split (1)
                                                                                                                                                            Product appeals predominantly to female
                             71%                      29%                                  36%                       64%
                                                                                                                                                             customers, who in general

                           62%                      38%                                     40%                        60%
                                                                                                                                                               −    are less targeted by sports book-led operators

                      42%                      58%                                            49%                        51%                                   −    are more attached to the social aspect

                           61%                      39%                                 27%                        73%                                      Use of mobile is skewed towards a younger

                                                                                                                                                             customer base which
                    35%                      65%                                               52%                        48%

                                                                                                                                                               −    constitutes the highest growth segment for
                              74%                      26%                             24%                        76%
                                                                                                                                                                    the Company
                                                                                                      < 35           > 35

 Average Age by Device (2)                                                                                                                                     −    higher spend per capita driven by more

                                                                                                                                                                    frequent play
                                                                                                                        All Devices

                   39                                      33                                      42                                      35
                                                                                                                                                                                                  Social / chat room
                                                                             Diverse
         Female focus                                                                                                               Multi-platform offering                                      community increases
                                                                            age ranges
                                                                                                                                                                                                   stickiness further

     Source:   Company information and Gamesys group data. (1) Based on monthly average across January to December 2017. (2) Average age of players acquired between January to December 2017.
10
INCREASINGLY PLAYED ON MOBILE

                                Mobile Gaming Revenue                                                                                                  Average Revenue Per User (GBP)(1)
70%                                                                                                                                                                                                           Mobile
                                                                                                                                   300

60%                                                                                                                                                                                                             67     Desktop
                                                                                                                                   250                                              Mobile
                                                                                                                                                                                               Desktop
                                                                                                                                                         Desktop
                                                                                                                                             Mobile                                                                      64
50%                                                                                                                                                                                      44
                                                                                                                                                                                                 40
                                                                                                                                   200                       44
                                                                                                                                                44

40%

                                                                                                                                   150                                                                          155
30%                                                                                                                                                                                             125
                                                                                                                                                             111                         140                             128
                                                                                                                                                111

                                                                                                                                   100
20%

10%                                                                                                                                  50
                                                                                                                                                             71                                  70             75       66
                                                                                                                                                66                                       59

     0%                                                                                                                                0
                     FY 2015                           FY 2016                           FY 2017                                                   FY 2015                                FY 2016                   FY 2017
                          Jackpotjoy             Vera&John               Costa Bingo                                                                         Jackpotjoy             Vera&John         Costa Bingo

          Source:   Company information (1) JPJ Sweden (GBP/SEK=0.088) and Botemania & Vera&John (GBP/EUR=0.88) converted on a constant currency basis at spot rate as of 16 March 18.
11                  Mobile as % of total.
RESULTS IN SUPERIOR CUSTOMER RETENTION
                               200

                               180

                               160

                               140

                               120
Net Revenue (£ in millions)

                               100

                                   80

                                   60

                                   40

                                   20

                                    0
                                     2002                                          2005                                             2008                                        2011                    2014                        2017

                                              2002          2003           2004           2005           2006           2007           2008           2009           2010       2011   2012   2013   2014      2015   2016   2017

                                    In the full year of 2017, 90% of the Jackpotjoy segment revenues came from players that joined in 2016 or earlier. A loyal customer base delivers
                                                             higher return on investment, greater visibility of revenue and higher operating margins for the group

                                    Source:   Company data and Gamesys group data for Jackpotjoy real money gaming business.
                              12              Revenue is defined as total amounts wagered by players less all winnings payable, bonuses allocated, and jackpot contributions.
CLEAR LEADER IN A MARKET WHERE SCALE IS INCREASINGLY KEY
UK Online Bingo-led Market Share(1)
                                                                                                                                                                                                         (2)
                                                                                       Others 16%
                                                                                                                                                                         22%

                                                                             4%

                                                                        5%

                                                                          8%
                                                                                                                                                                                     14%

                                                                                      9%
                                                                                                                                                                   12%

                                                                                                            10%              (3)

     Why does scale matter?
     Liquidity                                                                       Marketing efficiency                                                                     Procurement
     Market visibility                                                               Profitability boost                                                                      Ability to absorb regulatory change

       Source:   Gambling compliance research service systems, Company data.
13               (1) Data as of 2016, Gambling Compliance Research Services, equity research and Company information. (2) Consists of Jackpotjoy plc bingo-led brands. (3) Pro-forma for acquisitions.
CLEAR LEADER IN A MARKET WHERE SCALE IS INCREASINGLY KEY

                                                                                                     Market leadership generates
                High volume of players                        Jackpotjoy.com is a multi-             high levels of player liquidity
                                                               award winning site
                                                                                                     250k average active customers
                                                                                                      per month
                                                                                                     £282 million total real money
                                                                                                      gaming revenue

  More              Lower              More
                                                 Higher
frequent            waiting           jackpot
                                                jackpots
 games              times             winners

         Higher customer retention and
         acquisition of new customers
                                                                                                      User friendly mobile interface
                                                                                                       with innovative skins
                                                                                                      Vibrant social chat room
                                                                                                      Economies of scale for chat
       …creating high barriers to entry                                                                hosts and VIP hosts

                            Market leadership drives a “virtuous cycle” of a growing and loyal user base,
                                       enhanced liquidity and reinvestment in the business

     Source:   Company information.
14
OPERATING IN HIGHLY ATTRACTIVE MARKETS
                                                 UK Net Gaming Revenue(1)                                                                                               Key Highlights
(£ in millions)

  %    CAGR                                                                                                                                                   Long term structural growth in online
                                                                                                                                                               gaming mainly driven by
                                                                                                                                                               ‒   Technology – particularly
                                                                                  11%                                                                              increasing mobile penetration
                                                                                                                                                               ‒   Demographics / social change
                                                                                                                                                               ‒   Ongoing shift from brick and
                                                                                                                                                                   mortar to online
                                                                                                                                                              Online bingo and casino constitutes
                                                                                                                                                               c.29.1% of the total global online
                                                                                                                                                               gambling market(2)
                                                                                                                                                   2,487
                                                                                                                               2,382
                                                                                                           2,260                                              Attractive fundamentals compared
                                                                                       2,119
                                                                   1,959                                                                                       to sports betting
                                               1,781
                           1,493                                                                                                                               ‒   Sticky customer base with high
        1,225                                                                                                                                                      margins
                                                                                                                                                               ‒   Niche focus on the female
                                                                                                                                                                   demographic
                                                                                                                                                              UK is the largest market in the
        2014               2015                2016                2017                2018                2019                2020                2021        Online Bingo segment (c.11% of the
                                                                                                                                                               global market)
                                                              GB online Bingo and Slots

      Source:   Regulus Data dated January 2018. (1) Net gaming revenue excluding bonuses. (2) Based on global online gambling gross wins as of 2016.
15              Note: Numbers may not add up due to rounding.
DIVERSIFIED CORE TECHNOLOGY PLATFORMS WITH STRONG IN-HOUSE CAPABILITIES

                                 Jackpotjoy group Owns                                                            Key Protections                         Why is this a Positive?
                                                                                                                                                       Asset-light and highly cash generative
                                                                                                         B2C bingo non-compete in UK, Ireland,
                                                    Brands                                                                                              model
                                                                                                          Sweden and Spain until April 2019

                                                                                                                                                       Partnered with best in the industry
                                                                                                         Key dedicated personnel, with option to
                                                                                                          internalise all staff from April 2019
                                       Exclusive Content
                                                                                                                                                       Flexibility to move to alternative platform
                                                                                                                                                        and bring in-house if/when required
                                                                                                         Right to switch platform provider from
                                                                                                          April 2019
                                                                                                                                                       The Jackpotjoy Group is by far
                                     Intellectual Property                                                                                              Gamesys’ largest customer and
                                                                                                         Feature parity right(1)                       contributes a majority of Gamesys’
                                                                                                                                                        EBITDA

                                                                                                         Segregated player data and player funds
                                          Customer Data
                                                                                                         Annual service cost increase cap

                                                   Liquidity                                             Option to segregate liquidity

                                               Strong support from the Gamesys group, a key operating partner

     16

     (1) Time spent by staff developing new features, games, skins and products fairly apportioned.
16
DIVERSIFIED CORE TECHNOLOGY PLATFORMS WITH STRONG IN-HOUSE CAPABILITIES

                                                                                           Jackpotjoy Group’s Partnership Model with Gamesys Group
        Noel Hayden, founder of
         Gamesys remains an advisor                                                                                   Scope
                                                                                                                                 •   The operation of:
      LSEto the   Company                                                                                                            — Real Money Gaming
     Listing
    Achieved                                                                                                                           (Jackpotjoy UK, Jackpotjoy Sweden,
                                                                                                                                       Starspins, Botemania)
        276 Gamesys FTEs are
                                                                                                                                     — Social Gaming (Jackpotjoy Social
         dedicated to the Jackpotjoy
                                                                                                                                       Slots, Starspins Social Slots)
         business, c. 28% of Gamesys
         workforce                                                                                                    Services
                                                                                                                                 •   Platform and content
        Earn-out for non-Botemania                                                                                              •
                                                                                  Operating                                          Marketing and customer support
         assets concluded in June-17                                             Agreement to
         and Jackpotjoy group sets out                                               2030
         the strategic decisions with
         Gamesys group
                                                                                                                      Term       •   Operating Agreement until 2030 at JPJ
                                                                                                                                     option
                                                                                                                                 •   Content Agreement until 2040
        Significant protections
                                                                                                                                 •   Non compete until 2019
         against Gamesys financial
         risk – in the event Gamesys
         free cash balances fall below                                                                                Fees       •   The Jackpotjoy group pays
         £20 million, source code and                                                                                                — Platform Fee: 10% of NGR and then
         executable code to be held in                                                                                                 12.5% of NGR from April 2020
         escrow                                                                                                                      — Service Costs: At cost and then at
                                                                                                                                       cost +25% from April 2020

1
7
          Source:   Company information and Gamesys Limited latest publicly available group of companies’ accounts.
    17
INVESTOR PRESENTATION

  1   Business Overview

  2   FY17 Financial Results

  3   Strategy and Opportunities

  4   Appendix – Additional Information
CONSOLIDATED AND SEGMENTAL FINANCIAL PERFORMANCE
                              CONSOLIDATED RESULTS                                                                                                                 JACKPOTJOY

     Gaming Revenue                                             Adjusted EBITDA1                                                 Gaming Revenue                             Adjusted EBITDA1
                  14% (YoY)
                                                                                                                                                 12% (YoY)
                                                                               6% (YoY)                                                                                           12% (YoY)
                                        £304.6m                                                                                                                 £211.3m

         £266.9m                                                                             £108.6m                                      £188.2m
                                                                    £102.2m                                                                                                                   £95.1m
                                                                                                                                                                            £84.6m

          FY 2016                       FY 2017                     FY 2016                   FY 2017                                     FY 2016               FY 2017     FY 2016           FY 2017

                                             VERA&JOHN                                                                                                                MANDALAY

     Gaming Revenue                                             Adjusted EBITDA1                                                  Gaming Revenue                            Adjusted EBITDA1
                 28% (YoY)
                                                                                                                                                  (7%) (YoY)
                                                                               13% (YoY)
                                     £73.2m
                                                                                                                                                                                      8% (YoY)
       £57.0m
                                                                                                  £18.0m                                   £21.7m
                                                                     £15.9m                                                                                  £20.2m
                                                                                                                                                                             £6.6m               £7.1m

       FY 2016                       FY 2017                         FY 2016                     FY 2017                                  FY 2016            FY 2017        FY 2016              FY 2017

       Source:   Company information for the year ended 31 December 2017
19     1.        Non-IFRS measure. See “Non-IFRS Measures” and “Reconciliation of Consolidated Adjusted EBITDA” on slides 31-33 and the FY 2017 Release
Financial Track Record of Cash Generation and Growth
                                         Revenue (£ in millions)                                                                                     Adj. EBITDA(1) (£ in millions) and Adj. EBITDA margin

                                                                                                   305
                                                             269                                                                                                                                                                   109
                           235                                                                                                                                                                           102
                                                                                                                                                                      86

                        FY 2015                           FY 2016                              FY 2017                                                           FY 2015                             FY 2016                      FY 2017

                                                                                                                                   Adj. EBITDA margin:               37%                                38%                       36%

                           Adj. EBITDA(1) – Capex (£ in millions)                                                                                                     Net Debt + Earn-out / Adj. EBITDA(1)

                                                                                                  105                                                               4.7x
                                                             100                                                                                                                                        4.4x
                           85                                                                                                                                                                                                       3.6x

                                                                                                                                                                                3
                        FY 2015                           FY 2016                              FY 2017                                                          FY 2015                              FY 2016                      FY 2017
Adj. EBITDA – CAPEX :
     Adj. EBITDA
                         99%                                98%                                   97%
           28

                 Source:    Company information. Numbers may not add up due to rounding. FY15 pro-forma reflects full year performance of the Jackpotjoy segment as though it was acquired by the Jackpotjoy group on 1 January
         20                 2015. (1) Non-IFRS measure. See “Non-IFRS Measures”, “Reconciliation of Consolidated Adjusted EBITDA” on slides 31-33 the FY 2017 Release.
                            (2) CAGR FY15 – FY 17. (3) Calculation includes interest payable as well as net tax payable and excludes segregated funds held in accordance with the terms of the Jackpotjoy earn-out payment.
Consistently Strong Business Momentum

                                           LTM          LTM          LTM           LTM          LTM          LTM          LTM          LTM           LTM    LTM    LTM    LTM
Group KPIs(1)                               Q1           Q2           Q3            Q4           Q1           Q2           Q3           Q4            Q1     Q2     Q3     Q4               Observations
                                           2015         2015         2015          2015         2016         2016         2016         2016          2017   2017   2017   2017

                                                                                                          239,452 243,896 251,186 250,321
                                                                          208,795 216,220 222,082 235,584
                                                          196,750 204,073
                                          180,105 186,358
                                                                                                                                                                                  Average Active Customers grew to
 Average Active Customers
                                                                                                                                                                                   250,321 in LTM 31 Dec 2017, an
        per Month
                                                                                                                                                                                         increase of 6% yoy

                                                                                                           £22,626 £23,531
                                                                                           £20,856 £21,809
Average Monthly Real Money                                 £17,814 £18,808 £19,460 £20,254                                 Average Monthly Real Money Gaming
                                                   £16,855
         Gaming            £14,857 £15,167 £15,976                                                                          Revenue grew to £23.5m in LTM 31
     Revenue (£000’s)                                                                                                       Dec 2017, an increase of 16% yoy

                                                                                                                                                                   £90    £94    Average Monthly Real Money Gaming
      Average Monthly                                                                            £85          £87          £88           £86         £87    £89
                                             £82          £81          £81          £83                                                                                          Revenue per active customer of £94 in
Real Money Gaming Revenue
                                                                                                                                                                                 LTM 31 Dec 2017, an increase of 9%
  per Active Customer (£)
                                                                                                                                                                                                 yoy

        31
         Note:    Source: Company information.
  21             (1) For additional details, please refer to the information under the heading “Key performance indicators” in the FY 2017 Release
EBITDA TO OPERATING CASH FLOW BRIDGE

                                                               Operating cash flow – Year Ended 31 December 2017

                                                          £4.8m

                         £108.6m
                                                                                                                                                 £101.0m                  £97.8m
                                                                                      (£11.4m)                      (£1.0m)
                                                                                                                                                                (£3.2m)

                                           1                                                                                                                                      2
                     Adjusted EBITDA                Working Capital               Transaction costs                 Taxes paid                  Opt Cash Flow   Cap ex     FCFF
                                                                                        paid

     1.   Non-IFRS measure. See “Non-IFRS Measures”, “Reconciliation of Consolidated Adjusted EBITDA” on slides 31-33 and the FY 2017 Release
     2.   Free cash flow to the firm is operating cash flow less capital expenditures
22
LEVERAGE RATIOS – DEBT REFINANCING
                         Adjusted Net Leverage                                                           Debt Refinancing
                                                                                                       Loan                            PF Interest Cost
                                                    As at
                (£m)                                                                                 (£m GBP)      Interest Rate*         (£m GBP)
                                              31 December 2017
                                                                                 Existing 1L (USD)     194.3           8.07%                 15.7

 Gross Debt1                                            386.7                    Existing 1L (GBP)      53.3           7.00%                     3.7
                                                                                 Existing 1L (EUR)      17.6           6.13%                     1.1

 Earn-out2                                               59.6                    Existing 2L (GBP)      90.0          10.00%                     9.0
                                                                                            Total      355.2          8.30%                      29.5

 Cash3                                                 (59.0)
                                                                                 New 1L (GBP)           250            5.75%                     14.4
                                                                                 New 1L (EUR)           125            4.25%                     5.3
 Adjusted Net Debt4                                     387.3
                                                                                 Total                  375           5.25%                      19.7

 Adjusted Net
 Leverage4,5
                                                       3.57x                                    Pro Forma interest savings – £9.8M

Based on actual 31 December 2017 balance sheet.                                                                                     *Assumed LIBOR:
1.   Gross debt consists of GBP and EUR existing term loan, convertible                                                                      •    USD – 1.57%
     debentures, and non-compete clause payout.                                                                                              •    EUR – 0.50%
2.   Earn-out represents “contingent consideration” as reported under IFRS on                                                                •    GBP – 0.00%
     the balance sheet at 31 December 2017
3.   Excludes restricted cash
4.   Adjusted Net Debt consists of existing term loan, convertible debentures,
     non-compete clause payout and “contingent consideration” liability, less
     non-restricted cash.
5.   Adjusted Net Debt divided by LTM to 31 December 2017 Adjusted
     EBITDA of £108.6m.

23
INVESTOR PRESENTATION

  1   Business Overview

  2   FY17 Financial Results

  3   Strategy and Opportunities

  4   Appendix – Additional Information
IMPRESSIVE FINANCIAL TRACK RECORD OF CASH GENERATION AND GROWTH

    Tangible strategy to capture organic growth…

                                           Opportunities                                                                                                                       Strategy

                                                                                                                                     • Focus on organic growth and leverage scale to continue to
          1                 Leading positions in large
                            and growing markets
                                                                                                                                       take market share in existing markets
                                                                                                                                     • Recently received an operating license for bingo in Denmark

                                                                                                                                     • Continue to grow the market by targeted marketing aimed at

          2                 High retention of female audience
                            with further capacity for growth
                                                                                                                                       key demographics
                                                                                                                                     • Differentiated features to meet the preferences of the female
                                                                                                                                       audience

          3
                                                                                                                                     • Multi-channel product development – catching up with the
                            Increasing mobile penetration                                                                              broader online gaming market

                                                                                                                                     • Leverage best practices and optimise cross-selling across the

          4                 Multi platform strategy
                                                                                                                                       group (1)
                                                                                                                                     • Multiple branded sites provide significant competitive advantage
                                                                                                                                       over peers

     18
              (1) Following the final earn-out payment for the non-Botemania assets acquired from the Gamesys group, the Company is now permitted to cross-sell the Jackpotjoy and Starspins brands and product
25            (bingo and casino) across its different business segments.
SUMMARY HIGHLIGHTS

                                                  1              #1 Bingo-led operator globally with the deepest liquidity

                                                                2               Attractive demographic primarily focused on the female audience

                                                                      3               Distinctive brands deliver high customer retention

                                                                4               76%1 of revenue generated from regulated markets

                                                5                High growth, high margins and highly cash generative

     Source:   Company data pro forma for Jackpotjoy acquisition. Peer data based on reported regulated share from latest financial year
26   1.        Regulated earnings defined as revenue derived in markets with an established online gaming regime for YE 31 December 2017
INVESTOR PRESENTATION

  1   Business Overview

  2   FY17 Financial Results

  3   Strategy and Opportunities

  4   Appendix – Additional Information
EVOLUTION OF THE GROUP

                                                                               Acquired from Gamesys
                                                                                      (Apr-15)

                                              Mandalay

                                      Acquired from BGO
                                            (Jul-14)

       TSX
      Listing
     (Feb-14)

                                                                                                       London listing

                                                                                                       New branding

                                                            Acquired from
      Acquired from Amaya                                 Vera&John founders
             (Feb-14)                                          (Dec-14)

28    Source:   Company information
UK LISTING STRUCTURE

                                   Plan of Arrangement                                                                            Final structure2
                                                 Current
                                                  shares
                                                                                                                   ExchangeCo                    Jackpotjoy plc
         Intertain shareholders                                                                                    shareholders                   shareholders
                                                 Shares in
                                              Jackpotjoy plc
                                                                                                                                       100%
                                                     Current shares           Indirect
                                                                             subsidiary

                              Exchangeable
                                 shares1

                                                                      ExchangeCo

         UK incorporated Jackpotjoy plc acquired Intertain                                  Intertain shareholders received
          via a Plan of Arrangement                                                            – UK incorporated Jackpotjoy plc shares
                                                                                               or
                                                                                               – Exchangeable shares listed on the TSX issued by an indirect
                                                                                                    subsidiary of Jackpotjoy plc

           1.    Canadian shareholders only
29         2.    Following the re-listing
JACKPOTJOY SITE PHOTOS
     Jackpotjoy   Botemania   Jackpotjoy Social Slots   Jackpotjoy Sweden   Starspins

30
NON-IFRS MEASURES
This presentation makes reference to certain non-IFRS measures, including Adjusted EBITDA, Adjusted Net Income, and Diluted Adjusted Net Income per share. The Group
uses non-IFRS measures because management believes that they provide additional useful information regarding ongoing operating and financial performance. Readers are
cautioned that non-IFRS financial measures are not recognised measures under IFRS, do not have standardised meanings prescribed by IFRS, and should not be considered in
isolation or construed to be alternatives to revenues and net income/(loss) and comprehensive income/(loss) for the period determined in accordance with IFRS or as
indicators of performance, liquidity or cash flows. The Group’s method of calculating these measures may differ from the method used by other entities. Accordingly, the
Group’s measures may not be comparable to similarly titled measures used by other entities or in other jurisdictions.

Adjusted EBITDA, as defined by the Group, is income before interest expense including accelerated debt costs and other accretion (net of interest income), income taxes,
amortisation and depreciation, share-based compensation, independent committee related expenses, severance costs, (gain)/loss on cross currency swap, fair value
adjustments on contingent consideration, transaction related costs, foreign exchange (gain)/loss, and gain on sale of intangible assets. Management believes that Adjusted
EBITDA is an important indicator of the issuer’s ability to generate liquidity to service outstanding debt and fund acquisition earn-out payments and uses this metric for such
purpose. The exclusion of share-based compensation eliminates non-cash items and the exclusion of independent committee related expenses, severance costs, (gain)/loss on
cross currency swap, fair value adjustments on contingent consideration, transaction related costs, foreign exchange (gain)/loss, and gain on sale of intangible assets eliminates
items which management believes are either non-operational and non-routine.

Adjusted Net Income, as defined by the Group, means net income plus or minus items of note that management may reasonably quantify and believes will provide the reader
with a better understanding of the Group’s underlying business performance. Adjusted Net Income is calculated by adjusting net income for accretion on financial liabilities
including accelerated debt issue costs, amortisation of acquisition related purchase price intangibles and non-compete clauses, share-based compensation, independent
committee related expenses, severance costs, (gain)/loss on cross currency swap, fair value adjustments on contingent consideration, transaction related costs, foreign
exchange (gain)/loss substantially arising on the Group’s credit facilities, and gain on sale of intangible assets. The exclusion of accretion on financial liabilities and share-based
compensation eliminates the non-cash impact and the exclusion of amortisation of acquisition related purchase price intangibles and non-compete clauses, independent
committee related expenses, severance costs, (gain)/loss on cross currency swap, fair value adjustments on contingent consideration, transaction related costs, foreign
exchange (gain)/loss, and gain on sale of intangible assets eliminates items which management believes are non-operational and/or non-routine. Adjusted Net Income is
considered by some investors and analysts for the purpose of assisting in valuing a company.

Diluted Adjusted Net Income per share, as defined by the Group, means Adjusted Net Income divided by the diluted weighted average number of shares outstanding,
calculated using the IFRS treasury method, for the applicable period. Management believes that Diluted Adjusted Net Income per share assists with the Group’s ability to
analyse Adjusted Net Income on a diluted weighted average per share basis.

31
RECONCILIATION OF CONSOLIDATED ADJUSTED EBITDA

 (£ in 000’s)

                                                                   FY 2017    FY 2016

Net loss for the year                                              (67,897)   (40,643)
Interest expense, net                                               30,007     18,087
Accretion on financial liabilities                                  25,049     17,857
Taxes                                                                 701        (64)
Amortisation and depreciation                                       63,042     56,133
EBITDA                                                              50,902     51,370
Share-based compensation                                             1,429      2,264
Severance costs                                                       700       5,695
Fair value adjustment on contingent consideration                   27,562     49,382
Gain on sale of intangible assets                                   (1,271)        ̶
Independent committee related expenses                                  ̶       1,693
Loss/(gain) on cross currency swap                                  12,512    (34,070)
Transaction related costs                                            6,710     22,767
Foreign exchange loss                                               10,051      3,098
Adjusted EBITDA                                                    108,595    102,199

      Source:   Company data for the year ended 31 December 2017
32
RECONCILIATION OF CONSOLIDATED ADJUSTED NET INCOME

  (£ in 000’s)

                                                                                 FY 2017    FY 2016

Net loss for the year                                                            (67,897)   (40,643)
Share-based compensation                                                           1,429      2,264
Severance costs                                                                     700       5,695
Fair value adjustment on contingent consideration                                 27,562     49,382
Gain on sale of intangible assets                                                 (1,271)        ̶
Independent committee related expenses                                                ̶       1,693
Loss/(gain) on cross currency swap                                                12,512    (34,070)
Transaction related costs                                                          6,710     22,767
Foreign exchange loss                                                             10,051      3,098
Amortisation of acquisition related purchase price intangibles and non-compete
                                                                                  61,227     55,505
    clauses
Accretion on financial liabilities                                               25,049     17,857
Adjusted Net Income                                                              76,072     83,548

Diluted net loss per share                                                       £(0.92)    £(0.57)
Diluted adjusted net income per share                                             £1.02      £1.13

      Source:    Company data for the year ended 31 December 2017
33
You can also read