Institutional Presentation - Adecoagro
←
→
Page content transcription
If your browser does not render page correctly, please read the page content below
Institutional Presentation
Disclaimer

This presentation may contain certain forward-looking statements and information relating to Adecoagro S.A. and its subsidiaries (collectively, “Adecoagro” or the “Company”)
that reflect the current views and/or expectations of the Company and its management with respect to its performance, business and future events. Forward looking statements
include, without limitation, any statement that may predict, forecast, indicate or imply future results, performance or achievements, and may contain words like “believe”,
“anticipate”, “expect”, “envisages”, “will likely result”, or any other words or phrases of similar meaning. Such statements are subject to a number of risks, uncertainties and
assumptions. We caution you that a number of important factors could cause actual results to differ materially from the plans, objectives, expectations, estimates and intentions
expressed in this presentation. In no event, shall the Company or any of its subsidiaries, affiliates, directors, officers, agents or employees be liable before any third party
(including investors) for any investment or business decision made or action taken in reliance on the information and statements contained in this presentation or for any
consequential, special or similar damages.

No reliance may be placed for any purpose whatsoever on the information contained in this presentation or on its completeness. No representation or warranty, express or
implied, is or will be made or given by the Company or any of its affiliates or directors or any other person as to the accuracy or completeness of the information or opinions
contained in this presentation and no responsibility or liability is or will be accepted for any such information or opinions.

This presentation and its contents are proprietary information and may not be reproduced or otherwise disseminated in whole or in part without the prior written consent of the
Company.

This presentation does not constitute or form any part of any offer or invitation or inducement to sell or issue, or any solicitation of any offer to purchase or subscribe for, any
shares or other securities of the Company, nor shall it or any part of it or the fact of its distribution form the basis of, or be relied on in connection with, any contract therefore.

For further information regarding risks, uncertainties and assumptions which may affect our expectations of future performance, please see the registration statement we have
filed with the United States Securities and Exchange Commission on Form F-3, including, without limitation, the sections titled "Risk Factors" and "Forward-Looking
Statements" included within such registration statement.

                                                                 Non-GAAP Financial Measures and Reconciliation

This presentation contains unaudited non-GAAP financial information. We present Adjusted Consolidated EBITDA, Adjusted Segment EBITDA, Adjusted Consolidated EBIT
and Adjusted Segment EBIT as supplemental measures of performance of the Company and of each operating segment, respectively, that are not required by, or presented in
accordance with IFRS.
Our Adjusted Consolidated EBITDA equals the sum of our Adjusted Segment EBITDAs for each of our operating segments. We define Adjusted Consolidated EBITDA as
consolidated net profit or loss for the year or period, as applicable, before interest expense, income taxes, depreciation and amortization, foreign exchange gains or losses, other
net financial expenses and unrealized changes in fair value of our long-term biological assets, primarily our sugarcane and coffee plantations, and cattle stocks. We define
Adjusted Segment EBITDA for each of our operating segments as the segment’s share of consolidated profit from operations before financing and taxation for the year or period,
as applicable, before depreciation and amortization and unrealized changes in fair value of our long-term biological assets. We believe that Adjusted Consolidated EBITDA and
Adjusted Segment EBITDA are for the Company and each operating segment, respectively important measures of operating performance because they allow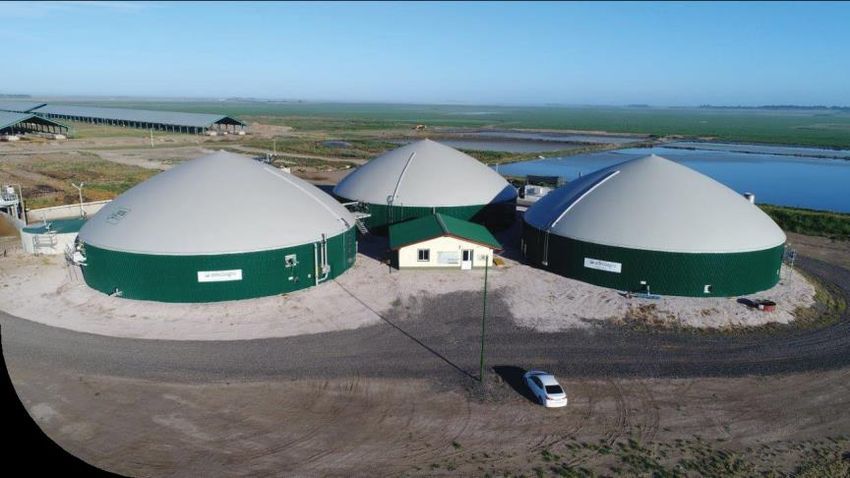
investors and others to evaluate and compare our consolidated operating results and to evaluate and compare the operating performance of our segments, respectively,
including our return on capital and operating efficiencies, from period to period by removing the impact of our capital structure (interest expense from our outstanding debt),
asset base (depreciation and amortization), tax consequences (income taxes), unrealized changes in fair value of biological assets (a significant non-cash gain or loss to our
consolidated statements of income following IAS 41 accounting), foreign exchange gains or losses and other financial expenses. Othercompanies may calculate Adjusted

Consolidated EBITDA and Adjusted Segment EBITDA differently, and therefore our Adjusted Consolidated EBITDA and Adjusted Segment EBITDA may not be comparable to
similarly titled measures used by other companies. Adjusted Consolidated EBITDA and Adjusted Segment EBITDA are not measures of financial performance under IFRS, and
should not be considered in isolation or as an alternative to consolidated net profit (loss), cash flows from operating activities, segment’s profit from operations before financing
and taxation and other measures determined in accordance with IFRS. Items excluded from Adjusted Consolidated EBITDA and Adjusted Segment EBITDA are significant and
necessary components to the operations of our business, and, therefore, Adjusted Consolidated EBITDA and Adjusted Segment EBITDA should only be used as a supplemental
measure of our operating performance of the Company, and of each of our operating segments, respectively. We also believe Adjusted Consolidated EBITDA and Adjusted
Segment EBITDA are useful for securities analysts, investors and others to evaluate the financial performance of our company and other companies in the agricultural industry.
These non-IFRS measures should be considered in addition to, but not as a substitute for or superior to, the information contained in either our statements of income or segment
information.

Our Adjusted Consolidated EBIT equals the sum of our Adjusted Segment EBITs for each of our operating segments. We define Adjusted Consolidated EBIT as consolidated net
profit or loss for the year or period, as applicable, before interest expense, income taxes, foreign exchange gains or losses, other net financial expenses and unrealized changes in
fair value of our long-term biological assets, primarily our sugarcane and coffee plantations, and cattle stocks. We define Adjusted Segment EBIT for each of our operating
segments as the segment’s share of consolidated profit from operations before financing and taxation for the year or period, as applicable, before unrealized changes in fair value
of our long-term biological assets. We believe that Adjusted Consolidated EBIT and Adjusted Segment EBIT are for the Company and each operating segment, respectively
important measures of operating performance because they allow investors and others to evaluate and compare our consolidated operating results and to evaluate and compare
the operating performance of our segments, from period to period by including the impact of depreciable fixed assets and removing the impact of our capital structure (interest
expense from our outstanding debt), tax consequences (income taxes), unrealized changes in fair value of biological assets (a significant non-cash gain or loss to our consolidated
statements of income following IAS 41 accounting), foreign exchange gains or losses and other financial expenses. Other companies may calculate Adjusted Consolidated EBIT
and Adjusted Segment EBIT differently, and therefore our Adjusted Consolidated EBIT and Adjusted Segment EBIT may not be comparable to similarly titled measures used by
other companies. Adjusted Consolidated EBIT and Adjusted Segment EBIT are not measures of financial performance under IFRS, and should not be considered in isolation or as
an alternative to consolidated net profit (loss), cash flows from operating activities, segment’s profit from operations before financing and taxation and other measures determined
in accordance with IFRS. Items excluded from Adjusted Consolidated EBIT and Adjusted Segment EBIT are significant and necessary components to the operations of our
business, and, therefore, Adjusted Consolidated EBIT and Adjusted Segment EBIT should only be used as a supplemental measure of our operating performance of the Company,
and of each of our operating segments, respectively.

We believe Adjusted Consolidated EBIT and EBITDA and Adjusted Segment EBIT and EBITDA are useful for securities analysts, investors and others to evaluate the financial
performance of our company and other companies in the agricultural industry.
Adecoagro
                         Overview

                                               High Quality &
        ESG                                   Diversified Asset
                                                    Base

                                                         Sugar,
Financial                                               Ethanol
Strategy                                                & Energy
                                                        Business

              Growth                 Farming & Land
              Strategy               Transformation
                                       Businesses
Diversified farming business
  Crops (Corn, Soybean, Wheat, Peanut Sunflower, Cotton)
  Rice
  Dairy

122k hectares of owned, croppable land spread across
the most productive regions                                     Producing each crop in the
                                                              right location driving low cost
Own handling, storage and processing facilities                         production

Acquisition of under-utilized and under-managed
farmland

Transforming land into its highest productive capabilities,
thus increasing its value
                                                                 Positive track record of
Strategic sales of mature land in order to recycle capital        consistent land sales
for new investment                                              generating strong returns

Fully-integrated producer of sugar, ethanol and energy

14.2 million tons of sugarcane crushing capacity

Focus on investment in farm and plant efficiency to drive
returns                                                        Focus on building a unique
   Co-generation capacity
   Owned sugarcane plantations
                                                               business model extracting
   Mechanized farm operations                                     higher value per ton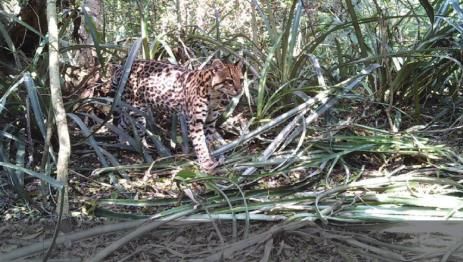
Regional Expansion Consolidation
First Steps Second Growth Wave
and entry into S&E Pre- IPO
Foundation Land purchases in Uruguay and
NYSE listing
75,000 ha of ERP implementation
Brazil
Consolidation of SE&E cluster.
agriculture production Entry in the SE&E business
Initiation in the dairy business
500 2,373 1000
2,274
900
000 800
1,301 1,454
S&E (TRS th tons)
700
Total Farming (th. tons)
500 600
Area Under Management has)
463 472
500
000 400
300
500 973 919 200
75
100
0 0
2002 2003 2004 2005 2006 2007 2008 2009 2010 2011 2012 2013 2014 2015 2016 2017 2018
Regional Expansion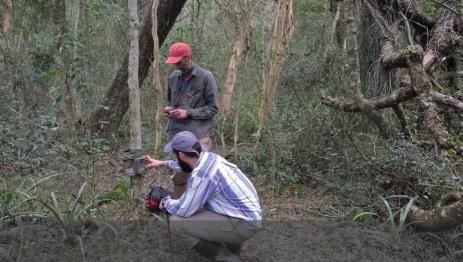
Adecoagro
                         Overview

                                          High Quality &
        ESG                              Diversified Asset
                                               Base

                                                   Sugar,
Financial                                         Ethanol
Strategy                                          & Energy
                                                  Business

              Growth             Farming & Land
              Strategy           Transformation
                                   Businesses
3 Sugar & Ethanol mills
  3 Rice mills
  3 Free Stall Dairies                                                   Mato Grosso do Sul
  10 Grain conditioning
  & storage plants                                                       13k owned ha
                                                                         13 MT of Sugarcane crushing
                                                                         153k ha Sugarcane planted

  28 farms
  226k hectares of owned
  land(1)

                                        Northwest Argentina
                                                     t
                                        48k owned ha                                                                                  Minas Gerais
                                                                                                                                      1.2 MT of Sugarcane crushing

                        Argentina
Brazil
                        & Uruguay
47%
                           53%                                                                                      Uruguay

                                                       e                                                            3k owned ha
                                         Humid Pampas
                                         35k owned ha
                                         3 Free Stall Dairy Facilities
                             Uruguay     4 Grain handling and
                                         storage facilities
                               2%
                                                                                                       Northeast Argentina                       Source: Company’s fillings.
Argentina                                                                                                                                        (1)Excluding minority interest.
  92%                          Brazil                                                                  126k owned ha; 40k irrigated
                                6%                                                                     3 rice mills
                                                                                                       4 grain handling and
                                                                                                       storage facilities
Adecoagro
                         Overview

                                               High Quality &
        ESG                                   Diversified Asset
                                                    Base

                                                         Sugar,
Financial                                               Ethanol
Strategy                                                & Energy
                                                        Business

              Growth                 Farming & Land
              Strategy               Transformation
                                       Businesses
AGRICULTURE
AGRICULTURE INDUSTRIAL PRODUCTION
PRODUCTION
OVERVIEW
OVERVIEW OVERVIEW FLEXIBILITY
FLEXIBILITY
Ha owned cane State of the art mills Tons of Sugar storage
Ha own land Tons of crushing capacity m3 of Ethanol storage
Own cane processed1 Tons of sugar capacity
Bulk VHP sugar
Mechanical harvest m3 of Ethanol capacity
Bagged VHP sugar
White sugar
Average distance MWh export Anhydrous ethanol
Hydrous ethanol
Energy
Tractors and trucks Mix (Sugar/Ethanol)
Agricultural employees2 Industrial employees Notes
1 December, 2018
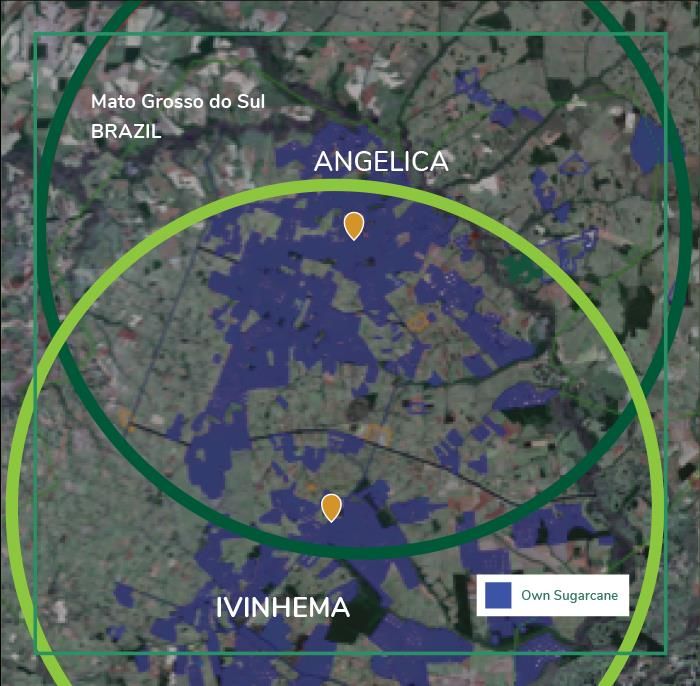
2 December, 2018Adecoagro’s cluster in MS
Two mills, 45km apart
Extensive room for organic growth
Possibility to crush sugarcane the whole year
Own sugarcane plantation
Both mills connected to the local power grid
High sugarcane yield and TRS potential
One large plantation supplying more than one mill
Centralized management team
Efficient internal logistics
Commercial flexibility
Harvest efficiencies and flexibilityLow competition
High TRS/ha potential
Continuous Harvest
High cogeneration efficiency
ICMS Tax incentive
Production flexibilitySummary of Main Competitive Advantages: Cost Savings vs Traditional Areas (US$ cts/lb) Country Competitiveness Comparison
SOUTH AFRICA
FRANCE
AUSTRALIA
GUATEMALA
THAILAND
BRAZIL
2018 Total cash cost build-up (US$ cts/lb)
+33%
Fixed Cost: 90% / Variable Cost: 10%
75% cost: 90% / 25% cost: 10% 1.8
2.4 0.4 3.9
1.1 (1.1) 1.7
(1.7)
1.9
2.0 11.9 (4.7) 12.5
10.8 10.100 10.1 10.1 9.4 9.1
8.4 8.4 8.4
7.2 7.2 7.2 7.2
5.3
3.3 3.3
(1) (2) (3)
Harvest Cane Crop Leasing Total Industrial Third party ICMS rebate Total Total SG&A Total Depreciation Cash Cost Maintenance Energy Total Cash 2019F Industry
Depreciation Maintenance Agricultural Costs cane Industrial Producion Producion CAPEX Revenues Cost
Cost Costs Cost Cost + Exp
Source: Company’s fillings.
(1) Tax incentive of 32MUSD (ICMS) is offset by extra freight cost to port.
(2) Includes maintenance capex for planting area and interharvest and ag. equipment.
(3) Considering BRL/USD FX rate of 3.93.Low competition for land fromnearby mills Average Lease Cost (tons/ha/year)
Adecoagro Traditional Areas2
18.4
Mato Grosso do Sul, BRAZIL Ribeirão Preto, BRAZIL 11.8 11.7 11.9 11.8
100km radius: 12 mills 100km radius: 40 mills
Farmer Margins: Cattle vs. Sugarcane1
(R$/ha)
+108%
The Opportunity Cost of Land is
Cattle, Which Has Significantly 2015 2016 2017 2018 Traditional Areas²
Lower Margins Than Sugarcane
Leasing land for sugarcane
production is significantly more
828 profitable for the landowner than Cost Advantage(3):
raising cattle + 0.6 US Cts/lb
399
Source: Company’s fillings. Source: Company’s fillings.
Cattle Sugarcane ¹Consecana price (2018) – 0.59 3BRL/USD Fx: 3.65
BRL/kg
²PECEGE/ESALQ (17/18)Energy Exported (‘000 MWh)
Energy Exported per ton crushed
Enough energy
for 1.2 million people
(KWh/ton)
High energy export per ton crushed
Efficient equipment: Low energy consumption
Cost Advantage :
63 + 1.0 U$S Cts/lb High margin and predictable cash flow
Source: Company’s fillings.
¹ Source: CTC. Annual contracts due to the continuous
harvest
28
2010 2011 2012 2013 2014 2015 2016 2017 2018Commercial Benchmark: Logistics Overview
Adecoagro’s MS Cluster vs. Sao Paulo (US$ Cts/lb)1
Mills located nearby main rail and
l road Infrastructure
MG Distance to terminal
Cluster Mills: 858km
(Railroad and highway)
MS UMA UMA Mill: 422km
Mills (Railroad)
Sugar freight Ethanol freight ICMS Ethanol Logistics and Tax Cluster
to the port to Paulin- Tax benefit differential of SP Mills Sugar Freight Cost:
ea-SP state Cluster: R$ 148/ton
Paulínia
Maringá rail Santos port UMA: R$ 90/ton
ICMS tax benefit more than
transboarding
compensates the higher logistics cost:
Ethanol Basis:
Paranaguá port
Cost Advantage: R$ 60/m³ discount over
+ 0.8 U$S Cts/lb Paulínia-SP price
Tax Incentives Improve Ethanol Parity in MS
9.02% of ICMS tax rebate on ethanol sales
MGS-RP
Hydrous Premium (%)
Hydrous and Anhydrous ethanol are ~10% higher in
US$ cts/lb, compared to Ribeirão Preto
Adecoagro has storage capacity equivalent to 30%
of total current production, providing flexibility to
the commercial strategy
Source: Company’s fillings.
*Source CEPEA Medium Ethanol Prices (2017/2018)
¹Average Freight from Ribeirão-SP (R$90/ton); Cepea Average Ethanol Prices (2018);
2013 2014 2015 2016 2017 2018 BRL/USD FX rate of 3.65 and Ethanol tax benefit: of 9.02% rebate on ethanol interstate
sales (valid until 2032)Regional characteristics Effective Miling Hours
Average Rain - Center South vs Mato Grosso do Sul(MS)
270
32%
Center South
220 Cluster
Average Rain (mm)
170
120
5,691 4,944 5,373
4,468 4,321
70
2014 2015 2016 2017 2018
20
Jan Feb Mar Apr May Jun Jul Aug Sep Oct Nov Dec
More rain in the traditional season and Less rain in the offseason Turning disadvantage to advantage Project Cost Advantage1:
Strategy is a perfect fit to our region Implemented and tested Gradually
+ 1.0 US Cts/lb
Use of time (Continuous Harvest vs. Traditional) Employed / million ton of milledcane
100%
Fixed Cost dilution
90% Savings in industrial
914
816
maintenance expenses
80%
604 624
70% 539
Center South Season
60% MS Season
50% Continuous Harvest
40%
30%
2014 2015 2016 2017 2018
20%
10% Source: Company’s fillings.
1 BRL/USD FX rate of 3.65.Estimated based on the simulation of the
fixed cost dilution when the effective milling hours goes from 4,700
hours (average effective milling)
Jan Feb Mar Apr May Jun Jul Aug Sep Oct Nov DecDirect Effects
Carbon credit sale will increase revenue/decrease cost to
R$50/m3 (0.3 cts/lb sugar equivalent)
Indirect Effects
Demand shift towards hydrous ethanol due to higher gasoline
prices. Consequently, increase in ethanol parity.
Floor to sugar prices.
Otto Cycle
Producers sell Sell to final Ethanol
Ethanol Ethanol to: Fuel consumer
Producer Distributor
Gasoline
Distributors are
obliged to buy Cbios
in order to compen-
Authorized sate pollution from
producers to fossil fuels
issue Cbios
Determines the annual credit of Cbio
CBio
*considering a BRL 50 per CBIO contractHistorical Price Evolution in Sugar Equivalent (cts/lb) SE&E EBITDA distribution
26
24 11.2% 13.8%
17.6% 16.9%
22
2017 2018
20 27.1%
Energy 46.7% 34.5%
18
46.2%
Sugar
16
14 Ethanol
12
59.2%
10 48.6%
42.2%
36.6%
Anhydrous MS (cts/lb) Sugar (cts/lb) Hydrous MS (cts/lb)
2015 2016 2017 2018
Ethanol Production Mix (in %)
Increase of up to ~80%
in ethanol production
Sugar 44% 50% 47%
26% mix.
Only with ~ 1 M USD in
Ethanol 74% investments.
56% 50% 53%
Cost Advantage:
12M15 12M16 12M17 12M18
+ 0.3 US Cts/lbAdecoagro
Overview
High Quality &
ESG Diversified Asset
Base
Sugar,
Financial Ethanol
Strategy & Energy
Business
Growth Farming & Land
Strategy Transformation
BusinessesFarming Business Segments
Capacity to accommodate 8,300 cows Cutting-edge technology and
best practices
Potential to double the size over the next
couple years Solid track record, with
around 79k ha sold
Productivity of 36.7 Liter/Cow/Day,
67% above Argentina’s average Capital gains for over US$200mm
Low cost producer, positioned in the far left Cash generation over US$300mm
of the cost curve
Sustainable business model Market leader in the sector
Total production over 800,000 tons per year
Production of Soybean, Corn, Wheat, Rice,
Sunflower and Cotton
More than 220,000 hectares of planted area per year, 65% in own land
Farms concentrated in Argentina’s Humid Pampas, an extremely fertile regionSoybean Cost (USD per ton) Corn Cost (USD per ton) Rice Cost (USD per ton)
Production costs Selling costs Production costs Selling costs Production Costs
Fobbing costs Export Tax Fobbing costs Export Tax Selling costs
241
227 215 188
10
213 196 10
191 9
165
61 150 12
84 174
82 14
84 10
97
3 97
120
13
13 10
40 6 179
31 13
13 153
161 170 136
31 36
123
104
85 90
51 51
Adeco Humid Illinois Mato Adeco Humid Illinois Mato Adeco Uruguay Rio Grande
Pampas Grosso Pampas Grosso do Sul
Adecoagro is the lowest cost producer in the most competitive region to produce grains in the world
Source: Adapted from University of Illinois 2017, Agrianual 2016, Margenes Agropecuarios magazine and company´s information 2017.
Source: IIRGA, Conab, Company data
* Assumes 30% tax, which will be reduced to 5% per year and readjusted up to 15%.Highlights since inception Land Transformation Process
Over 10mm ha Full Rotation &
evaluated High Yields
* Reaching its highest
production capabilities
Medium
Over 170k ha put into Low-Yield Crops
* Adecoagro applies a
production careful process to
Natural Grasses develop the land and
achieve its highest
*Identify underman-
Cash generation over aged land
production potential
*Design specific
US$300 million production model
*Acquire land
Capital gains for over
US$200 million
Strong Track Record of Capitalizing Gains from LandTransformation
40
35
30
25
20
15
10
5
- -
0
2006 2007 2008 2009 2010 2011 2012 2013 2014 2015 2016 2017 2018 2019
Sold ha 3,507 8,714 4,857 5,005 5,086 2,439 9,425 14,176 12,887 10,905 - - 9,300 6.080
% Over N.A. N.A. 33% 20% 19% 23% 23% 17% 28% 55% - - 37% 34%
AppraisalAdecoagro
Overview
High Quality &
ESG Diversified Asset
Base
Sugar,
Financial Ethanol
Strategy & Energy
Business
Growth Farming & Land
Strategy Transformation
BusinessesStable Adjusted Free Cash Flow fromOperations despite volatile commodity price environment
Soybean
Wheat
Corn
Sugar
81.6 133.3 79.1 79.8
2015 2016 2017 2018
Expansion CAPEX decreasing and a FCF increasing from 2018 with most of the debt due on 2024 onwards
Debt Amortization Schedule Debt Currency
(in Million USD) Structure
Argentine Pesos
US Dollars
Brazilian Reals
Average Interest (1)
BRL 4.6%
USD 5.8%
(1) As of March 31st 2018.Enhancing EBITDA from USD 288 MM in 2017 to USD 454 MM in 2021 in all segments by
securing a strong business model and investing USD 355 MM.
Crops SE & E Dairy Rice Land
Transformation
2 already approved grains Planting expansion of Two free-stalls and a 2MW Acquiring 8 planters and 5 Average sale of 2 farms to
conditioning & storage 51,000 has. bio-digester will be harvesters to reduce rotate our portfolio
facilities will start operating constructed between 2017 harvesting and planting triggering capital gains and
in 2019 and will be Industrial expansion and 2021. costs and also irrigation and EBITDA.
expanded in 2020. capacity of Ivinhema and labor costs.
Angelica Investment of USD 70MM
Increase in leased area. is planned for a milk Install facilities and silos to
Steam generation processing plant, with a dry thus enhance rice
improvement, cane production capacity of 825 quality and lower logistic
reception, juice treatment KLts/day. costs.
and sugar factory
From 2023 on, we will be Zero level: increase has. By
Acquisition of agricultural able to grow one freestall 5.5k in 2018.
equipment in planting, per year with our own
harvest and treatment. cows. Parboil & packaging
faclilities and install a white
rice warehouse facility.129
98
74
70 39
20 54
18
59 55
50 16
36
9
7
2017 2018 2019F 2020E 2021EAdecoagro
Overview
High Quality &
ESG Diversified Asset
Base
Sugar,
Financial Ethanol
Strategy & Energy
Business
Growth Farming & Land
Strategy Transformation
BusinessesNet Sales1 Evolution ($ MM) Sales Diversification (2017FY)
899
Sugar and Ethanol 841 Energy,
Soybean,
Farming and Land 769 6.6% Corn, 5.0%
11.0%
695
649
625 Wheat , 4.3%
592
576 Sunflower, 0.2%
530 569
470
379
402 269 297 375
Ethanol, 38.0%
259 Rice, 13.0%
214
244 204
98
51
322 327 316 323 299
271 274 273
193 216 198
Dairy
Sugar, 16.6% Others
4.3%
1.0%
2008 2009 2010 2011 2012 2013 2014 2015 2016 2017 2018
Notes
(1) Net Sales is calculated as Sales less sugar and ethanol sales taxesAdj. EBITDA Evolution ($ MM)
298 314
276
216 215
181 238
150 265
142 247
154
167
115
96
110 98
52
29 3
89 85 96
59 66 67 69 70
52 54 51
-7 -19
-27 -22 -27 -25 -23 -23 -22 -21 -22
-23
-22
2008 2009 2010 2011 2012 2013 2014 2015 2016 2017 2018
Farming & Land Transformation Sugar and Ethanol CorporateAdecoagro
Overview
High Quality &
ESG Diversified Asset
Base
Sugar,
Financial Ethanol
Strategy & Energy
Business
Growth Farming & Land
Strategy Transformation
BusinessesSustainability & Profitability: a natural link
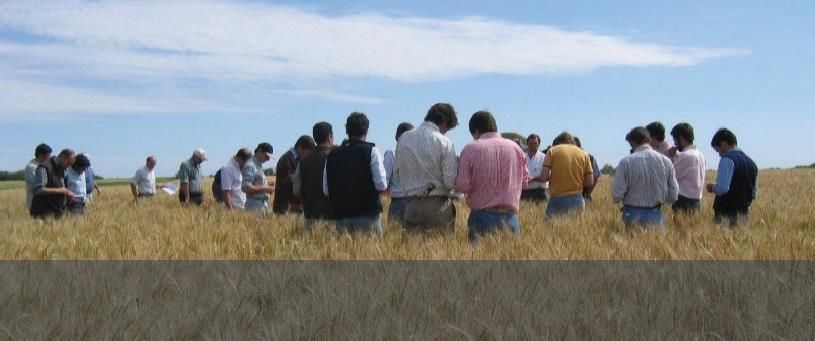
We generate huge and positive impacts in the local communities

More than 6,600 new jobs were created frominception
Local communities are located in poor and isolated rural areas

Adecoagro is constantly engaging in Nutrition and Education Programs

                                                           We care about our people’ssafety

                                                                                           250
                                                                                                                Argentina - Working-Accidents Index
                                                                                                                (*)
                                                                                                                                                  Crops           Rice           Dairy
                                                                                           200
Training programs are the base of our Safetystrategy                                                                                               Others (**)           Total

                                                                                           150
We provide our people with proper Personal Protective                                                                                        (*) Total accidents per 1,000 workers;
                                                                                                                                                  (**) Others: administration, cattle
                                                                                           100
Equipment Working accidents are below the standards of the
                                                                                            50
sector

                                                                                                         2011     2012    2013        2014       2015            2016            2017

                                               Sustainability implies an specific approach to eachbusiness

Is a way of thinking and acting                                                                                                  Our People and local communities

Delivers no one-size-fits-all recipe                                                                                             Environmental health & Land use

Requires strategies adapted to local circumstances                  Interdisciplinary teams discussing                           Efficient and Sustainable Models
                                                                    sustainable strategy case by case
Our land use strategy is aligned with our Sustainability vision
To accomplish with local Biodiversity regulations
To fulfill particular commitments (World Bank standards)
To avoid development of heavy forests or massive wetlands
Trail cameras installed to monitor local fauna Ocelot caught by trail camera (Ombu farm)
No Till is essential for a healthysoil
Training programs are the base of our Safety strategy
We provide our people with proper Personal Protective Equipment After harvest, crop residues remain untouched
on the soil as amulch
Working accidents are below the standards of the sector
Residues create a permanent soil cover
protecting it from erosionrisks
Residues slowly decompose, catalyzing
biological processes that increase soil organic
matter
Special no-till planters cut through residues and
plant the seeds into soil without plowing or
disking
Other actions
We are certifying some products with Sustainable, Safety or Quality labels such as RTRS, Bonsucro, EPA, HACCP, FSSC 2200
We are implementing Best Practices such as crop rotations, integrated pest management and soil and water analysis
We have developed Precision Leveling in our rice farms, which strongly reduces water and energy consumption
We have set standards of Animal Welfare in our Dairy operations (cow comfort, feed and water quality, health protocols)We are re-using organic residues toproduce Biogas
Cow manure is used by our digesters to produce biogas
Biogas fuels a CHP engine with 1.4 MW power
capacity
+9,000 MWh/year of Renewable Energy is sold to the grid
GHG emissions are strongly reduced by transforming
methane into CO2
In addition to those benefits, manure turns into highvalue
bio-fertilizer which goes back to thefields
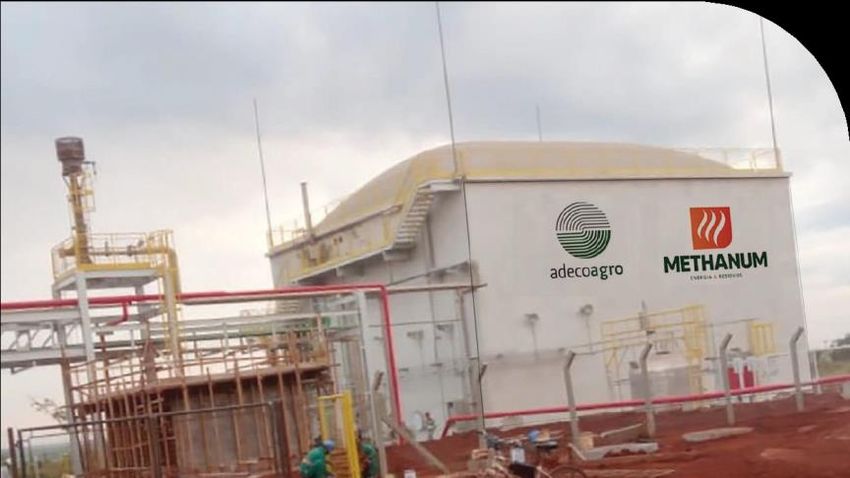
We are developing and innovative technology to usethe
vinasse, a typical by-product of ethanol production
Vinasse is used to feed a digester in order toproduce biogas
Biogas could fuel a boiler or a CHP engine to produce
electricity
Biogas could be used as portable fuel (bio-methane) to power
trucks, tractors and other vehicles.
The by-product of the digester goes back to the fields as
enhanced bio-fertilizerIntegrated Sugarcane system is the most efficient agro-model as it reuses all residues
Rainfall Solar Energy CO2 O2 Fertilizers
Agrochemicals
Diesel
ELECTRICITY
BIO-FERTILIZER
PLANTATION
COMPOST
(ASHES)
DIGESTER
BAGASSE
COMPOST BOILER &
MILL POWER PLANT
ELECTRICITY
VINASSE
JUICE CONCENTRATOR
VINASSE
SUGAR SUGAR PLANT ETHANOL PLANT ETHANOL
Sugarcane is one the most Mechanical harvest leaves By-products from We have recently added a Biogas is being used to
efficient crops in the world (C4 great amounts of industrial processes are digester to process vinasse increase electricity
photosynthesis plant) crop-residues on the fields re-used on the fields as into biogas production
protecting the soil bio-fertilizers (vinasse,
filter cake)One Class of Common Shares
CLASS OF SHARES Equal Voting Rights per Share. No Controlling Shareholder
ELECTION OF
BOARD OF DIRECTORS By Majority of votes in AGM. Staggered Basis.
BOARD Highly Qualified and experienced.
COMPOSITION Expertise in Business/Finance/Agro industrial
BOARD
INDEPENDENCE Majority of Independent members
HIGHEST
STANDARDS
BOARD
COMMITTEES Compensation / Risk and Commercial / Strategy / Audit OF
CORPORATE
MANAGEMENT
GOVERNANCE
Professional and Interdisciplinary Management Team
COMPOSITION Sharing Values
MANAGEMENT
COMMITTEES SE&E / Farming / Commercial / Internal Audit
MANAGEMENT Subject to financial performance.
COMPENSATION 50% of variable compensation in restricted shares
Whistleblower / Insider Trading / Business Conduct and Ethics / FCPA /
POLICIES SOXManagement Board Members
Name Years with the Name
Position Years Past experience company Position Past experience
Mariano Bosch Agribusiness Plinio Mussetti Partner in the private equity group Pragma Patrimonio. Over 20
47 Since inception
CEO entrependeur Chairman years of CEO and Private Equity experience
Charlie Boero Hughes Noble Group/
51 9 Mariano Bosch Co-founder and CEO of Adecoagro. Over 20 years experience of
CFO Citibank N.A.
Director/CEO managerial experience in the agribusiness sector
Emilio Gnecco Marval, O´Farrel &
42 Since inception
Chief Legal Officer Marval
Alan Boyce Co-founder of Adecoagro and Board Member since inception. Over
Director 20 years of financial markets and managerial experience
Commercial
Marcelo Sanchez
55 Agribusiness Since inception
Chief Commercial Officer
entrepreneur
Former Minister of Finance of Chile (2006-2010). Former president
Andres Velasco
of the Latin American and Caribbean Economic Association from
Renato Junqueira Director
2005 to 2007. Dean of new school of public policy at LSE
Director of Sugar & 40 Usina Moema 7
Ethanol Operations
Daniel Gonzalez Former President for the Southern Cone of Merrill Lynch. Current
Pepe Imborsiano Director Chief Executive Officer of YPF
Director of business 47 Agribusiness sector 14
development
Guillaume Van Der Linden Sr. Investment Management at PGGM. Over 20 years of financial
Leonardo Berridi Agribusiness sector Director and managerial experience
57 13
Country Manager for Brazil
Ezequiel Garbers Mark Schachter Managing Partner of Elm Park Capital Management. Over 10 years
Agribusiness sector Director of financial markets and managerial experience
Country Manager for 52 Since inception
Argentina & Uruguay
Pilar Lacoste Ivo Sarjanovic
25 years in Cargill international. CEO of Alvean until 2017
Director of consumer 40 Consumer & Retail 1 Director
products
Juan Ignacio Galleano Alejandra Smith Founder of Edge management consulting firm. Over 20 year
29 Investment Banking 4 Director experience in retail and consumer.
Head of Investor RelationsTop 30 Public Shareholders Holder Name Shares US$ MM(1) % O/S AL Gharrafa Investment Co 15,983,265 112,042,688 13.6% Stichting Pensioenfonds Zorg en We 15,381,385 107,823,509 13.1% EMS Capital LP 10,073,000 70,611,730 8.6% Route One Investment Co LP 9,800,623 68,702,367 8.3% Brandes Investment Partners LP 8,138,682 57,052,161 6.9% Jennison Associates LLC 6,115,520 42,869,795 5.2% Management & Directors 5,781,000 40,524,810 4.9% Point72 Asset Management LP/Old 2,667,700 18,700,577 2.3% AFP HABITAT S A 2,467,454 17,296,853 2.1% Principal Financial Group Inc 1,737,604 12,180,604 1.5% Norges Bank 1,387,901 9,729,186 1.2% GIC Pte Ltd 1,385,941 9,715,446 1.2% PointState Capital LP 1,271,321 8,911,960 1.1% Grantham Mayo Van Otterloo & Co LL 1,078,753 7,562,059 0.9% DE Shaw & Co LP 868,196 6,086,054 0.7% Administradora de Fondos de Pensio 623,731 4,372,354 0.5% Almitas Capital LLC 582,797 4,085,407 0.5% BlackRock Inc 569,543 3,992,496 0.5% Parametric Portfolio Associates LL 504,591 3,537,183 0.4% Banque Degroof Petercam SA 483,766 3,391,200 0.4% Claret Asset Management Corp 450,763 3,159,849 0.4% Eaton Vance Corp 408,706 2,865,029 0.3% Delta Asset Management SA/Argentin 387,118 2,713,697 0.3% Aviva PLC 350,841 2,459,395 0.3% 683 Capital Management LLC 350,000 2,453,500 0.3% Deutsche Bank AG 338,568 2,373,362 0.3% VR Advisory Services Ltd 332,432 2,330,348 0.3% Global X Management Co LLC 327,976 2,299,112 0.3% Mirae Asset Global Investments Co 310,322 2,175,357 0.3% United Services Automobile Associa 304,207 2,132,491 0.3% Arrowstreet Capital LP 290,282 2,034,877 0.2% Other - 13F Filers 6,324,954 44,337,928 5.4% Other - Non Filers 20,566,757 144,172,967 17.5% Fully Diluted Shares 117,645,699 824,696,350 100.0%
Charlie Boero Hughes - CFO     Juan Ignacio Galleano - IRO
Email: chboero@adecoagro.com   Email: jgalleano@adecoagro.com
  TEL: +5411 4836 8804           TEL: +5411 4836 8624
You can also read