Kola DFS Presentation - January 2019 - Kore Potash

Page created by Shirley Gilbert
 
CONTINUE READING
Kola DFS Presentation - January 2019 - Kore Potash
Kola DFS Presentation
January 2019

   1
Kola DFS Presentation - January 2019 - Kore Potash
Cautionary statements
    This presentation (the “Presentation”) has been prepared and issued by the directors of Kore Potash plc (“Kore” or the "Company" and, together with its subsidiaries, the “Group”). By attending (whether in person
    or by telephone) or reading the Presentation, you agree to be bound by the conditions set out below.
    The Presentation does not constitute or form part of, and should not be construed as investment advice or any offer or invitation to sell or issue, or any solicitation of any offer to purchase or subscribe for, any
    shares or other securities of the Company, nor shall it (or any part of it), or the fact of its distribution, form the basis of, or be relied on in connection with or act as any inducement to enter into, any contract
    whatsoever relating to any securities or financial instruments, acquisition or investment in the Company, or financial promotion. No person affiliated with the Company, its directors, officers, employees, affiliates,
    agents or advisers has been authorised to give any information or to make any representation not contained in the Presentation and, if given or made, such information or representation must not be relied upon.
    The Presentation is provided solely for general information only and must not be used or relied upon for the purpose of making any investment decision or engaging in any investment activity. The information
    and opinions in the Presentation are provided as at the date of the Presentation (unless stated otherwise) and are subject to change without notice. The Presentation does not purport to contain all information
    that may be required to evaluate the Company and/or the Group. While such information is believed to be reliable for the purposes used in the Presentation, no reliance may be placed for any purpose
    whatsoever on the information or opinions contained or expressed in the Presentation or on the accuracy, completeness or fairness of such information and opinions.
    The information relating to Exploration Results and Mineral Resources in this Presentation is based on, or extracted from previous reports referred to herein, and available to view on the Company’s website
    www.korepotash.com. The Kola Mineral Resource Estimate was reported 6 July 2017 in an announcement titled ‘Updated Mineral Resource for the High-Grade Kola Deposit’. The Dougou carnallite Mineral
    Resource estimate was reported on 9 February 2015 in an announcement titled ‘Elemental Minerals Announces Large Mineral Resource Expansion and Upgrade for the Dougou Potash Deposit’. It was prepared by
    Competent Persons Dr. Sebastiaan van der Klauw and Ms. Jana Neubert, senior geologists and employees of ERCOSPLAN Ingenieurgesellschaft Geotechnik und Bergbau mbH and members of good standing of the
    European Federation of Geologists. The Dougou Extension sylvinite Mineral Resource Estimate was reported 20 August 2018 in an announcement titled ‘Maiden Sylvinite Mineral Resource at Dougou Extension’.
    The Kola Slyvinite Ore Reserves Estimate was reported on 29 January 2019 in an announcement entitled ‘Kore Definitive Feasibility Study’. The Company confirms that it is not aware of any new information or data
    that materially affects the information included in the original market announcements and that all material assumptions and technical parameters underpinning the estimates in the relevant market
    announcement continue to apply and have not materially changed. The Company confirms that the form and context in which the Competent Person’s findings are presented have not been materially modified
    from the original market announcement.
    Nothing in the Presentation is, or should be relied on as, a promise or representation as to the future. This Presentation includes statements that are, or may be deemed to be, “forward-looking statements”. These
    forward-looking statements can be identified by the use of forward-looking terminology, including the terms “believes”, “estimates”, “plans”, “projects”, “anticipates”, “expects”, “intends”, “may”, “will”, or
    “should” or, in each case, their negative or other variations or comparable terminology, or by discussions of strategy, plans, objectives, goals, future events or intentions. These forward-looking statements include
    all matters that are not historical facts. They include, but are not limited to, statements regarding Kore’s intentions, beliefs or current expectations concerning, among other things, the Group’s financial position,
    business or proposed business, project development, further optimisation of the DFS, reserve or resource potential, exploration drilling, exploitation activities, corporate transactions and events or developments
    that the Company expects to occur. By their nature, forward-looking statements involve known and unknown risks and uncertainties and other factors, many of which are beyond the Group’s control. Forward-
    looking statements are not guarantees of future performance and the actual results of the Group’s operations and financial position may differ materially from those described in, or suggested by, the forward-
    looking statements contained in this Presentation. A number of factors could cause results to differ materially from those expressed or implied by the forward-looking statements in this Presentation including,
    without limitation, exploitation and exploration successes, market prices of potash, capital and operating costs, changes in project parameters as plans continue to be evaluated, continued availability of capital
    and financing, currency fluctuations, industry trends, competition, changes in political conditions, changes in regulation and general economic, market or business conditions and other factors disclosed in Kore’s
    filed documents. Forward-looking statements may, and often do, differ materially from actual results. Any forward-looking statements in this Presentation speak only as of the date of this Presentation. Past
    performance should not be taken as an indication or guarantee of future results and you are cautioned not to place undue reliance on forward-looking statements. No statement in the Presentation is intended as
    a profit forecast or a profit estimate.
    No representations, express or implied, are given in, or in respect of, the Presentation, including as to the fairness, accuracy or completeness of the contents of this Presentation or any other statement made or
    purported to be made in connection therewith, or that any of the forward-looking statements, projections or forecasts will come to pass or that any forecasted result will be achieved. To the fullest extent
    permitted by law, none of the Company, its subsidiaries or its or their respective directors, officers, employees, advisors or agents or any other person shall have any liability whatsoever for any loss howsoever
    arising, directly or indirectly, from the use of the Presentation or its contents or otherwise arising in connection therewith. Except to the extent required by applicable law or regulation, none of the Company, its
    subsidiaries, or its or their respective directors, officers, employees, advisors or agents, or any other person undertakes or is under any duty to update the Presentation or to correct any inaccuracies in any such
    information which may become apparent or to provide you with any additional information.
    The Presentation is not intended for distribution to, or use by, any person in any jurisdiction where such distribution or use would be contrary to local laws or regulations and therefore persons receiving this
    Presentation should inform themselves about and observe such restrictions
    Any information contained in this Presentation that is derived from publicly available or third party sources has not been independently verified. No representation or warranty is made as to the accuracy,
    completeness or reliability of such information.

2
Kola DFS Presentation - January 2019 - Kore Potash
Company overview

       Kore is developing its globally significant
       potash deposits in the Republic of
       Congo (RoC)
       Ideally located to supply the important
       Brazilian agricultural market and high growth
       African markets
       District scale development potential with
       over 6 Bt of potash Mineral Resources1
       located 35km from the coast
       Potassium (from potash) is a key nutrient,
       essential for high quality and high yield
       food production
       Feeding the world’s growing population as
       arable land declines requires increasing
       application of fertiliser

                     “Kore has the potential to be the lowest cost supplier of potash to
                     Brazil”
3   1. Measured, Indicated and Inferred sylvinite and carnallite Mineral Resources (JORC 2012), which comprises Kola sylvinite, Kola carnallite, Dougou carnallite and Dougou Extension sylvinite.
    Further details are provided on pages 25 and 26 of this presentation.
Kola DFS Presentation - January 2019 - Kore Potash
The Kola project - one deposit in a large
    potash district
                                                                               Kola sylvinite Ore Reserves, Mineral Resources and
                                                                               Exploration Target (JORC 2012)
                       Kola is a world class asset with
                                                                                 Measured + Indicated
                       long life production potential                             Mineral Resources1
                                                                                       508 Mt           Inferred Mineral
                                                                                                           Resources1
                                                                                                             340 Mt        Exploration Target
                                                                                                                             95 to 175 Mt1
                      High quality deposit:                                           35.4% KCl

                      • High grade                                                                         34.0% KCl
                                                                                    Ore Reserves
                                                                                      152 Mt                                  34-42% KCl
                      • Shallow                                                      32.5% KCl

                      • Very low insolubles
                      • Close to coast with access
                          to infrastructure

                      Permits and approvals in place
                     • Mining Convention approved (2018)
                     • Amendment to ESIA awaiting approval

4
    1. Refer to pages 25, 26 and 27 of this presentation for further details
Kola DFS Presentation - January 2019 - Kore Potash
Comparing Kola to other MoP projects

         Kola is amongst the shallowest MoP                                                                      Kola amongst the highest grade undeveloped
         projects globally                                                                                       potash deposits globally
         • Shaft bottom 270 m below surface                                                                      • Deposits of comparative grade to Kola are over
         • Shallow deposit creates opex and capex                                                                           1,000 m deep
               advantage                                                                                         • Grade a key driver of high operating margins

    Mine Depth                                                                                    Mineral Resources Grade1
                                                                                                                           40

                                                                                                                           35

                                                                                                                           30

                                                                                                    Resource Grade KCl %
    Surface                                                                                                                25

                                                                                                                           20

                          0                                                                                                15
                        200
                                                                                                                           10
                        400
                                                                                                                           5
              Metres

                        600
                        800                                                                                                0
                       1000
                       1200
                       1400
                       1600
                       1800

                                                            Kola Deposit          Pre-production assets                         Selected producers
    Source: Company disclosures
5
    1.   Grades are Measured and Indicated Mineral Resource grades as published by each company
Kola DFS Presentation - January 2019 - Kore Potash
Well situated for key export markets

           Product is planned to be shipped to Brazil
           and West Coast African markets where
           Kola potash will netback best value

           Brazil is a large and growing agricultural
           producer with low natural soil quality

           Brazil is one of the three largest
                                                                                                                    US$87.63/t
           importers of potash globally and imports                                                                 FOB
           c.90% of all its potash demand
                                                                                                  US$102.47/t
                                                                                                  CFR Brazil

           Kola is closer to Brazil with lower
           shipping costs than existing potash
           producers                                                    Kola: Republic of Congo
                                                                        DFS target markets: Brazil, Colombia, Nigeria, Morocco,
                                                                        South Africa, Spain
           Market price of Brazilian Granular CFR                       Additional markets: Senegal, Guinea, Cote D’Ivoire
           currently at approximately US$360/t
           MoP1

6
    1. Based on ICIS News on 23 Nov 2018 and Bloomberg on 28 Jan 2019
Kola DFS Presentation - January 2019 - Kore Potash
Kola DFS highlights

         Industry leading operating costs: average cost of MoP delivered to Brazil of
         US$102.47/t, potential to be the lowest cost potash supplier to Brazil

         NPV110(real) of US$1,452M and IRR1 of 17.2% on an ungeared, attributable basis

         Long life: nameplate production target of 2.2Mtpa MoP over a 33 year life2

         High operating margins: 75% average cash operating margin

         Strong free cashflow generation: average LoM annual free cashflow of US$500M
         post tax, post commissioning

         Second quartile pre-production capital intensity: US$2.1B on EPCM basis; capital
         intensity of US$956/t MoP

         Additional upside potential: further opportunities to potentially improve and
         optimise the project have been identified by Kore and its consultants

7   1.   Based on life-of mine average MoP price for granular of US$360/t CFR Brazil and standard US$350/t CFR Brazil
    2.   23 years based on Ore Reserves and 6% Inferred Mineral Resource, and further 10 years based on Inferred Mineral Resources. Refer to Kore‘s market announcement dated 29 Jan 2019
Kola DFS Presentation - January 2019 - Kore Potash
Kola project configuration

         • Targeting production of 2.2 Mtpa1
         • Shallow: shaft bottom of 270m
         • 35km to the coast via an overland conveyor and dedicated jetty for export to Brazil and West
           Africa
         • 90km via road to port of Pointe Noire for equipment imports
8
    1.   Refer Kore’s market announcement dated 29 Jan 2019 entitled ‘Kola Definitive Feasibility Study’
Kola DFS Presentation - January 2019 - Kore Potash
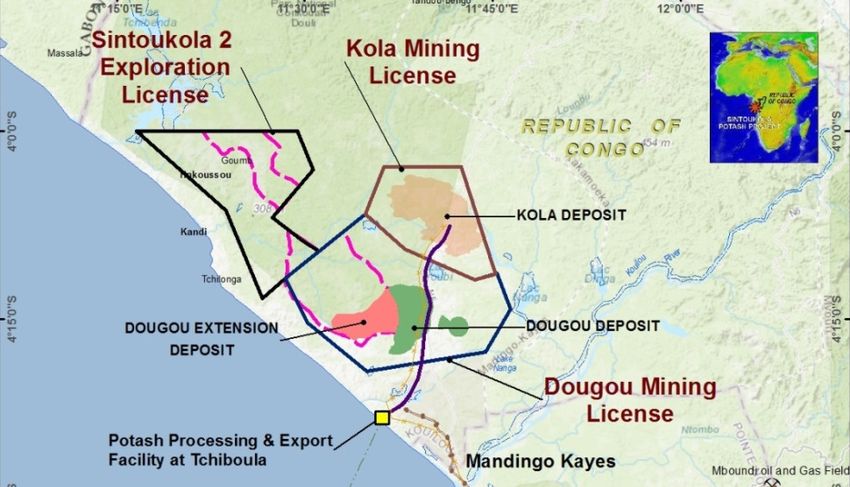
Kola – low risk, industry standard flowsheet

          MINE                                                Pocket                           Overland Conveyor
                                                              Conveyor

                                                                   Shaft

                 Continuous Miner   Shuttle Car        Belt Conveyor

                                           Attrition        Primary                Product
                                           Scrubbing        Flotation              Debrining           Product Drying              PROCESS PLANT

                      Crushing                                                     Salt         Sea                    Product
                                                                                   Debrining    Disposal             Screening           Compaction
                                 Deslime
    Raw Ore Storage              Screens
                                                       Scavenger
                                                                                                                        Standard
                                                       Flotation
                                                                                                                         Product
                                                                   NaCl Waste Stream                                      Cooler           Glazing
                                                                                                                                           & Cooling
                      PROCESS PLANT

                                                                                                                   Product
                          MARINE INFRASTRUCTURE                                                                    Storage
                                                                           Jetty                 Belt Conveyor

          Ocean Vessel   Floating Crane     Transhipment Vessel

9
Kola DFS Presentation - January 2019 - Kore Potash
Kola DFS in numbers

     Key statistics (100% basis)                                                                         Annual cash profile (US$M)2
                                                   Y1 – Y5           LoM                                             800
                                       Unit        average          average        Total LoM                         600
     MoP production                      kt          1,829            2,155           71,129                         400
                                                                                                                     200
     Granular MoP price                                                                                                -

                                                                                                            US$M
                                      US$/t            360             360              360

                                                                                                                              Y1
                                                                                                                              Y3
                                                                                                                              Y5
                                                                                                                              Y7
                                                                                                                              Y9
                                                                                                                             Y11
                                                                                                                             Y13
                                                                                                                             Y15
                                                                                                                             Y17
                                                                                                                             Y19
                                                                                                                             Y21
                                                                                                                             Y23
                                                                                                                             Y25
                                                                                                                             Y27
                                                                                                                             Y29
                                                                                                                             Y31
                                                                                                                             Y33
                                                                                                                             Y-4
                                                                                                                             Y-2
     (Real, CFR Brazil)                                                                                             (200)
     CFR cost (Landed in                                                                                            (400)
                                      US$/t            102             102              102
     Brazil)                                                                                                        (600)
     EBITDA                           US$M             496             583            19,230                        (800)
     EBITDA margin                       %            75%             75%              75%                         (1,000)

     Free cash flow1                  US$M             432             499            14,545                          Capex            Operating Cashflow              Project Free Cashflow

     Project economics                                                                                   NPV sensitivity
                                                                                                                                                            NPV impact (US$M)
      Pre-production capital cost (EPCM basis)                             US$2,103M
                                                                                                                                      (1,000)           (500)      -         500         1,000

      Life of Mine free cashflow                                           US$14,545M                         Potash Price +/- 20% (837)                                                  834

      Post-tax attributable IRR                                                 17.2%                                 Capex +/-20%                      (303)                  303

                                                                                                                       Opex +/-20%                         (148)             148
      Post-tax attributable NPV (10% real)                                 US$1,452M
                                                                                                             Shipping cost +/-20%                               (45)    45
      Payback period                                                          4.3 years
                                                                                                         Sustaining Capex +/-20%                                (27)    27

10   1.   Free cash flow is post tax, post commissioning
     2.   Operating cashflow is EBITDA less tax and WC adjustments. Project free cashflow is operating cashflow less development and sustaining capex
Disruptively low cost of supply into targeted
     markets
                                                                                                           Global Potash Export Cost Curve1 (FOB)
                                                                                                           US$/t MoP (2022)

          The DFS demonstrates that Kola
          potentially will be:
          • The second lowest cost operation on
             an export cost basis at US$87.63/t
             FOB (real 2018)
          • The lowest cost supplier globally of
             potash to Brazil at US$102.47/t CFR
             (real 2018)
          • Potentially disruptive in the MoP                                                              Brazil Potash Delivered Cost Curve1 (CFR Brazil)
             market with ability to compete on                                                             US$/t MoP (2022)
             price against all existing suppliers in
             our selected growing markets
          • Increasingly competitive in scenarios
             where global land transport and
             shipping costs increase

                                                                                                           Source: CRU Potassium Chloride Market Study August 2018
11
     1.   Kola FOB and CFR delivered costs used in the cost curves are on a real 2018 basis escalated to 2022
Capital cost estimates

     Pre-production capital cost estimates1,2                                              Capex and production volume
                                                                         Cost                             1,000                                      Production   2,500
      Description                                                                                                       Construction
                                                                       (US$M)
                                                                                                           800                                                    2,000
      Mining                                                              346

                                                                                            US$ million
      Process Plant                                                       495                              600                                                    1,500

                                                                                                                                                                          ktpa
      Roads                                                                63                              400                                                    1,000
      Marine Facilities                                                   179                              200                                                    500
      General Infrastructure                                              309
                                                                                                             -                                                    -
      Engineering and Site Services                                       288                                     Y-4   Y-3    Y-2   Y-1      Y1    Y2      Y3
      Owner’s Costs                                                       119                                                  Capex          Production

      Total Technical Cost                                               1,799
                                                                                           MoP project capital cost curve
      Escalation                                                          106
      Contingency                                                         110
      EPCM margin                                                          89
      Total                                                              2,103
     Notes:
     1. Total sustaining capital of US$799M is spread over life of mine and not included
         in pre-production capital
     2. Capital costs based on DFS estimated accuracy -10% to +10%. Capital costs
         excludes EPC costs

                                                                                           Source: CRU Potassium Chloride Market Study August 2018
12
Further optimisation of the DFS may yield additional
     value for shareholders
                                                           Impact of Potential Improvements
        Independent consultants have reviewed
        specific aspects of the project DFS                                               Impact on Economic
                                                                                               Evaluation
        Identified opportunities to further improve the       Potential Improvement
                                                                                           IRR           NPV10
        project include:                                                                    %             US$
        • Opportunities to reduce technical capex by       1. Improve KCl recovery by     +0.17%        +39M
          US$117M                                             0.9%
        • Opportunity to reduce capex to achieve           2. Reduce construction         +0.99%       +135M
          capital intensity that better reflects              schedule by 6 months
          comparable peers with similar characteristics    3. Reduce technical capex by   +0.90%       +105M
          to Kola (shallow shafts, low insolubles, close      US$117M
          to coast)
        • Improve KCl process recovery by 0.9%
        • Reduce construction schedule by 6 months
        • Extend the life or scale via extraction and
          processing of the Sylvinite Mineral Resources
          at nearby Dougou Extension deposit
        Further Kola project optimisation work is
        ongoing

13
Kola Funding Plan

      Kola Project Development                                Debt: US$1.0 – 1.4B
      • Pre-production capital of US$2.1B plus funding
        for working capital will be required
      Debt
      • Target debt funding of US$1.0 to 1.4B
      • Export Credit Agency (ECA) financing expected to                ECA
        comprise large proportion of debt financing mix
      • DFS enables discussions with Development                                               Equity
        Finance Institutions (DFI) and commercial banks
        to advance
                                                                        DFI
      Equity                                                                                  Offtake /
      • Two existing strategic shareholders on the                                            Strategic
        register: SQM (18%) and SGRF (19%)                      Bank financing
      • Equity funding options include introduction of
        additional cornerstone or JV partner
      Offtake Agreements                                   Impact of Debt Funding on Kola Project Economics
      • SQM and SGRF have right of first refusal
                                                                 Project Debt          NPV
        proportional to shareholding (each with 20%                                                     IRR
                                                                   (US$M)            (US$M)
        floor)
      • Required to support debt financing levels                     0               1,452          17.2%
                                                                    1,000             1,588          20.1%
                                                                    1,400             1,643          22.1%

14
Kola - Timeline to Production

                                              2019             2020                      Y-5                      Y-4                    Y-3   Y-2   Y-1   Y1
                                                     Competitive
             EPC negotiations1                          EPC

                         Financing

                           Offtake

                    Construction

               Site Preparation

               Ground Freezing

                    Shaft Sinking

            Jetty Construction

                       Conveyor
                    Construction

            Plant Construction

                      Production
                     Commences

15
     1.   If Kore exercises its right to seek a competitive EPC proposal, additional funding for 12 months’ working capital will be required
Environment and Permitting

       Project close to being fully permitted
       Mining Convention, which secures the fiscal and operating regime is in place
       Transshipment license approved
       Amended Kola Environmental and Social Impact Assessment (ESIA) submitted for
       approval
       Mining Convention provides for Republic of Congo Government to be a 10%
       shareholder in the Kola Project
16
Kola Project next steps

        French Consortium (FC) contractually obliged to deliver a proposal for an
        Engineering, Procurement and Construction (EPC) contract within 3 months of
        the DFS completion

        Upon receipt of an EPC proposal, the existing contract between the parties
        provides up to 2 months for Kore and the FC to conclude the terms of an
        EPC contract

        Kore has ability within the existing contract with the FC to seek competitive EPC
        proposals from European companies

        Company continues its engagement with the FC and Kore’s consultants and
        technical experts with a view to further optimising the project

        Company will continue to work with the RoC government to conclude approval of
        the amended ESIA

        Progress transfer of 10% of shares in local RoC company holding the Kola mining
        licence to RoC government, in accordance with Mining Convention

17
Kola – investment summary

                                                                                              Long life at globally
                       Low Operating Cost                                                                                       Advantageous location
                                                                                              significant scale

      Potential to be:                                                      • Initial life of Kola of 33 years        • Close to export markets
      • Industry’s lowest cost potash                                         based on 2.2Mtpa1 MoP                   • Own jetty and transshipment
        supplier to Brazil (US$102.47/t                                       production                                facility
        MoP, real 2018)                                                     • Potential to extend life or scale       • Electrical power, gas and water
      • Second lowest operating cost                                          from Kola exploration targets             are available
        on an export (FOB) basis                                              and Dougou Extension sylvinite
        (US$87.63/t MoP, real 2018)                                           deposit

                       Attractive economics                                                   Conventional potash
                                                                                              flowsheet                        Advanced permitting

      • NPV10 real US$1.45B; IRR 17%                                         • Underground mechanised                 • Mining Convention governing
      • US$500M post tax annual free                                           room and pillar mining                   key fiscal parameters in place
        cash flow                                                            • Industry standard processing           • Amended ESIA submitted for
      • US$2.1B capex on EPCM basis                                            plant design                             approval

      • 2nd quartile capital intensity of                                    • High grade deposit with
        US$956/t MoP                                                           `shallow shaft

18   1. Refer Kore’s market announcement dated 29 Jan 2019 entitled ‘Kola Definitive Feasibility Study’
Appendix

19
More potash needed to feed the world

     The world will need to grow 50% more food       … while global arable land per person is
     by 2050 to feed an anticipated population of    declining sharply
     9 billion people...

                                                                                                      0.4

                                                                               Hectares per person
                                                                                                     0.35
                                                                                                      0.3
                                                                                                     0.25
                                                                                                      0.2
                                                                                                     0.15
                                                                                                      0.1

                                                                                                            1960
                                                                                                            1964
                                                                                                            1968
                                                                                                            1972
                                                                                                            1976
                                                                                                            1980
                                                                                                            1984
                                                                                                            1988
                                                                                                            1992
                                                                                                            1996
                                                                                                            2000
                                                                                                            2004
                                                                                                            2008
                                                                                                            2012
     More fertiliser needs to be produced to boost   ... and demand for potash for arable use is
     yields from existing arable land….              growing year on year.
                                       145                                                           3.5%                        3.1%
                                                                                                                                         3.0%
            kg per hectare of arable

                                       140                                                           3.0%          2.7%

                                                           Potash demand grwoth (%)
                                       135                                                                                2.5%
                                       130                                                           2.5%
                                       125
                     land

                                                                                                     2.0%
                                       120
                                       115                                                           1.5%
                                                                                                            0.9%
                                       110                                                           1.0%
                                       105
                                                                                                     0.5%
                                       100
                                             2002
                                             2003
                                             2004
                                             2005
                                             2006
                                             2007
                                             2008
                                             2009
                                             2010
                                             2011
                                             2012
                                             2013
                                             2014
                                             2015

                                                                                                     0.0%
                                                                                                            2016   2017   2018   2019F   2020F

      Source: World Bank, United Nations, FAO
20
Potash supply and demand

                                                      2017 Supply
           Total annual production of potash                                           West
                                                                    Southeas
           (MoP) is around 66 Mtpa                                    t Asia          Europe
                                                                                      4.0 Mt
                                                                     0.4 Mt                              East Asia
                                                                                                          7.1 Mt

           At present this supply is largely met by
                                                                North
           existing major suppliers including:                 America             65.0 Mt                   FSU
                                                               21.8 Mt                                     23.5 Mt
           •   Urakali – 12.2 Mtpa
           •   Nutrien – 11.7 Mtpa                                                                       Latin
                                                                          Middle                       America
                                                                           East
           •   Belaruskali – 11.2 Mtpa                                    6.2 Mt                        2.1 Mt

           •   Mosaic – 8.6 Mtpa
                                                      2017 Demand
                                                                        Other             Africa
                                                                        3.3 Mt            0.8 Mt
           Industry total installed production                                                            Latin
           capacity of c.84 Mtpa                                                                         America
                                                              E Asia                                     12.5 Mt
                                                              16.9 Mt
                                                                                                           W Europe
                                                                                   65.8 Mt                  5.4 Mt

                      “Kola potash will supply                                                              FSU
                                                                                                           2.5 Mt
                      demand growth and displace                 N America
                                                                                                         S Asia
                                                                                                         5.3 Mt
                      high cost supply”                           12.1 Mt                    SE Asia
                                                                                             7.0 Mt

     Source: Integer
21
     Note: All tonnages refer to KCl tonnages
Potash historical prices

             850

             750

             650

             550
     US$/t

             450

                                                                                              US$360/t
             350

             250

             150
               Nov-04    Sep-07            Jul-10            May-13              Mar-16   Jan-19
                                  Vancouver FOB     Brazil Potash CFR Granular

     Source: Bloomberg
22
Kore’s broader potash portfolio

             Dougou Extension Sylvinite Deposit
             • 232 Mt Mineral Resources1
             • Grade 38.1% KCl
             • Contains some very high grade areas –
               57 to 60% KCl
             • Mining licence granted, mining
               convention signed
             • Potential to provide feed to extend life or
               increase scale at Kola
             Dougou Carnallite Deposit
             • 3,056 Mt Mineral Resources1
             • Grade 20.7% KCl
             • Mining licence granted, mining
                 convention signed
             Kola Carnallite Deposit
             • 2,049 Mt Mineral Resources1
             • Grade 18.5% KCl
             • Sits beneath Kola Sylvinite Deposit

23
     1. Refer to pages 25 and 26 of this presentation for further details
Ore Reserves

     Kola Sylvinite Ore Reserves (gross 100% basis)

                                                Ore Reserves                     KCl grade                        Mg                       Insolubles
              Classification
                                                    (Mt)                          (% KCl)                       (% Mg)                      (% Insol.)

                   Proved                                61.8                        32.1                         0.11                          0.15

                  Probable                               90.6                        32.8                         0.10                          0.15

          Total Ore Reserves                           152.4                         32.5                         0.10                          0.15

     Notes:
     • The Kola Ore Reserves Estimate is reported in accordance with the JORC code 2012 edition. It was first reported in Kore’s market announcement of 29 Jan
       2019 entitled ‘Kola Definitive Feasibility Study’, and was prepared by Met-Chem division of DRA Americas Inc., a subsidiary of the DRA Group. A 9.9 % KCl
       cut-off grade was used for the Ore Reserve Estimate.
     • Ore Reserves are not in addition to Mineral Resources but are derived from them by the application of modifying factors

24
Mineral Resources — Sylvinite

     Sylvinite deposits (gross 100% basis)
                                                                                                                                 Contained KCl
     Mineral Resource category                            Million Tonnes                       Grade KCl %
                                                                                                                                 Million tonnes
     Kola Sylvinite
     Measured                                                     216                                34.9                                75
     Indicated                                                    292                                35.7                                104
     Sub-total (Measured + Indicated)                             508                                35.4                                180
     Inferred                                                     340                                34.0                                116
     TOTAL                                                        848                               34.8                                295

     Dougou Extension Sylvinite
     Measured                                                      -                                  -                                   -
     Indicated                                                    111                                37.2                                41
     Sub-total (Measured + Indicated)                             111                                37.2                                41
     Inferred                                                     121                                38.9                                47
     TOTAL                                                        232                               38.1                                 88

     Total Sylvinite (Kola and Dougou Extension)
     Measured + Indicated +
                                                 1,080                                              35.5                                384
     Inferred
     Notes:
     • The Mineral Resource Estimates are reported in accordance with the JORC code 2012 edition. The Kola Sylvinite Mineral Resource was first reported in
       Kore’s market announcement of 6 July 2017 entitled ‘Updated Mineral Resource for the High Grade Kola Project’, and was prepared by Met-Chem division of
       DRA Americas Inc., a subsidiary of the DRA Group, using a cut-off grade of 10% KCl.
     • The Dougou Extension Sylvinite Mineral Resource was first reported in Kore’s market announcement of 20 August 2018 entitled ‘Maiden Sylvinite Mineral
       Resource at Dougou Extension”, and was prepared by Andrew Pedley of Kore Potash, using a cut-off grade of 15% KCl.
     • Rounding errors may exist

25
Mineral Resources — Carnallite

     Carnallite deposits (gross 100% basis)
                                                                                                                              Contained KCl
     Mineral Resource category                           Million Tonnes                      Grade KCl %
                                                                                                                              Million tonnes
     Dougou Carnallite
     Measured                                                    148                               20.1                               30
     Indicated                                                   920                               20.7                               190
     Sub-total (Measured + Indicated)                           1,068                              20.6                               220
     Inferred                                                   1,988                              20.8                               414
     TOTAL                                                     3,056                              20.7                               634

     Kola Carnallite
     Measured                                                    341                               17.4                               59
     Indicated                                                   441                               18.7                               83
     Sub-total (Measured + Indicated)                            783                               18.1                               142
     Inferred                                                   1,266                              18.7                               236
     TOTAL                                                     2,049                              18.5                               378

     Total Carnallite (Dougou and Kola)
     Measured + Indicated +
                                                               5,105                              19.8                              1,012
     Inferred
     Notes:
     • The Mineral Resource Estimates are reported in accordance with the JORC code 2012 edition. The Kola Carnallite Resource was first reported in Kore’s
       market announcement of 6 July 2017 entitled ‘Updated Mineral Resource for the High Grade Kola Project’, and was prepared by Met-Chem division of DRA
       Americas Inc., a subsidiary of the DRA Group, using a cut-off grade of 10% KCl.
     • The Dougou Carnallite Mineral Resource was prepared by ERCOSPLAN Ingenieurgesellschaft Geotechnik und Bergbau mbH (“ERCOSPLAN“) and first reported
       in Kore’s market announcement of 9 February 2015 entitled ‘Elemental Minerals Announces Large Mineral Resource Expansion and Upgrade for the Dougou
       Potash Deposit’.
     • Rounding errors may exist

26
Exploration Targets

     The potential quantity and grade of an Exploration Target is conceptual in nature and is an approximation, and is expressed as an expected
     range of tonnes and grade. There has been insufficient exploration at Kola South and DX North to estimate Mineral Resources and it is uncertain
     if further exploration will result in the estimation of Mineral Resources.

     Kola South
                                                                                                                          Minimum                     Maximum
                                                  Average       Averge       Minimum                        Maximum                       Mid Point
                                       Area                                                  Mid Point                    average                      average
                  Seam                           Thickness      Density      Tonnage                        Tonnage                        grade
                                       km2                                                 Tonnage (Mt)                    grade                        grade
                                                    (m)         (g/cm3)        (Mt)                           (Mt)                         (KCl%)
                                                                                                                           (KCl%)                       (KCl%)
                   TSS                   -            -            -             -                              -             -                          -
                  HWSS                  23          2.74         2.02           19              29             39            50              56          60
                   US                   23          3.40         2.10           58              79            100            30              34          38
                   LS                   23          2.50         2.11           18              28             37            28              31          34
               ALL SEAMS                                                        95             135            175            34              38         42

     DX North
                                                                                                                          Minimum                     Maximum
                                                  Average       Average      Minimum                       Maximum                        Mid Point
                                       Area                                                 Mid Point                     average                      average
                  Seam                           Thickness      Density      Tonnage                       Tonnage                         grade
                                       km2                                                Tonnage (Mt)                     grade                        grade
                                                    (m)         (g/cm3)        (Mt)                          (Mt)                          (KCl%)
                                                                                                                           (KCl%)                       (KCl%)
                   TSS                  185         5.30          2.11          155            233             310           24              29          34
                  HWSS                  185         2.60          2.02          49              64             78            55              59          60
                   US                   185         3.40          2.10          66              99             132           30              34          38
                   LS                   185         2.50          2.11          49              64             78            28              31          34
               ALL SEAMS                                                       320             460            600            30              35         38

     Notes
     • Refer to Kore’s announcement dated 21 November 2018; ‘Significant Extensions to Kore’s Existing Sylvinite Deposits Expected’
     • Rounding errors may exist. Tonnage totals are rounded to the nearest multiple of 5 Mt. Grades are rounded to the nearest percent

27
Kola DFS delivery team

     Scope of DFS                            Responsibility

     Project Management

     Geology and Mineral Resource Estimate

     Geotechnical and Hydrogeology

     Mining and Shafts

     Processing and Metallurgical Testwork

     Infrastructure and Utilities

     Construction

     Marine and Transhipment

     Environmental

     Marketing

28
Kola Mineral Resource classification

29
Kola site layout

30
     Note: Refer Kore’s market announcement dated 29 Jan 2019 entitled ‘Kola Definitive Feasibility Study’
Kola opex detail

     Cost Category                                                                                           Real 2018 costs (US$/t MoP)

     Mining Cost                                                                                                                  21.70

     Processing Cost                                                                                                              25.77

     General infrastructure Cost                                                                                                   4.57

     Owners Cost                                                                                                                   9.67

     Mine Gate Operating Costs                                                                                                    61.71

     Sustaining Capex                                                                                                             10.98

     Product Realisation Charges and Allowances                                                                                    1.89

     Royalties                                                                                                                     8.67

     Ex Works Cost                                                                                                                83.25

     Logistics to FOB point                                                                                                        4.37

     Ocean Shipping                                                                                                               14.84

     CFR Cost (Landed in Brazil)                                                                                                 102.47

31
     Note: Refer Kore’s market announcement dated 29 Jan 2019 entitled ‘Kola Definitive Feasibility Study’
Board of Directors
              David Hathorn Chairman                                                Brad Sampson Chief Executive Officer
              David was the CEO of the Mondi Group between 2000 and May             Brad, a qualified mining engineer, has more than 25 years’
              2017 having joined the group in 1991. Prior to the demerger of        resources industry experience across numerous locations including
              Mondi from Anglo American Plc, David was a member of the Anglo        West and Southern Africa. Most recently, Brad was CEO of ASX-
              American group executive committee from 2003 and an executive         listed Tiger Resources Limited, a copper producer in the
              director of Anglo American PLC from 2005, serving on several of the   Democratic Republic of the Congo. Prior to this, Brad held senior
              boards of the group’s major mining operations.                        positions at Newcrest Mining Ltd. From 2008 to 2013 and was the
                                                                                    CEO of AIM/ASX-listed Discovery Metals Ltd.

              Jonathan Trollip Non-Executive Director                               David Netherway Non-Executive Director
              Jonathan is a globally experienced Director (both executive and       David Netherway is a mining engineer with over 40 years of
              Non-Executive) with over 30 years of commercial, corporate,           experience in the mining industry across many commodities and
              governance and legal and transactional expertise. He is currently     countries, especially Africa. David was CEO of Shield Mining and
              Non-Executive Chairman of ASX listed Global Value Fund Ltd, Future    TSX-listed Afcan Mining Corporation. He is currently the Chairman
              Generation Investment Company Ltd, Spicers Ltd, Plato Income          of Altus Strategies plc. (AIM: ALS & TSX-V: ALTS), Canyon Resources
              Maximiser Ltd Spheria Emerging Companies Ltd and Antipodes            Ltd (ASX: CAY) and Kilo Goldmines Ltd (TSX-V: KGL) and Non-
              Global Investment Company Ltd and a non-executive director of         Executive Director of Avesoro Resources Inc. (TSX & AIM: ASO).
              Propel Funeral Partners Ltd.

              Leonard Math Non-Executive Director                                   José Antonio Merino Non-Executive Director
              Leonard has extensive experience in relation to public company        José Antonio is currently M&A Director at SQM. Prior to SQM, Jose
              responsibilities including ASX and ASIC compliance, control and       Antonio worked at EPG Partners as head of a mining private equity
              implementation of corporate governance, statutory financial           fund, at Asset Chile, a Chilean boutique investment bank, and at
              reporting and shareholder relations with both retail and              Santander Investment. He is a qualified Civil Engineer having
              institutional investors. He was most recently the CFO of ASX-listed   graduated from Pontificia Universidad Católica de Chile.
              Gulf Manganese Corporation

              Timothy Keating Non-Executive Director
              Timothy Keating is Head of Mining Investment Private Equity at the
              State General Reserve Fund (SGRF), a sovereign wealth fund of the
              Sultanate of Oman. Prior to SGRF, Tim was CEO of African Nickel
              Ltd. Tim is also a non-executive director of Kenmare Resources plc.

32
Corporate snapshot

     Key shareholders                                                     KP2 AIM share price / volume
                                                                                       18                                                 25
     Shareholder                                    % interest                         16
                                                                                       14                                                 20

                                                                                                                                               Volume (Millions)
     Princess Aurora Company Pte Ltd (SGRF)                 19.02%

                                                                     Share price (p)
                                                                                       12
                                                                                                                                          15
     Sociedad Quimica y Minera (SQM)                        17.52%                     10
                                                                                       8
     Harlequin Investments Ltd                              12.02%                                                                        10
                                                                                       6
     Dingyi Group Investments Ltd                            8.80%                     4                                                  5
                                                                                       2
     Coronation Fund Managers                                3.22%                     0                                                  0
     Kore Board and Management                               3.26%

                                                                                                              Volume   Price

      Ticker                                   AIM: KP2                                       ASX: KP2                         JSE: KP2
      Share price                                 7.40p                                         A$0.13                         ZAR1.01
      Shares in issue                          860,852,693                                   860,852,693                   860,852,693

      Market Cap                                £63.70M                                       A$111.91M                   ZAR 869.46M

      Price range (since listing)             3.46p – 25.51p                                A$0.06 – A$0.22             ZAR70 – ZAR500

      Nomad/Sponsor/Broker                      Canaccord                                        n/a                           RenCap

      Notes:
      1. Share price as at 25 Jan 2019

33
You can also read