Half-yearly results 30 June 2020 - IP Group plc

Page created by Javier Goodman
 
CONTINUE READING
Half-yearly results 30 June 2020 - IP Group plc
Half-yearly results
30 June 2020
Half-yearly results 30 June 2020 - IP Group plc
Disclaimer
NOT FOR DISTRIBUTION OR RELEASE, DIRECTLY OR                                         in this presentation is correct as of any date subsequent to the date of this    which section 85 of the Financial Services and Markets Act 2000 of the
INDIRECTLY, IN OR INTO THE UNITED STATES OF AMERICA                                  presentation.                                                                    UK (“FSMA”) applies and should not be considered as an advice or
OTHER THAN TO PERSONS TO WHOM THIS PRESENTATION                                                                                                                       recommendation that any person should subscribe for or purchase any
                                                                                     The Company or any member, employee, counsel, officer, director,
                                                                                                                                                                      securities of the Company.
CAN BE LAWFULLY DISTRIBUTED                                                          representative, agent or affiliate of the Company does not have any
                                                                                     obligation to update or otherwise revise any statements reflecting               The securities of the Company will not be offered or sold to any person in
The communication of this presentation may be restricted by law; it is not
                                                                                     circumstances arising after the date of this presentation. To the extent         the UK except in circumstances which have not resulted and will not result
intended for distribution to, or use by any person in any jurisdiction where
                                                                                     permitted by applicable law, no representation or warranty, express or           in an offer to the public in the UK in contravention of section 85(1) of
such distribution or use would be unlawful. Any person into whose
                                                                                     implied, is made by the Company or any member, employee, counsel,                FSMA.
possession any part of this presentation comes is required by IP Group
                                                                                     officer, director, representative, agent or affiliate of the Company as to the
plc. (the “Company”) to inform himself/herself about and to observe any                                                                                               This presentation is not being distributed by, nor has it been approved for
                                                                                     accuracy or completeness of any information contained in this
applicable restrictions in his/her respective jurisdiction.                                                                                                           the purposes of section 21 of FSMA by, a person authorised under FSMA.
                                                                                     presentation. No information contained in this presentation is, or shall be
                                                                                                                                                                      This presentation is communicated only to: (i) persons outside the UK
This presentation is for information purposes only and does not constitute           relied upon by any person as to its accuracy or completeness or as a
                                                                                                                                                                      falling within Article 12 of the Financial Services and Markets Act 2000
an offer of, or a solicitation to purchase or subscribe for, any securities in       promise or representation by the Company.
                                                                                                                                                                      (Financial Promotion) Order 2005 (the “FPO”); or (ii) persons who are
which such offer or solicitation is unlawful or to any person to whom it is
                                                                                     The Company expressly disclaims any and all liability that may be based          investment professionals falling within Article 19(5) of the FPO; or (iii) high
unlawful to make such offer or solicitation. This presentation or any part
                                                                                     on any information contained in this presentation and any errors or              net worth companies, unincorporated associations and other persons
of it or the fact of its distribution shall not form the basis of, or be relied on
                                                                                     omissions herein. No person is authorised to give any information not            falling within Article 49(2)(a) to (d) of the FPO.
in connection with, any contract commitment or investment decision in
                                                                                     contained in this presentation and any information not contained in this
relation thereto nor does it constitute a recommendation regarding the                                                                                                Nothing contained in this presentation shall be deemed to be a profit
                                                                                     presentation must not be relied upon as having been authorised by or on
securities of the Company. No person must construe the information                                                                                                    forecast.     This presentation may contain certain forward-looking
                                                                                     behalf of the Company.
contained in this presentation as legal, business, tax or investment advice.                                                                                          statements, beliefs or opinions with respect of the financial condition and
Investors and prospective investors in the securities of the Company are             This presentation does not constitute an offer to sell, or a solicitation of     business operations of the Company as well as certain plans and
required to make their own independent investigation and appraisal of the            offers to purchase or subscribe for, securities in the United States (“US”).     objectives of the Company. By their nature, forward-looking statements
business and financial condition of the Company and the nature of the                The securities of the Company have not been, and will not be, registered         involve risk and uncertainty, because they depend on circumstances and
securities, and consult his/her own independent counsel, business                    under the US Securities Act of 1933, as amended (the “Securities Act”) or        events that may or may not occur in the future. Past performance of the
advisor, tax advisor, investment advisor or any other authorised advisors            qualified under any applicable statutes of any state or other jurisdiction of    Company cannot be relied on as a guide to future performance, and any
as to the legal, business, tax, investment or any other matters pertaining           the US, and the securities of the Company may not be offered, sold,              actual results and developments may differ materially from those
to the Company and the securities of the Company.                                    distributed or transferred, directly or indirectly, in the US (including its     expressed in or implied by such forward-looking statements. The
                                                                                     territories and possessions), except pursuant to an exemption from, or in        Company can give no assurance that such expectations will prove to have
The information contained in this presentation has been provided by the
                                                                                     a transaction not subject to, the registration requirements under the            been correct and the Company therefore cautions any person not to place
Company and other sources identified therein for the exclusive use of the
                                                                                     Securities Act. No public offer of securities of the Company is being made       undue reliance on these forward-looking statements which speak only as
intended recipient and is highly confidential. No information provided as
                                                                                     in the US.                                                                       at the date of this presentation.
part of this presentation may be used, copied, reproduced, in whole or
part, or otherwise disseminated, directly or indirectly, by any recipient to         For the avoidance of doubt, this presentation is intended for distribution
any other person. If any part of this presentation has been received by              only to those persons that are qualified institutional buyers (within the
any person in error, it should be returned to the Company immediately.               meaning of Rule 144A under the Securities Act) and qualified purchasers
                                                                                     (as defined in section 2(a)(51) of the US Investment Company Act 1940,
The statements contained in this presentation are made as at the date of
                                                                                     as amended). This presentation and qualified purchasers (as defined in
this presentation. The distribution of this presentation shall under no
                                                                                     section 2(a)(51) of the US Investment Company Act 1940, as amended).
circumstances imply that there shall not be a change in the Company’s
                                                                                     This presentation does not constitute an offer document or an offer of
affairs since the date of this presentation or that the information contained
                                                                                     transferable securities to the public in the United Kingdom (the “UK”) to

                                                                                                                                                                                                                        © IP GROUP PLC 2020 | 1
Half-yearly results 30 June 2020 - IP Group plc
Contents

1   Overview    #

2   Context     #

3   Results     #

4   Portfolio   #

5   Outlook     #

6   Summary

                    © IP GROUP PLC 2020 | 2
Half-yearly results 30 June 2020 - IP Group plc
Overview
Results
• Return on Hard NAV1 of £14.2m (including net overheads)
• Hard NAV2 of £1.2bn or 108.8p per share (FY19: £1.2bn or 107.8p)
• Record realisations of £113.7m (FY19: £79.5m), exceeding portfolio investment of £36.9m
• Gross cash/net cash of £245.3m / £170.5m (FY19: £195m / £112m)
• Increase in value and subsequent sale of stake in Ceres Power Holdings plc was a key driver
Operations
• Business has adapted well to lock-down and is fully functioning remotely
• Some impact on portfolio funding rounds, although companies raised a total of £365m (FY19: £430m)
Post period-end
• Further realisations of £54.4m in July, total gross cash at 31 July of more than £275m
• Oxford Nanopore partners with UK Govt. to roll out LamPORE, a new generation of Covid-19 test

1 Return  on Hard NAV reflects profit for period of £11.7m excluding share based payments charge (£1.3m) and IFRS3 charge in respect of acquisitions (£1.2m)
2
                                                                                                                                                               © IP GROUP PLC 2020 | 3
    Hard NAV reflects Net Assets/Total Equity of £1,156.8m less goodwill (£0.4m)
Half-yearly results 30 June 2020 - IP Group plc
02
                                          Context
Evolving GREAT IDEAS into WORLD-CHANGING businesses
Half-yearly results 30 June 2020 - IP Group plc
Context: purpose, vision and strategy

                       PURPOSE               VISION

        INTELLECTUAL             FINANCIAL            HUMAN
        CAPITAL                  CAPITAL              CAPITAL

                                                        © IP GROUP PLC 2020 | 5
Half-yearly results 30 June 2020 - IP Group plc
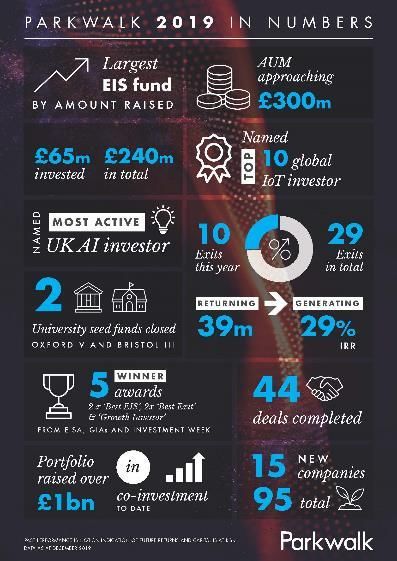
Context: Business units
UK-based sector funds                                                                               Multi-sector country-focused funds

    £193m                                         £331m                                £98m           £68m*                    £6m          £300m

 Strategic opportunities
                                                                                                            Managing balance               Managing
                                                                                                              sheet capital            third-party capital
                                  £278m

                                                                                       Cross-fund resources
                                  Specialist corporate                                                                               Intellectual property
                                                                                                Executive search
                                  advisory, finance, and                                                                             appraisal and
                                                                                                and recruitment
                                  fund management                                                                                    strategy development

*IP Group plc is a majority shareholder in IP Group, Inc, with 80% economic interest                                                           © IP GROUP PLC 2020 | 6
Half-yearly results 30 June 2020 - IP Group plc
Context: Long-term trends in HNAV/share and share price

       Share price

       'Hard' NAV per share

                                                                                                                                                                       109

55                                                                                                                                                                       67

22
2003      2004     2005      2006     2007      2008     2009      2010     2011      2012     2013      2014      2015     2016      2017     2018      2019   HY 2020

‘Hard’ NAV or HNAV reflects Net Assets/Total Equity less goodwill, intangibles and the Oxford Equity Rights asset                                     © IP GROUP PLC 2020 | 7
Data points as at 31 December for all years other than HY 2020, which is as at 30 June, and 2003 share price, which reflects the Oct 2003 IPO issue price.
Half-yearly results 30 June 2020 - IP Group plc
Context: Long-term trends in portfolio investment/divestment
         150.0                                                                                                                                150.0

                                      Investments
         100.0                                                                                                                                100.0
                                      Realisations

           50.0                       Net (inv)/exits                                                                                         50.0

               -                                                                                                                              -

         (50.0)                                                                                                                               (50.0)

        (100.0)                                                                                                                               (100.0)

        (150.0)                                                                                                                               (150.0)
                    2003 2004 2005 2006 2007 2008 2009 2010 2011 2012 2013 2014 2015 2016 2017* 2018 2019                             H1
                                                                                                                                     2020

*In addition, in 2017, IP Group acquired £315m net portfolio value through the all-paper acquisition of Touchstone Innovations plc

                                                                                                                                     © IP GROUP PLC 2020 | 8
Source: IP Group plc annual report and accounts, cash flow statements
Half-yearly results 30 June 2020 - IP Group plc
03
Results
Results: Hard NAV per share waterfall

                                            2.3

                            0.6                          4.3

              4.6                                                        0.6
                                                                                         1.0

                                                                                                        0.6               108.8

 107.8

Opening   Ceres Power   Carry accrual    Private FV   Private FV   Other net private Net overheads Other P&L items      Closing
                                        gains > £1m   reductions     gains & FX
                                                        > £1m

                                                                                                                 © IP GROUP PLC 2020 | 10
Results: Ceres Power

                        Fair value
                        movement
                       year-to-date

                        £52.9m*

                                       Realised                           TOTAL
                                      year-to-date                        VALUE
                                                                                                             7.0x
                                       £125.9m
                                                                          £127.5M*
Fair value as
    at 31
 December
    2019

   £74.6m

                                                             Unrealised         AGGREGATE
                                                             £1.6m*             INVESTMENT
                                                     Unrealised                    £18.3M
                                                      £1.6m*
* As of 20 July 2020                                                                         © IP GROUP PLC 2020 | 11
Results: net assets
         Portfolio
         Cash and deposits
         Other
                             Hard NAV
         Loan
                              £1.2bn       109pps

                                        Other Portfolio

                              £1,025m
         £1,046m
                                            Ceres
                                           Istesso

                                            ONT
                                                          60pps

         £195m                £245m      Gross Cash
         (£17m)               (£39m)
         (£83m)
                              (£75m)

        FY 2019              HY 2020

                                                            © IP GROUP PLC 2020 | 12
Results: cash flows
                                                                           Opening            Closing                                          245.3

                                                   Gross                    194.9             245.3
                                                   EIB facility             (82.5)            (74.8)
                                                   Net                      112.4             170.5
     194.9
                             (10.4)                                                                                       113.7
                                           (8.4)
                                                                  (13.4)                7.6

                                                                                                           (38.7)

Opening gross            Overheads    Debt & interest    Acqns, WC/other             US funding         Investment *   Realisations       Closing gross

* Includes fund investment                                                                                                            © IP GROUP PLC 2020 | 13
04
Portfolio
Portfolio summary
                                                                                                          £6m      £20m                                      ONT
                                                             Top 20 holdings                                                                                 Life Sciences excl. ONT
                                                                                                              £68m
                                                             Focus
                                         12%                                                                                    £258m
                                                             Other                                       £98m                                                Technology

                                                                                                                                                             Cleantech
                                                                                                                            1
                                             16%                                                                    £973m
                                                                                                        £193m                                                US
                      72%                                                                                                                                    Australasia
                                                                                                                           £331m
                                                                                                                                                             Strategic Opps

                                            £45.4m
                                                                          2020 net fair value movements
                                                                                                                                                                       £34.9m
                                                                                                                £29.4m

          £4.7m                                                                                                                    £5.3m
                                                                                                £0.1m                                              £0.2m

                                                                              (£2.9m)
                                                             (£6.1m)
                          (£11.8m)
      Life Sciences     Technology        Cleantech      Strategic Opps    Organic & De         Other           Total UK        United States    Australasia       Total portfolio
       (excl. ONT)                                         (incl. ONT)       minimis

1                                                                                                                                                                 © IP GROUP PLC 2020 | 15
 £973m reflects net portfolio value, which excludes de minimis holdings and third party share of gross portfolio. See appendix for reconciliation to gross
portfolio of £1,025m.
Oxford Nanopore Technologies
                          STRONG GROWTH CONTINUES                                      SIGNIFICANT IMPACT OF COVID-19

         Booked orders                                                     $125m

                                                              $61m                 5

                                              $25m
             $1m              $7m

             2015            2016             2017             2018        2019*

                     STRATEGIC MOVE INTO DIAGNOSTICS                                   OUTLOOK – KEY VALUE DRIVERS

                                                                                       Growing                    Improved
                                                                                       revenues                   margins

                                                                                       Increased                  New
                                                                                       market share               opportunities

* 2019 reflects management’s current expectation for booked order intake                                            © IP GROUP PLC 2020 | 16
Life Sciences Portfolio (Excl. ONT)
                                                                                 £31.0m
                                                                       £330.9m
                                                £(7.1)m
                                                            £4.7m

                       £20.0m
                                                                                                                                            £10.4m

                                                                                               £7.8m
£313.2m                                                                               £7.0m
                                                                                                               £6.2m
                                                                                                                                                             £5.7m
                                                                                                       £5.1m

                                                                                                                       £1.1m
Opening              Invested                 Realised    Fair value   Closing
                                                          movement
                                                                                                                                  £(1.1)m
   H1 2020 Key Events
   •    $25m investment in Inivata by NeoGenomics Inc. and option to                                                                             £(3.5)m
        purchase
   •    Hinge Health closed $90m series C round with Bessemer
        Ventures and Atomico, expanded operations, and partnered with                                                                                              £(6.8)m
        CVS and Consortium Health Plans*                                           Inivata    Hinge Health Intelligent          Oxford       Creavo            Autifony
   •    Autifony valuation reduced based on ongoing appraisal of                                           Ultrasound          Biotrans
        prospects for lead drug in schizophrenia

  *IP Group has a 2.9% holding in Hinge Health, Inc.                                                                                        © IP GROUP PLC 2020 | 17
Technology Portfolio
                                                                  £36.8m

                        £(3.0)m
            £4.2m
£203.6m
                                                                     25

                                   £(11.7)m
                                                                                                                              £23.6m

                                                £193.1m

Opening    Invested    Realised   Fair value    Closing                           £6.9m
                                                                          £6.4m
                                  movement                                                                      £5.3m

                                                                                          £1.9m   £1.9m £1.4m
                                                                                                                                               £1.0m
 H1 2020 Key Events
 •   Featurespace £30m funding round led by Merian Chrysalis at
     uplift despite Covid.
                                                                                                                    £(4.3)m
 •   Garrison valuation reduced to reflect slower revenue ramp                                                                     £(5.2)m          £(5.4)m
     than anticipated at Oct 2018 Series B                        Featurespace     Mirriad         Concirrus      Actual       Garrison           Econic
 •   Econic valuation reduced to reflect funding outlook                                                        Experience

                                                                                                                                © IP GROUP PLC 2020 | 18
Cleantech Portfolio
                                                                      £50.0m
    £123.1m
                 £3.3m                                                         £48.7m

                                                      £98.3m

                            £(73.4)m

                                         £45.4m

    Opening     Invested    Realised   Fair value    Closing
                                       movement                                                                            42
                                                                                                        £7.7m         £7.4m
H1 2020 Key Events                                                                      £5.6m
•     Ceres Power strong price performance and sale of the majority                             £3.9m
      of our holding by end July for £125.9m proceeds, realising a                                                                      £1.0m
      multiple of 7x cost.
                                                                                                                                              £(1.0)m
                                                                                                                          £(2.5)m
                                                                                                            £(3.9)m
                                                                      Ceres Power       Magnomatics      Oxbotica       Azuri        Spinetic Energy

                                                                                                                          © IP GROUP PLC 2020 | 19
US & Australasia: early-stage, but promising developments

Source: portfolio company materials                   © IP GROUP PLC 2020 | 20
05
                                          Outlook
Evolving GREAT IDEAS into WORLD-CHANGING businesses
Outlook: financial
                                                                                   Business unit by age of company1

                                                                                      Australasia
  Return

                                                                                              US

                                                                           Strategic Opportunities
                                                                Time
                                                                                       Cleantech

                                                                                            Tech

                                                                                              Life

                                                                                                     0% 20% 40% 60% 80% 100%

                       Investment                    Growth /                          < 5 years      5-8 years   > 8 years
                                                     harvest

              •   Venture portfolio funds typically                    •   The larger, specialist funds (Tech                  •   Third-party institutions already
                  follow a ‘J-curve’                                       and Life) are now quite mature and                      brought into our US Fund
              •   Our portfolio spans start-ups to                         so entering the realisation stage                   •   Opportunities now to extend this
                  scale-ups, a longer time period than                 •   Cleantech was very focused on one                       model across other territories and
                  is typical for a fund                                    asset (Ceres) and so has now been                       investment strategies
              •   Core concept is for multiple                             significantly realised                              •   Generates income, leverages
                  overlapping J-curves with varying                    •   Australasia and US are far younger                      balance sheet capital
                  levels of maturity                                       portfolios and so will remain cash
                                                                           consumptive

1date                                                                                                                                                    © IP GROUP PLC 2020 | 22
           of first IPG investment used as proxy for age of company
Outlook: Impact, ESG and responsible investing

IMPACT                              ESG                              RESPONSIBLE INVESTING
• Impact is a natural driver of     • Released first ESG report      Appointment of Chair of Ethics
  scientific research               • Diversity: 30% club            Committee, Professor Gordon
• Portfolio companies have had        commitment & Investing in      Clark, Oxford University to
  significant impact on the Covid     Women Code                     oversee Ethical Investment
  19 pandemic response                                               Framework and Committee
                                    • Carbon Neutral: two woodland
                                                                     “Really pleased to see the appointment of
• Alignment to SDG3                   projects to offset emissions   Gordon and the importance that is being
                                                                     placed on ESG,”
                                                                                 - institutional investor, Australia

                                                                                                  © IP GROUP PLC 2020 | 23
06
                                       Summary
Evolving GREAT IDEAS into WORLD-CHANGING businesses
Summary

• NAV growth and cash-flow positive in the period
• LamPORE a significant, positive development for Oxford Nanopore
• Weight of portfolio by value now entering realisation phase
• Opportunities to grow AuM across geographies, stages and sectors by
  leveraging balance sheet

                                                                © IP GROUP PLC 2020 | 25
Appendix
1 - Board

     Sir Douglas Flint                                   Mike Townend                                         Dr Elaine Sullivan
     Non-executive Chairman                              Chief Investment Officer                             Non-executive Director
     Previously Group Chairman of HSBC, spent 15
     years as HSBC’s Group Finance Director, joining     Capital markets background                           27 years’ international pharmaceutical industry
     from KPMG where he was a partner                    Previously MD European Equities, Lehman              experience including Eli Lilly and AstraZeneca

     Alan Aubrey                                         Angela Leach                                        Heejae Chae
     Chief Executive Officer                             Company Secretary & Group Legal                     Non-executive Director
                                                         Counsel
     Corporate finance background (partner KPMG)                                                             CEO of AIM-listed Scapa Group plc, a global
     Deep expertise of building technology businesses    Background in corporate, commercial and IP law      supplier of products for healthcare and industrial
     Co-founder Techtran Group Ltd; bought by IP Group   Previously CMS Cameron McKenna and Memery Crystal   markets

     David Baynes                                        Professor David Begg                                Dr Caroline Brown
     Chief Operating Officer                             Senior Independent Director                         Non-executive Director
                                                                                                             Background in corporate finance, advising global
                                                         Professor of Economics, Imperial College London.    corporations and governments. Experience in
     Finance and venture background                      Former Economic policy advisor to the Bank of       managing early stage companies in energy and tech
     Co-founder Fusion IP plc.; bought by IP Group       England and Visiting Professor at M.I.T.            sectors.

     Greg Smith                                                                                              Aedhmar Hynes
     Chief Financial Officer                                                                                 Non-executive Director
                                                                                                             Background in communications advising brands
                                                                                                             through digital transformation and technology
     Accounting background                                                                                   disruption. Ranked among the ‘PR Week’ 50 most
     Previously KPMG and $3bn fund of hedge funds                                                            powerful communications professionals in the world.

                                                                                                                                       © IP GROUP PLC 2020 | 27
2 - IP Group’s history

                                                                                Launch of NE Tech       IP Venture Fund II                         Acquisition of Touchstone
                                                                                      Fund                    2013                                        Innovations
                      Flotation                                                       2010                                                                    2017
                                                       Main market &
                        2003                           name change                                                                                                             Sale of majority of
                                                           2006
                                                                                                                                                                                equity in Ceres
                                                                                                                                                                                     Power
                                                                                                                                                                                      2020
                                                                                                   Acquisition of                                   Acquisition of Parkwalk
        Incorporated as                                                                                                                                    Advisors
                                     Acquires          Launch of IP Venture   Agreement with         stake in                  Acquisition of
            IP2IPO                                                                                                                                            2017
                                  Techtran & TTV              Fund              Fusion IP           Technikos                   Fusion IP
             2000
2000

                                       2005                   2006                 2009                2011                       2014

                                                                                                                                                                                                           2020
                                                                          Cardiff and Sheffield
                                                                                   2009
                                                                                                                                                              Nine partners
                                                                                                                                                OSI plc        in AUS/NZ
                                                                                                                    Manchester University
                                                                                                                                                 2015             2017
                                                                                                                       and Cambridge
                                    10 university                                                                    Innovation Capital
                                  partners in the UK                                                                        2013
        Seminal deal with
        Oxford Chemistry
                                                                                                                                                                 ‘Golden
                                                                                                                                                                 Triangle’
                                                                                               Oxford IBME               US university pilots                      2017
                                                                                                  2011                        2013/4

                                                                                                                                                                                © IP GROUP PLC 2020 | 28
3 – Top 20 Holdings & fair value movement in HY 2020
                                                                     Life Sciences        Technology                           Total                                                                        £257.7m

                                                                            IPG FV             IPG FV                      IPG            % of
                                              Category               No                  No                      No
                                                                             (£m)               (£m)                      FV(£m)          total
                                                                                                                                                                                                   £82.6m
                                              Top 20                 10      466.4        9     214.2            19       680.6           67.3%

                                              Multi-sector
                                                                                                                 1         16.6           1.6%
                                              platforms

                                              Total                                                              20       697.2           68.9%

     Life Sciences                            Total %                       46.1%               21.2%                                                                                £50.0m £48.7m
     Technology
     Multi-sector
                                                                                                                                                                            £36.8m
                                                                                                                                                                   £31.0m
                                                                                                                                                        £27.5m
                                                                                                                                            £23.6m
                                                                                                                      £19.4m     £20.4m
                                                                                     £15.2m   £15.8m    £16.6m
                                           £13.2m      £14.4m     £14.6m   £14.5m
                     £11.0m     £12.3m
£10.3m    £10.5m
                                                                                                                                                                       £7.0m      £6.4m
                £0.7m                             £0.9m      £0.7m                                 £1.0m

                                                                                                                                                  £(5.2)m                                                        £(6.1)m
Genomics     Exyn      Artios Crescendo Diurnal     Mission    Yoyo    PsiOxus     Wave       Uniformity Oxford      Ieso         First Light Garrison Ultraleap    Inivata Featurespace Ceres      Istesso   Oxford
 plc (P) Technologies,Pharma Biologics    Group Therapeutics Wallet Therapeutics Optics       Labs, Inc. Sciences Digital          Fusion Technology Holdings       Limited Limited (P) Power       Limited Nanopore
            Inc. (P)  Limited Limited (P) plc (Q) Limited (P) Limited Limited (P) Limited        (P)     Innovation Health         Limited Limited (P) Limited        (P)               Holdings      (P) Technologies
                        (P)                                     (P)                 (P)                    plc (P)  Limited           (P)                 (P)                            plc (Q)            Limited (P)
                                                                                                                      (P)

     Fair value movements include both realised and unrealised movements                                                                                                              © IP GROUP PLC 2020 | 29
4 - Parkwalk
Multi-award winner                                Tier-one university partners

One of the UK’s leading EIS growth fund managers backing technologies from UK
universities
• Complementary model for capital and sourcing
• Strong UK ‘Golden Triangle’ presence
• AUM now £306m
• Over 299 investments into 126 companies
Recent highlights
• Largest EIS Fund in 2018/2019 tax year, raising over £63m
• Won EIS Association’s ‘Best Fund Manager’ for the third year in a row
• Invested £17.6m in HY20 (HY19: £35m)
• Named as the UK’s most prolific investor in AI since 2011

                                                                                 © IP GROUP PLC 2019 | 30
5 - Shareholder register (above 2% holders)
Shareholder                                                           % holding
Railways Pension Scheme                                               15.3%
Invesco                                                               13.7%
Lansdowne Partners                                                    8.3%
Imperial College                                                      5.2%
Ballie Gifford                                                        4.8%
Lombard Odier                                                         4.0%
Schroder Investment Management                                        2.9%
Legal & General Investment Management                                 2.5%
Telstra Super                                                         2.5%
Liontrust Sustainable Investments                                     2.5%
Odey Asset Management                                                 2.3%
Blackrock                                                             2.1%
Total                                                                 c. 66%

*Source: RD:IR database and TR1 filings, correct as at 30 June 2020               © IP GROUP PLC 2020 | 31
6 – Summary income statement
                                                         2020 HY (£m)   2019 HY (£m)
A   Core business
    Movement in portfolio value including funds              31.2          (36.0)
        Income                                               3.0             3.8
        Overhead (incl. incentives)                         (13.3)         (15.5)
    Net operating costs                                     (10.3)         (11.7)
    Incentive costs including carry accrual (non-cash)       (7.3)           2.7
    Consolidated portfolio company costs                     (0.2)          (1.9)
    Profit/(Loss) from core business                         13.4          (46.9)

B   Non-operating and non-recurring items
    Acquisition costs including IFRS3 charge                 (1.2)          (1.6)
    Amortisation                                               -            (0.1)
    Net interest                                             (0.5)          (0.9)
    Taxation                                                   -               -
    Profit/(Loss) after taxation                             11.7          (49.5)

                                                                           © IP GROUP PLC 2020 | 32
7 – Portfolio valuation approach
Quoted                      HY 2020                                    FY 2019                                    HY 2019

                               3% 9%                                      2% 11%                                   8%
Recent
                                                                 19%                                          5%                   24%
financing            20%
(12 months)
Other               20%                    48%                 24%                     44%
valuation
methods                                                                                                                55%
Debt

               • Group seeks to use observable market data as the primary basis for determining asset fair values where
                 possible (bid price, recent financing rounds)
               • Other valuation methods include: market-derived valuations adjusted to reflect considerations including
                 (inter alia) technical measures, financial measures and market and sales measures; discounted cash flows
                 and price-earnings multiples.
               • The Group engages third party valuation specialists to provide valuation support where appropriate.

                                                                                                                          © IP GROUP PLC 2020 | 33
8 – Capital allocation framework
    The Group’s current capital allocation framework can be summarised as follows:

              ORGANIC                                           MANAGE                                     RETURNS TO
              GROWTH                                            GEARING                                   SHAREHOLDERS

•    Allocate capital to sectors and              •   Expect Group to be primarily equity        •   Group has taken significant recent steps
     geographies to achieve attractive                funded but use appropriate debt                towards cashflow sustainability giving
     financial returns and appropriate            •   Gearing, through EIB term facility,            options here.
     diversification                                  currently
9 – EIB debt repayment profile
                                    18.0                                                                                                 80.0

                                    16.0                                                                                                 70.0

                                    14.0
                                                                                                                                         60.0
        Debt repayments per annum

                                             6.3               6.3         6.3           6.3
                                    12.0
                                                                                                                                         50.0

                                                                                                                                                Debt facility
                                    10.0
                                                                                                                                         40.0
                                     8.0
                                             3.2               3.2         3.2           3.2
                                                                                                                                         30.0
                                                                                                     6.3
                                     6.0
                                                                                                                   6.3
                                                                                                                                         20.0
                                     4.0
                                             6.0               6.0         6.0           6.0
                                     2.0                                                                                                 10.0
                                                                                                     3.2                      3.1
                                                                                                                   1.8
                                     0.0                                                                                                 0.0
                                            2020           2021           2022          2023        2024          2025       2026

                                           IP Group Facility         Touchstone Facility 1     Touchstone Facility 2     Total outstanding

                                                                                                                                                                © IP GROUP PLC 2020 | 35
10 – Portfolio Reconciliation; Net & Gross
                                              Number   IPG FV (£m)

ONT                                             1         257.7
Life sciences exc. ONT                          37        330.9
Technology                                      38        192.9
Cleantech                                       13        98.3
Multisector                                     2         19.5
Total UK                                        91        899.3

US                                              27        68.1

Australasia                                     10         5.7

Net portfolio                                             973.1
De minimis & organic                                      12.7

Attributable to third parties/revenue share               39.2

Total gross portfolio                                    1,025.0

                                                                 © IP GROUP PLC 2020 | 36
11 – News from the top ten companies
Company   Group fair value/   Recent news flow
          shareholding
                              •   Raises £48.4m of new capital in addition to the £29.3m raised in Jan
                              •   Launches and partners with UK Govt. on LamPORE – rapid, low cost, scalable assay for detection of SARS-CoV-2
                   £257.7m    •   Involvement in genomic surveillance of coronavirus, ships 200 MinION sequencers to China.
                    15.8%     •   Collaboration with Group 42 in UAE for population scale testing
                              •   Appoints John O’Higgins (former CEO of Spectris) as NED
                              •   Completes funding transaction with aggregate value of £109.5m in new investment and secondary share sales

                              • Raised £6m funding from Future Fund + IP Group
                   £82.6m     • Announces headline results of Phase 2a study of its investigational drug, MBS2320, in rheumatoid arthritis to assess safety
                    56.4%       and tolerability. Primary objective achieved, and drug met with no drug-related adverse events.
                              • Second close of funding in Feb 2019, adding £4m to the £6m raised in Dec 2018 and bringing the total to £10m.
                              • Trading update – revenue/other income to be c£20m, +20-25% than prior year, cash of £108m
                              • Appoints Warren Finegold (fomer Vodafone exec) as NED
                              • Bosch increases equity shareholding in Ceres Power to c.18%, raises £38m
                   £50.0m     • Announces the successful development of its first zero-emission combined heat and power (CHP) system, designed
                    5.5%        exclusively for use with hydrogen fuel.
                              • Ceres & Weichai complete first prototype range extender for Chinese electric buses.
                              • Signs £8m collaboration with Doosan Corporation to develop a SOFC power system for the Korean commercial building
                                market.

                              • Completes £30m funding round led by Merian Chrysalis with IPG, Highland Europe, MissionOG, TTV Capital and Invoke
                   £36.8m       Capital Partners.
                    19.7%     • Ranked in 2019 Tech Track 100 of fastest growing private tech firms by sales.
                              • Completes £25m fundraising led by Insight Venture Partners while MissionOG also participated as a new investor.
                              • Commerical launch of InVisionFirstLung liquid biopsy in the US
                              • Strategic collaboration and $25m investment from US NeoGenomics
                   £31.0m
                              • Co-founder and CSO Nitzan Rosenfeld to receive 2020 Cancer Researcher Award from the European Association for
                    25.7%
                                Cancer Research and Pezcoller Foundation
                              • Collaboration with EORTC for Phase II non-small cell lung cancer (NSCLC) study

                                                                                                                                     © IP GROUP PLC 2020 | 37
12 – News from the top ten companies (cont.)
Company   Group fair value/   Recent news flow
          shareholding

                              • Ultraleap technology integrated in systems by Varjo Technologies and Pimax (consumer VR)
                              • Joins The Khronos Group, an open consortium of leading hardware & software companies creating advanced acceleration
                    £27.5m      standards, started participating in the OpenXR™ Working Group
                     22.6%    • Ultraleap launches following merger of Ultrahaptics and Leap Motion
                              • Completes oversubscribed £35m fundraising, led by Mayfair Equity Partners

                              • Hires security veteran, Colin Mckinty to lead US operations
                    £23.6m    • Included in Tech Nation’s Future Fifty 2019 programme
                     23.4%    • Awarded as Technology Pioneer by World Economic Forum

                              • UKAEA confirms viability of First Light Fusion’s concept at heart of fusion energy reactor design
                    £20.4m    • Appoints GE’s Andreas Lush as NED
                     31.0%    • Working with Mott MacDonald to produce a design vision for a commercial fusion reactor.

                              •   Winner in Red Herring’s top 100 Europe
                              •   Step 2 remote talking therapy service is being rolled out in Lincolnshire
                    £19.4m    •   JoinsTech Nation’s Future Fifty 2019 programme
                     46.5%    •   Launches world’s first AI-enabled mental health treatment platform
                              •   Launches clinical research trial to treat depression & anxiety in patients with Type II Diabetes

                              •   In 2019, OSI invests further £58.2m into portfolio companies, leading on 32 investments
                    £16.6m    •   Total number of investments stands at 78 with a total portfolio value of £290.6m
                     2.3%     •   NAV rises to 118p vs 116.1p, cash and deposits of £173.7m
                              •   Appoints Chris Chambers, long-time OSI board member and investor, as new Chair

                                                                                                                                     © IP GROUP PLC 2020 | 38
13 – Ceres Power: £1m to £1bn in less than 8 years1
           • c£126m (total proceeds) = 7x multiple and gross realised and unrealised IRR of c48%
           • The Ceres proceeds more than “repay” all of the investments in the Cleantech portfolio.
           • Rescued & supported the world’s leading fuel cell technology company which now employs c.300 people.

                                                                                                     IP Capital supported Ceres on
                                                                                                     subsequent funding rounds, with IP      2020: IP Exec recruits new NED, now
                                                                                                     Group leading several investments.      Chair, Warren Finegold.
                                                      2012: IP Group formed a                                                                Sale of £22m of equity in January to
                  2001: Co founded                                                                                                           facilitate Bosch, with further sales of
                                                      £3.3m rescue funding
2001

                                                                                                                                                                                                         2021
                  on IP from Imperial                                                                                                        c£51m and £52m of equity in April and
                  College London                      package.& new strategy
                                                                                                                                             July to broaden share register

                                                     New board formed with IP
                                                     Group CEO as Chair and                     2013: IP Exec recruits Phil
                  2004: Listed on AIM                                                           Caldwell as CEO from                                             Sep 2020: Alan Aubrey &
                                                     cleantech partner as NED;
                                                                                                Intelligent Energy.                                              Rob Trezona retire from
                                                     Steve Callaghan as interim
                                                                                                                                                                 Ceres board.
                                                     CEO

           “The growth we have achieved at Ceres was only possible due to the strong backing from IP Group…. IP Group has a
           philosophy of combining strong management teams with robust science and backing them with both funding and guidance on
           how to operate in the public markets.”
                                                                                                                                                     Phil Caldwell, CEO Ceres Power

       1   £1bn refers to the market capitalisation of Ceres Power on 14 July 2020, the date of the most recent sale of shares by IP Group                                    © IP GROUP PLC 2020 | 39
EVOLVING GREAT IDEAS INTO WORLD-CHANGING BUSINESSES.                                                    The Walbrook Building
                                                                                                                    25 Walbrook
IP Group was set up with a mission to evolve great ideas, mainly from our partner universities, into          London EC4N 8AF
world-changing businesses. We achieve this by systematically helping to create, build and support      Tel: +44 (0) 20 7444 0050
outstanding intellectual property-based companies.                                                     Web: www.ipgroupplc.com
You can also read