Investor Presentation Review of FY2019 - Version 1.0 - John Keells Holdings

Page created by Juanita Frazier
 
CONTINUE READING
Investor Presentation Review of FY2019 - Version 1.0 - John Keells Holdings
Investor Presentation
   Review of FY2019
   Version 1.0

   This Investor Presentation should be read in conjunction with the JKH Annual Report 2018/19 to obtain a more
   comprehensive understanding of the drivers and strategies of our businesses
John Keells Group - Confidential
Investor Presentation Review of FY2019 - Version 1.0 - John Keells Holdings
About JKH

  ▪ Market cap of USD 1.14 billion

  ▪ No controlling shareholder - 99% free float

  ▪ Debt : Equity ratio of 23.7%

  ▪ The Board comprises of two Executive Directors and six Independent Non-
       Executive Directors

                                                                              2
John Keells Group - Confidential
Investor Presentation Review of FY2019 - Version 1.0 - John Keells Holdings
Portfolio profitability
  PAT attributable to equity holders
             2016/17                                   2017/18                                  2018/19
             15%
                                   23%                                22%
                                                                                                                         Transportation
       4%                                       33%                                       33%
                                                                                                                   36%   Consumer foods

                                                                                                                         Retail
                                                                            11%
                                                                                                                         Leisure
                                     17%
       32%                                                                                1%                             Property
                                                  5%                    8%
                                                                                                                         Financial
                                                                                                16%          10%
                            10%                                                                                          Services
                                                           20%                                          4%

       Note: The above excludes the contribution from Other including Information Technology and Plantations Services

   ▪     The Group has consciously focused on the shift in the composition of its earnings, targeting a greater
         contribution from higher ROCE earning industry groups such as Consumer Foods, Retail and Financial
         Services
   ▪     2017/18 excludes the one-off surplus transfer of Rs.3.38 billion at Union Assurance PLC
   ▪     The decline in contribution from the Property industry group is due to revenue of residential apartments
         at Cinnamon Life not being recognised
                                                                                                                                      3
John Keells Group - Confidential
Investor Presentation Review of FY2019 - Version 1.0 - John Keells Holdings
Cumulative EBITDA : for the year ended 31 March
   2019
                                                               FY2019                   FY2018            YoY Growth
                        Industry Group
                                                            (Rs. Million)            (Rs. Million)           (%)

       Transportation                                                   4,555                     3,438            32
       Consumer Foods                                                   2,913                     3,132            (9)
       Retail                                                           2,146                     2,520           (15)
       Leisure                                                          5,017                     6,330           (21)
       Property                                                           323                     1,382           (77)
       Financial Services                                               4,548                     8,873           (49)
       Other, incl. IT and Plantation Services                          6,388                     6,439            (1)

       Total EBITDA                                                   25,890                     32,174           (20)
       Recurring EBITDA*                                              25,672                     28,805           (11)

       *Refer page 36 of the JKH Annual Report 2018/19 for commentary on recurring adjustments

                                                                                                                         4
John Keells Group - Confidential
Investor Presentation Review of FY2019 - Version 1.0 - John Keells Holdings
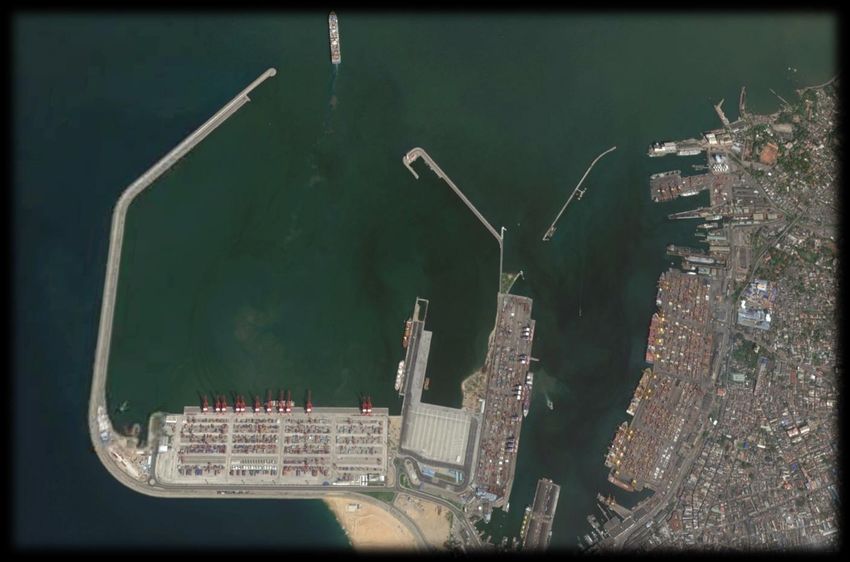
EBITDA : for the quarter ended 31 March 2019

                                                           Q4 FY2019               Q4 FY2018               YoY Growth
                        Industry Group
                                                          (Rs. Million)           (Rs. Million)               (%)
       Transportation                                                 1,282                     497                    158
       Consumer Foods                                                 1,103                     864                     28
       Retail                                                           827                     580                     42
       Leisure                                                        2,375                   2,540                     (7)
       Property                                                         195                   1,158                   (83)
       Financial Services                                             1,590                   6,459                   (75)
       Other, incl. IT and Plantation Services                          437                   1,995                   (78)

        Total EBITDA                                                  7,809                  14,092                   (45)

    Following are the reasons for the deviations in performance due to one-off/non-operational impacts:
    •    Transportation EBITDA in Q4 2017/18 included an impairment provision for doubtful debt and a cumulative deferred
         tax charge at SAGT.
    •    Property EBITDA in Q4 2017/18 included a one-off revenue recognition at Rajawella Holdings Limited on the sale of
         leasehold rights and lower fair value gains on investment in 2018/19.
    •    The performance for the quarter also included an exchange loss at the Holding Company as a result of the appreciation
         of the Rupee, in comparison to an exchange gain recorded in the fourth quarter of 2017/18.

                                                                                                                                 5
John Keells Group - Confidential
Investor Presentation Review of FY2019 - Version 1.0 - John Keells Holdings
Portfolio evaluation 2018/19;
 returns vs. effective capital deployed
                                                                     Industry group               Effective capital employed (%)
 Adjusted ROCE (%)                                        Cinnamon Life                                                           24
                                                          Leisure                                                                 21
                                                          Property (Excluding Cinnamon Life)                                      13
          IT - 54%
                                                          Transportation                                                            8
                                                          Financial Services                                                        6
                                                          Retail                                                                    4
                                                          Consumer Foods                                                            3
                                                          Plantations                                                               1
         Financial Services - 25%                         Information Technology                                                  0.1
                     Transportation - 21%          ▪ In addition, the Holding Company accounts for 18 per cent of effective capital
                              Consumer Foods - 21%   employed which consists primarily of cash
                                   Plantations - 15%
                                     Retail - 13%                                                         Hurdle Rate - 15%

                                           Leisure - 4%
                                                                      Property (Excl. Cinnamon Life) – 0.2%
                                                                                            Cinnamon Life – (0.1%)

                                                                                                              Adjusted effective capital
                                                                                                                     employed (Rs.bn)

                                                                                                                                           6
John Keells Group - Confidential
Investor Presentation Review of FY2019 - Version 1.0 - John Keells Holdings
Investment pipeline comprises primarily of
 Cinnamon Life
   ▪ Investment pipeline comprises primarily of Cinnamon Life, where completion is staggered
   ▪ The realisation of benefits from these investments is expected to accrue from beyond the next
     12-18 months, particularly with Cinnamon Life.
   ▪ These investments will be funded through available/internally generated cash. Some of the key
     projects include:

                                            Project                     Expected completion

        Cinnamon Life - Residential and Commercial towers                   4Q FY2020
                                                                            1Q FY2021
                               - Hotel and Retail Mall
        Reconstruction of Bentota Beach by Cinnamon                          End 2019
        Reconstruction of Cinnamon Hakura Huraa Maldives                     End 2019
        Cinnamon red Kandy                                                    FY2021
        Roll out of 55-60 Retail outlets                                 FY2020 & FY2021
        Retail Centralised Distribution Centre                              1H FY2021
        JK Logistics - construction of a warehouse                          1H FY2021

                                                                                                     7
John Keells Group - Confidential
Investor Presentation Review of FY2019 - Version 1.0 - John Keells Holdings
Transportation - overview
   ▪ 42% stake in SAGT

   ▪ SAGT capacity: ~2 million TEUs

   ▪ Largest cargo and logistics service provider in the country

   ▪ Leading bunkering services provider

   ▪ Joint Ventures with Deutsche Post for DHL air express and A P
       Moller for Maersk Lanka

   ▪ GSA for Jet Airways, KLM Royal Dutch airlines and Gulf Air. Other
       operations include warehousing and supply chain management

                                                                         8
John Keells Group - Confidential
Investor Presentation Review of FY2019 - Version 1.0 - John Keells Holdings
The strategic location of the Port of Colombo
   linking key shipping routes

                                                                            GWADAR
                                                                     BAHL
                                                                                         KARACHI
                                                                                                    KOLKATA
                                                                                    MUMBAI VISHAKHAPATNAM
                                                                                                           CHITTAGONG
                                                                                       CHENNAI                YANGON
                                                              ADEN
                                                                                         KOCHI

                                                       LAMU

                                                 MOMBASA

                                               DAR-ES-SALAM

                                                                            PORT LOUIS

                                   CAPE TOWN

                                                                                                                        9
John Keells Group - Confidential
Investor Presentation Review of FY2019 - Version 1.0 - John Keells Holdings
Capacity enhancements in the Port of Colombo

                          •        CICT - Colombo International Container Terminal
                          •        ECT - East Container Terminal
                          •        SAGT - South Asia Gateway Terminal
                          •        JCT - Jaya Container Terminal
                                                                                     10
John Keells Group - Confidential
Sustained volume growth in the Port of Colombo

                                                               7.05

                                                        6.21
                                                 5.74
          Million TEUs

                                          5.19
                                   4.91

                         4.31

                         2013      2014   2015   2016   2017   2018

                                                                      11
John Keells Group - Confidential
Rapid absorption of capacity in the Port of
    Colombo
                                                      800
                                                                                   Port of Colombo - volumes ('000 TEUs)
   Port                 Container handling
                         capacity (TEUs)
                                                                                                                                        CICT
   Colombo                     8 million
                                                                                                                                        JCT
                                                      600
   Hong Kong                   21 million                                                                                               SAGT
   Singapore                   40 million
   Shanghai                    36 million
                                                      400
                                                                    Q4               Q1           Q2         Q3            Q4

    Volumes        2017/18                                   2018/19                              % YoY     4Q Earnings update:
     (TEU)             Q4             Q1               Q2                Q3               Q4      Change    Transportation industry
   SAGT              507,668         504,312           538,723           516,037        514,589         1
                                                                                                            group
                                                                                                            (Rs. mn)     Q4          Q4
   JCT               559,681         547,629           592,551           604,672        607,913         9              2018/19     2017/18
   CICT              639,002         656,986           676,710           703,470        668,230         5   EBITDA         1,282       497
   Total           1,706,350       1,708,927         1,807,984       1,824,179       1,790,732          5
                                                                                                            • SAGT profits driven by
                                                                                                              improvement in volumes and
                                      2017/18                                 2018/19                         mix.
               SAGT                                                                                         • 2017/18 included an
                                            Q4              Q1            Q2            Q3         Q4
                                                                                                              impairment provision for
   Domestic: Transshipment                   20:80          17:83         17:82           20:80     21:79     doubtful debt and a
   volume mix                                                                                                 cumulative deferred tax
                                                                                                              charge at SAGT.
   Sources: Government websites/ Sri Lanka Ports Authority
                                                                                                                                               12
John Keells Group - Confidential
Opportunities for growth in the Bunkering
   businesses
        Bunkering Business (Lanka Marine Services)

                                             2017/18                            2018/19
                       LMS
                                                 Q4              Q1        Q2             Q3       Q4
            Volume growth                              20             20         2             9        (4)

        ▪     LMS revenue recorded an increase although profitability was impacted by the appreciation of the Rupee

        Port of Hambantota

        ▪     Strong opportunities for private bunkering service providers​ with infrastructure in place for inland
              storage of petrochemicals and a pipeline to the Port
        ▪     The Port will occupy an area of 1,815 hectares and have a capacity to accommodate 33 vessels at a time
        ▪     Positioned within 10 nautical miles of the world’s busiest shipping lanes in which 200 to 300 ships sail
              through on a daily basis

        Logistics Business (John Keells Logistics)
        ▪      Total warehouse space under management grew to approx. 315,000 sq.ft. in the year 2018/19, at a
               capacity utilisation of 90 per cent.

            Sources: Government websites/ Sri Lanka Ports Authority
                                                                                                                         13
John Keells Group - Confidential
Consumer Foods - overview
   ▪    Market leader in soft drinks, ice creams and processed meats
   ▪    Custodians of the consumer brands “Elephant House”, “Keells - Krest”: high brand
        equity
                                                                                                            4Q Earnings update: Consumer
       Key performance indicators (%)           FY2016    FY2017          FY2018               FY2019       Foods industry group
       Growth of frozen confectionery volumes        15            11               (4)              10       (Rs. mn)      Q4          Q4
       Growth of beverage volumes                    22            10              (16)             (25)                  2018/19     2017/18

       Growth of convenience food volumes            11            (4)               3                  7    EBITDA           1,103         864

       EBITDA margin (%)                             26            27               20               18      Frozen confectionery:
                                                                                                            • Improved performance in the
                                                                                                               Frozen Confectionery business
                                                  Q4                      FY2019
       Key performance indicators (%)                                                                          driven by strong volume growth
                                                FY2018    Q1             Q2               Q3       Q4
       Growth of frozen confectionery volumes        2         3               8               7     21     Beverages:
                                                                                                            • Improved profitability in the
       Growth of beverage volumes                  (22)    (37)           (31)            (23)       (6)
                                                                                                              Beverage business as a result of
       Growth of convenience foods volumes          11       12               12               3        1     higher margins.
       EBITDA (Rs. million)                        864     523            691              596     1,103    • Growth in monthly volumes within
                                                                                                              the second half of 2018/19 has
       EBITDA margin (%)                            21       14               16            16       24
                                                                                                              consistently witnessed an upward
       Revenue mix (Bev:FC)                       59:41   49:51          50:50        47:53        49:51
                                                                                                              trend.

   ▪       A sugar tax on carbonated beverages was implemented from 9 November 2017 onwards, resulting in an upward revision
           of the selling prices across the CSD portfolio. Subsequently, the tax was revised to a threshold-based tax for sugar content
           for both CSD and fruit-based beverages in December 2018.
   ▪       Following the implementation of the threshold-based tax, selling prices of large PET packs of the CSD portfolio were
           reduced by ~20 per cent from February 2019, whilst selling prices of selected SKUs will be revised in 1Q of 2019/20                    14
John Keells Group - Confidential
Low consumption patterns and penetration
   reflects potential for sustained growth
                              Bulk vs. Impulse Split - Regional

                                                                              ▪   The bulk-impulse mix of regional markets are
                                               8%               44%               highly skewed towards the impulse markets,
        30%           70%            92%                                          demonstrating the significant growth potential
                                                                        56%       for the impulse category.

           Sri Lanka                   Thailand                   Malaysia

                                    Impulse       Bulk
                                                                              ▪   CCS reformulated its flagship flavours and
                                                                                  currently, approximately 70 per cent of the CSD
                   Carbonated Soft Drinks - Per Capita Consumption
                                       (Litres)
                                                                                  portfolio’s calorific sugar content is reformulated
                                                                                  and replaced with Stevia; a natural sweetener
                                                                                  with zero calories.
           52.0
                            39.0                                              ▪   CCS also implemented the following initiatives;
                                        31.4
                                                                                    •   Launch of sugar free CSD variants -
                                                         19.0
                                                                                        branded “GO Sugar Free
                                                                      10.0
                                                                                    •   Acceleration of non-CSD product launches
        Philippines      Thailand     Singapore     Malaysia      Sri Lanka
                                                                                        (flavoured milk and water branded under
                                                                                        Elephant House, and additional flavours of
                                                                                        fruit juice branded under “Fit-O”)         15
John Keells Group - Confidential
Retail - overview
   ▪     The Retail industry group consists of two business verticals;
           ▪ Supermarkets
           ▪ Office Automation

   ▪     “Keells” is a chain of ~10,000 square foot modern grocery
         retail outlets
    Modern Retail Penetration (%)

          70

                     49          48
                                             43         40

                                                                    16

       Singapore Malaysia       Hong      Taiwan     Thailand Sri Lanka
                                Kong

        Present share of modern retail                No. of outlets
        Keells *                                             96
        Cargills                                             380
        Arpico                                               50
        Laugfs                                               37
        * As at 31 March 2019

       Sources: Central Bank of Sri Lanka, Nomura Research Institute, Unilever Corp, Web articles
                                                                                                    16
John Keells Group - Confidential
Rapid expansion to capitalise on low retail
   penetration levels
                  Modern trade density – population (’000) per store                              Keells Super current coverage
     132

            47

                   30

                          21.0

                                   7.3

                                         4.7

                                               4.5

                                                     3.7

                                                           3.6

                                                                 3.4

                                                                        3.0

                                                                              2.5

                                                                                    1.9

                                                                                          0.9
    Source: Retail and shopper trends in the Asia Pacific, AC Nielsen

▪ Comparatively higher modern trade density – population per store
  ratios as against regional peers
▪ High potential for expansion due to lower penetration of modern trade
  in Sri Lanka
▪ Approximately 225-250 outlets expected by FY2022/23.                                            No. of new stores expected
▪ The sector will undertake planned capex of approximately USD 65                               FY2020             25-30
  million over the next two years for 60 new stores and the construction                        FY2021               30
  of the centralised distribution centre
                                                                                                                                  17
John Keells Group - Confidential
Supermarkets - overview
      Profitability margin                                                                   4Q Earnings update: Retail
                                   FY2016    FY2017      FY2018      FY2019
              (%)                                                                            industry group
   EBITDA (Rs.milllion)              1,537      2,010       1,975       1,623
                                                                                              (Rs. mn)         Q4            Q4
   EBITDA margin                       6.9         6.7        5.3           3.6                              2018/19       2017/18

   EBIT margin                         5.8         5.7        4.0           2.0               EBITDA             827           580

  ▪     Profitability margins were impacted by the cost of expanding and                     • Retail performance was driven
        operating new stores coupled with the one-off cost associated with                     by strong revenue growth in the
        rebranding and refitting stores                                                        Supermarket business
                                                                                               supported by new outlets and a
  ▪     The blended margins in the ensuing year are expected to improve                        pick up in same store sales to
        as a result of the benefit of a larger base of existing outlets showing                4.5 per cent.
        an improvement in the performance. However, there may be a
        certain dilutive effect on margins due to the opening of new outlets

                                                             Q4                                    FY2019
            Key performance indicators (%)
                                                           FY2018                 Q1             Q2             Q3             Q4
   Same store sales growth                                           3.5               1.4             0.8           2.4             4.5
   Same store footfall growth                                        3.8               3.9             2.7           4.2             7.1
   Average basket value growth                                      (0.3)          (2.4)           (1.9)         (1.7)          (2.4)
   EBITDA margin                                                     4.2               3.5             1.6           4.0             5.0
   ▪     The Q4 FY2019 same store sales were driven by the same store footfall growth for the quarter,
         although the average basket vales were impacted by the current economic conditions
                                                                                                                                           18
John Keells Group - Confidential
Leisure - overview
   ▪ Chain of Resort hotels in Sri Lanka

            ‾ 8 Resort hotels in strategic tourist destinations (1,000 rooms)

            ‾ 10% of the country’s 4-5 star class tourist accommodation

   ▪ 2 five star city hotels in Colombo (847 rooms)

   ▪ 240 roomed lean luxury hotel managed by Cinnamon; “Cinnamon red”

   ▪ 3 Resort properties in the Maldives (340 rooms)

   ▪ Established hotel brand – “Cinnamon”

   ▪ Leading inbound tour operator in Sri Lanka

   ▪ Tour operator partners include global players such as Thomas Cook, Kuoni, Hotel
       Plan and Virgin Holidays
                                                                                       19
John Keells Group - Confidential
Round trip offering in key tourist destinations; further
   potential to expand the ‘Cinnamon’ footprint
                                   ▪ Greater focus on asset light investment models as a part of the
                                     strategy to enhance the ‘Cinnamon’ footprint in Sri Lanka

                                   ▪ Land bank of 173 acres of freehold and 127 acres of leasehold
                                     land in addition to 517 acres of leasehold land in Digana

                                        ▪ Of the total freehold land acreage owned, a total of 96 acres
                                          of freehold land are in key tourist hotspots:

                                             ▪ Ahungalla (Southern Province)              : 10.9 acres
                                             ▪ Trincomalee (Eastern Province)             : 14.6 acres
                                             ▪ Nilaveli (Eastern Province)                : 41.7 acres
                                             ▪ Wirawila (Southern Province)               : 25.2 acres
                                             ▪ Nuwaraeliya (Central Province)             : 3.4 acres

                                                                                                          20
John Keells Group - Confidential
Expanding the ‘Cinnamon’ footprint

  ▪ "Cinnamon Hakuraa Huraa Maldives“ and "Cinnamon Bentota Beach Bentota“ - reconstruction
    of new hotels with expected completion in December 2019.

  ▪ The industry group commenced the construction of "Cinnamon red Kandy" in the heart of the
    hill capital of Sri Lanka in January 2019, complementing its round trip offering of its hotel
    portfolio
      • The development will follow a similar asset light business model
      • Jointly developed by John Keells Hotels PLC (KHL) and Indra Traders (Private) Limited
      • Consists 210 rooms at an aggregate investment of Rs.6.50 billion; where KHL’s
          investment is estimated to be Rs.1.00 billion
      • Located in proximity to the upcoming Kandy-Colombo Expressway and is the first LEED-
          Gold green building certified hotel in Kandy.

  ▪ Entered into a MoU and in the process of finalising a sublease agreement for a new property in
    the Maldives with a partner under the "Cinnamon" umbrella.
      • The new property is located in close proximity to the Velana International Airport (VIA).
      • The property will be subleased for a period of 10 years, with the option for further
         extensions.

                                                                                                     21
John Keells Group - Confidential
Occupancies and average room rates
                                   FY2019                                          FY2018                           4Q Earnings update: Leisure
   Sector                                             EBITDA                                           EBITDA       industry group
                   Occupancy        ARR                              Occupancy       ARR
                                                      Margin                                           Margin
                      (%)          (US $)                               (%)         (US $)                              (Rs. mn)          Q4         Q4
                                                       (%)                                              (%)
                                                                                                                                        2018/19    2017/18
   City                      48         128                22                 64         127                  27
                                                                                                                        EBITDA             2,375         2,540
   Hotels*
   Sri Lankan                80             90             28                 81             91               28    • Leisure performance impacted
   Resorts                                                                                                            by lower occupancies in the City
                                                                                                                      Hotels sector due to the
   Maldivian                 84         320                23                 82         263                  24
   Resorts
                                                                                                                      increase in room inventory
                                                                                                                      within Colombo and the closure
  *City Hotels occupancy and ARR excludes Cinnamon red                                                                of "Cinnamon Hakuraa Huraa
                                                                                                                      Maldives" for the reconstruction
                                                                                                                      of a new hotel.

                                                 City Hotels *                           Sri Lankan Resorts                         Maldivian Resorts
   Key indicators
                                   Q1            Q2        Q3            Q4        Q1         Q2         Q3        Q4        Q1           Q2       Q3       Q4
   Occupancy (%)                     43            52           65         48       74            81      70        87             73        79     92           95
   ARR(US $)                        128           127          128        126       69            85      85       109           298       257     300       393
   EBITDA Margin (%)                 13            25           23         25      101            22      21        493          (3)2        18     16           38

   1. The reduced margin as a result of the off-season period for most resort properties.
   2. Impact of the closure of “Cinnamon Hakuraa Huraa Maldives” and the partial closure of “Cinnamon Dhonveli Maldives”
   3. Sri Lanka Resorts EBITDA includes IP gains

   *City Hotels occupancy and ARR excludes Cinnamon red                                                                                                               22
John Keells Group - Confidential
Impact analysis: Easter Sunday attacks 2019
   ▪ Sri Lanka witnessed a series of coordinated attacks on Easter Sunday, 21 April 2019, which
     resulted in a death toll of over 250 people and injured over 500 individuals.
   ▪ The attacks targeted several religious establishments and three city hotels including
     “Cinnamon Grand Colombo”; the flagship city hotel property of the JKH Group. The damages
     sustained to the hotel were limited to the “Taprobane” restaurant and the surrounding
     vicinity.
   ▪ The hotel commenced accepting new bookings soon after the incident while its restaurants
     were opened to the public from 30 April 2019 onwards.
   ▪ The tourism industry witnessed cancellations particularly given adverse travel advisories
     from key source markets within a few days of the incident.
   ▪ However, the safety and security measures are currently confirmed to be in place by the
     Authorities.
   ▪ Subsequent to the the initial cancellations, forward bookings of the Group’s hotels are already
     witnessing a pick-up.

                                                                                                       23
John Keells Group - Confidential
Easter Sunday attacks: recovery seen to be in
   12-18 months
▪ Studies of other travel destinations that were                                         Estimates by the World Travel and Tourism council show the
                                                                                         average recovery time in months by type of crisis:
  impacted by similar terrorism incidents indicate that
  destinations typically require 12 to 18 months to                                        Crisis Category                       Average recovery time (months)
  revert to pre-incident levels.                                                           Political Turmoil                                               26.7

▪ Popular destinations which were affected by acts of                                      Terrorism                                                       13.0
  terrorism such as Bali, Mumbai, Paris and Brussels                                       Pandemic                                                        21.3
  have indicated a recovery in less than 18 months.                                        Environmental Disaster                                          23.8
                                                                                         (Source: World Economic Forum)

    Trend in tourist arrivals post terror attacks:
       Indonesia and Bali tourist arrivals
                                                               Thailand and Bangkok tourist arrivals                        Belgium Tourist Arrivals
  16,000                      Indonesia        Bali                                                                10,000
                                                                                        Thailand         Bangkok
                                                      40,000
  12,000                                                                                                            8,000
                                                      35,000
                                                      30,000                                                        6,000
   8,000                                              25,000
                                                      20,000                                                        4,000
   4,000                                              15,000
                                                                                                                    2,000
                                                      10,000
       -                                               5,000                                                           -
                                                          -
                                                               2000
                                                               2001
                                                               2002
                                                               2003
                                                               2004
                                                               2005
                                                               2006
                                                               2007
                                                               2008
                                                               2009
                                                               2010
                                                               2011
                                                               2012
                                                               2013
                                                               2014
                                                               2015
                                                               2016
                                                               2017

  (Source: World Bank and Bali Hotel Association)              (Source: Ministry of Tourism, Thailand)                 (Source: World Bank)
                                                                                                                                                                  24
John Keells Group - Confidential
Easter Sunday attacks: recovery and way forward

   ▪ The GoSL has proactively initiated a range of measures and concessions to help the revival of
     the tourism industry.:
            ▪ Implement a public relations campaign to curtail the negative global media coverage
              whilst working towards the removal of adverse travel advisories for key tourist markets.
            ▪ A one-year moratorium on loans taken by the tourism related businesses.
            ▪ A proposed amendment to the Value Added Tax (VAT) for hotel and tour operators.

   ▪ The Group re-evaluated its short term plans for recovery of the Leisure businesses,
     particularly in the city hotels. Given the anticipated reduction in arrivals, particularly in the
     next 3 months, which is a relatively lower occupancy period. The mitigatory strategies for the
     immediate short term are as follows:
            ▪ Engage the domestic market to boost occupancy in the short term.
            ▪ Initiate marketing and outreach efforts once travel advisories on key tourist markets are
              removed.
            ▪ Develop agile cost structures within the hotel properties to remain flexible in managing
              short term operations costs.
            ▪ Critical evaluation of operating models to ensure optimum operating costs whilst
              maintaining the sustenance of the brand and service standards.
                                                                                                          25
John Keells Group - Confidential
Trend of tourist arrivals to Sri Lanka
    Annual tourist arrivals to Sri Lanka ('000)
2,500                                                                          Tourist
                                                                                            Growth
                                                                     Year      arrivals
                                                                                             (%)
2,000
                                                                              (In 000’s)

                                                                    2010              654        46
1,500
                                                                    2011              856        31
1,000
                                                                    2012            1,006        18

 500                                                                2013            1,275        27

                                                                    2014            1,527        20
   -
        1985                       1996              2007   2018
                                                                    2015            1,798        18

                                                                    2016            2,051        14
  ▪ Tourist arrivals from January – March 2019 was 740,600,
                                                                    2017            2,116            3
    an increase of 4.6%, as compared to the 707,924 recorded
    in the comparative period of the previous year.                 2018            2,334        10

                                                                   2019-YTD           908            2
  ▪ Arrivals for April 2019 declined by 7.5 per cent.

   Source: Sri Lanka Tourism Development Authority
                                                                                                         26
John Keells Group - Confidential
Significant growth in Asian arrivals to Sri Lanka

                                                                                               962,395   966,731
                                                                                     938,697

                                                                          822,272
   Tourist arrivals

                                                              640,045

                                                    527,656

                                          383,748
                                334,274
                      245,753

                       2010      2011      2012      2013      2014           2015    2016      2017      2018
                                                              Calendar Year

   Source: Sri Lanka Tourism Development Authority
                                                                                                                   27
John Keells Group - Confidential
Tourist arrivals to Sri Lanka lag well below
   regional peers
                              40

                              35

                              30
       Arrivals in millions

                              25

                              20

                              15

                              10

                               5

                               0
                                   Malaysia   Indonesia     Thailand         Vietnam   Cambodia   Sri Lanka
                                                          1990   2018 Actual/ Target

   Source: Governmental tourism websites
                                                                                                              28
John Keells Group - Confidential
Room inventory in Colombo lags far behind other
     popular regional capital cities

             60,000

                                   31,790
                                               30,114
                                                           26,113

                                                                        9,100      7,600
                                                                                            5,019

            Bangkok                Manila   Kuala Lampur   Jakarta   Ho Chi Minh   Hanoi   Colombo

                                                                                                     29
John Keells Group - Confidential
Pipeline of room inventory to support arrivals
   trajectory
      ▪ Colombo is increasingly becoming an attractive location for City Hotel
        developments
      ▪ Expected 5-star room supply:
                                                                                                                     Year of
                                      Development                                         No. of rooms
                                                                                                                   completion
            Cinnamon Life                                                                                 800          1Q 2021
            ITC                                                                                           350             2021
            Ritz Carlton*                                                                                 473             2022
            Total rooms                                                                                1,623
          * Note that the year of completion of the above is uncertain and is likely to be later than stipulated

      ▪ Operations at “Cinnamon Life” is expected to commence in March 2021 with
        the residential apartments and office complex ready for hand over and
        occupation by early 2020

                                                                                                                                 30
John Keells Group - Confidential
Property - overview
   ▪ “John Keells Properties”; explore property development
     opportunities by leveraging on brand equity

   ▪ Focused strategies for expansion via developer/landowner
     tie ups

   ▪ Catering to different target market segments:              “7th Sense” on Gregory’s Road
       ▪ Luxe Spaces
       ▪ Metropolitan Spaces
       ▪ Suburban Spaces

   ▪ High-rise apartment complexes completed
       ▪ “7th Sense” on Gregory’s Road
       ▪ OnThree20
       ▪ The Emperor
       ▪ The Monarch
                                                                                  OnThree20
                                                                                                31
John Keells Group - Confidential
Industry potential
  ▪      Low levels of urbanisation within Sri Lanka in comparison to regional peers

  ▪      Annual condominium supply far below regional peers
                                               Annual condominium supply in regional cities

                                    53,796

                                                                            38,000

                                                                                               2,187

                                      KL                             Ho Chi Minh City         Colombo
      Source:          KL: CBRE property market outlook 1Q 2018 (forecast for 2018)
                       HCMC: CBRE Vietnam property overview Q1 2017 (forecast for 2018)
                       CMB: Internal Estimates (forecast for 2018)
                                                                                                        32
John Keells Group - Confidential
Low penetration of apartment living in Colombo

                                   5%
                                          20%
                                                                      30%                                            36%
                                                       40%                                           45%
                                                                                      50%

           90%
                               95%
                                          80%
                                                                      70%                                            65%
                                                       60%                                           55%
                                                                                      50%

           10%

         Greater            Singapore   Thailand      Thailand       Malaysia        Malaysia   India (Chennai)      India
        Colombo                          (Central    (Outskirts)   (Central KL)    (Greater KL)                   (Bangalore)
                                        Bangkok)
                                                    Apartments     Landed houses

          Source: Company analysis

                                                                                                                                33
John Keells Group - Confidential
Developable land bank of over 36 acres in central
  Colombo
                                                                            ▪ Prime developable land bank of over 36
                                                                              acres held in central Colombo
                                            Cinnamon Lakeside
                                          7.40 acres leasehold land         ▪ One of the largest privately owned land
          Cinnamon Life                                                       banks
         7.1 acres freehold
        3.03 acres leasehold                                                ▪ Opportunities for development at land
                                                     Vauxhall Street
                                                                              banks held in Crescat City and Cinnamon
                                                  9.3 acres freehold land     Lakeside

                                                                            Vauxhall street land bank
                       Crescat                                              ▪ Prime freehold land extent of 9.38 acres,
               8.03 acres freehold land                     Union Place
                                                             1.5 acres
                                                                              to be developed with Finlays Colombo
                                                                              Limited
                                                                            ▪ Located in close proximity to the Beira
                                                                              lake water front which is earmarked for
                                                                              development of recreational and
                                                                              residential projects by the UDA

                                                                                                                          34
John Keells Group - Confidential
Developable freehold land of approximately 25
  acres in close proximity to Colombo city

                                   ▪ Greater connectivity and reduction in travel time to
                                     Colombo city post construction of the outer circular
                                     expressway
                                   ▪ Direct connectivity to the Port City Colombo and a multi
                                     modal transportation hub to be developed
                                   ▪ Opportunity to expand into residential apartment
                                     projects in proximity to the Colombo city

                                   Suburban Space development
                                   ▪ Master planning is currently underway for the 18-acre
                                     land in Thudella
                                   ▪ The site will be developed in phases, as a fully
                                     integrated community with approximately 2,000 units.
                                   ▪ The preliminary approvals for the development are in
                                     place, and the design work has been initiated.

                                                                                                35
John Keells Group - Confidential
Robust development pipeline; on-going
   developments
                                              Number of units sold
           Cumulative sales (units)                                       4Q Earnings update: Property industry
                                               as at 31 March ‘19         group
  Cinnamon Life:
                                                                             (Rs. mn)     Q4 2018/19      Q4 2017/18
           The Residence at Cinnamon Life                         136
                                                                           EBITDA                  195           1,158
        Suites at Cinnamon Life                                   110
                                                                          • Performance of Property was impacted due to
        Cinnamon Life commercial
                                                              4 floors      2017/18 including a one-off revenue
        complex                                                             recognition at Rajawella Holdings Limited on
  Tri-Zen                                                         200       the sale of leasehold rights and lower fair
                                                                            value gains on investment property in
                                                                            2018/19 in comparison to 2017/18.

   1.    Revenue recognition of Cinnamon Life will be upon completion in CY2021. The completion dates of the
         project are as follows:
          ✓ Residential and office towers : March 2020
          ✓ Hotel and retail mall : March 2021
   2.    “Tri-Zen”- an 891 apartment residential development in central Colombo, with expected completion in
         FY2022/23
   3.    Master planning has been initiated for the jointly held 9.38-acre property in Vauxhall Street and the 18-acre
         site in Thudella
   4.    Acquisition of approximately 100 perches of land located in Colombo for a niche residential development
   5.    Future development of the land bank held at Rajawella Holdings Limited, as discussed in detail overleaf
                                                                                                                           36
John Keells Group - Confidential
Robust development pipeline: Scenic 500 acre land
   bank with an 18-hole golf course
   Rajawella Holdings Limited (RHL)
            ▪ Owners of a majority stake in RHL to complement the Group’s leisure and property
              portfolios
            ▪ The 500 acre land in Digana includes an 18-hole, Donald Steel designed, Golf Course and
              developable land extent of approximately 80 acres
            ▪ Currently developing the master plan to maximise the development potential of the land
              plot
            ▪ Troon International has taken over the management of the course and the refurbishment of
              the course commenced in February 2018
            ▪ Expected appreciation of land value with the completion of the central expressway
            ▪ Development and sale of properties such as villas, club house facilities, activity zones and
              possible operation of a hotel in the long term

                                                                                                             37
John Keells Group - Confidential
Cinnamon Life Integrated
                       Resort

                                           38
John Keells Group - Confidential
Integrated development in Colombo

                                      39
John Keells Group - Confidential
Integrated development in Colombo

                                       40
John Keells Group - Confidential
41
John Keells Group - Confidential
As at December 2018

                                   42
John Keells Group - Confidential
As at May 2019
                                   43
John Keells Group - Confidential
Development programme

                                                             Conferencing ; capacity (4,837 pax) in
                                                             three venues and car park facility (2,450
                                                             slots)

                                                             800 guest room hotel, including
                                                             conferencing, banqueting, 7 specialty
                                                             restaurants and entertainment facilities

                                                             Rentable mall and entertainment space of
                                                             372,000 Sq. Ft (Gross – 518,000 Sq. Ft)

                                                             First residential development of
                                                             approximately – 358,000 Sq. Ft
                                                             (231 units).

                                                             Second residential development of
                                                             approximately – 255,000 Sq. Ft
                                                             (196 units).

                                                             A standalone office development -
                                                             254,000 Sq. Ft rentable area
 Note: Areas are subject to change based on final drawings
                                                                                                        44
John Keells Group - Confidential
The growth in Indian MICE travel to complement
   Cinnamon Life
      Indian Outbound MICE (Millions)

                                                        2.11
                                                 1.94
                                          1.78
                                   1.63
                 1.5

               2017                2018   2019   2020   2021

      Source: MasterCard

                                                               45
John Keells Group - Confidential
Financial Services – Insurance sector overview
  ▪ Union Assurance (JKH Stake : 90%)
  ▪ Committed to a “digital first” business model with an investment of over Rs. 800Mn to become the largest digital
    insurer in Sri Lanka​
  ▪ Developing Bancassurance channels - UA entered into exclusive bancassurance partnerships with Nations Trust
    Bank PLC and Union Bank PLC

                      Life Insurance Penetration as a % of                   Life Insurance Gross Written Premiums
                                  GDP - 2016
          6%                                                                                                         80.3
                                                                                                        71.0
          5%                                                                                   64.0

          4%                              Global average – 3.47%                     54.0
                                                                            45.0

                                                                   Rs. Bn
          3%

          2%

          1%

          0%
                                                                            2014     2015     2016      2017     2018

                                                                                                                            46
John Keells Group - Confidential
Financial Services – Insurance sector overview
    Key performance indicators             CY2013   CY2014        CY2015        CY2016     CY2017        CY2018
                                                                                                                    4Q Earnings update:
    Market share (%)                           14         13          13            13             14        14     Financial Services industry
    GWP growth (%)                              8          8          17            19             22        11     group
    Recurring net profit (Rs.Mn)              791        881        1,127         1,313      4,002*        1,640     (Rs. mn)     Q4         Q4
                                                                                                                                2018/19    2017/18
    Surplus from Life Fund (Rs.Mn)            612        750         800          1,100      3,642         1,100
                                                                                                                    EBITDA         1,590      6,459
    Life Fund (Rs.Bn)                        19.3        23.1        26.3          30.3           29.1      32.1
                                                                                                                    • The Life Insurance business
    Capital Adequacy Ratio                    N/A        N/A         N/A         411%        352%         262%
                                                                                                                      included a one-off surplus
   *Excludes a one-off surplus of Rs. 3.38 billion arising from the change in policy liability valuation              and optimal surplus transfer
                                                                                                                      recorded in 2017/18 which
    Key                       Q4 FY2018      Q1 FY2019          Q2 FY 2019       Q3 FY 2019          Q4 FY2019        cumulatively amounted to
    performance                (Jan-Mar       (Apr-Jun           (Jul- Sep        (Oct- Dec           (Jan-Mar        Rs.7.02 billion.
    indicators                  2018)          2018)              2018)            2018)                2019)       • The annual life insurance
                                                                                                                      surplus recorded by UA
    GWP growth
    (% YoY)
                                      12             13                     4               15                (1)     amounted to Rs.1.10 billion
                                                                                                                      in 2018/19.
    Net profit                       304            300               1,638               1,002              178    • Profits were further impacted
    (Rs.Mn)                                                                                                           by the downturn in economic
    Net profit growth                                                                                                 conditions mark-to-market
                                     181            349               1,693                (86)             (41)      losses on its equity
    (% YoY)
                                                                                                                      investment portfolio due to a
   *The company recognised a deferred tax asset amounting to Rs.1.53 billion arising from brought                     decline in the stock market.
   forward tax losses as at 31 December 2017                                                                        • NTB performance impacted
                                                                                                                      by introduction of the Debt
                                                                                                                      Repayment Levy and higher
                                                                                                                      impairment charges.
                                                                                                                                                   47
John Keells Group - Confidential
Financial Services – Banking sector overview
  ▪ Nations Trust Bank (JKH effective economic interest : 32.16%)
      ▪ Focus on SME / retail strategy
      ▪ Franchise for American Express cards
    Key performance indicators                 CY2013            CY2014            CY2015              CY2016          CY2017         CY2018
    Loans and advances growth (%)                      12.10          19.50             22.4               23.70             25.00        19.00
                        Industry (LCB’s) (%)            8.50           12.30            23.50               17.84            15.77       17.87*
    Return on equity (%)                               19.60          19.80            18.20               17.70             17.40        15.26
                        Industry (LCB’s) (%)           17.30           16.80            15.70               17.30            17.50        14.5*
    Net Interest Margin (%)                             5.80           5.80              5.50                5.10             4.50         4.60
                        Industry (LCB’s) (%)            3.70            3.60             3.50                3.50             3.50        3.70*
    NPL ratio (%)                                        3.5                4.2           2.8                   2.8             2.3         4.6
    Deposit base (Rs. Bn)                                96             111              129                 152              194          231
    Asset base (Rs. Bn)                                 142             159              176                 211              268          325
    Net Profit (Rs. Mn)                                2,136          2,537            2,614               2,869             3,371        3,702
    *As at September 2018
        Key performance                Q4 FY2018             Q1 FY2019              Q2 FY2019               Q3 FY2019             Q4 FY2019
           indicators                (Jan-Mar 2018)        (Apr-Jun 2018)         (Jul-Sep 2018)          (Oct- Dec 2018)       (Jan-Mar 2019)
    Net profit (Rs. Mn)                          939                   936                     1,043                  783                  773
    Net profit growth
                                                  30                    33                         3                  (16)                 (18)
    (% YoY)
    Loan growth (% YoY)                           28                    24                       25                    20                   18
    Net Interest Margin (%                       5.5                   5.0                       5.0                   5.0                  4.9
    NPL Ratio (%)                               2.62                  3.06                      3.71                  4.58                 4.88   48
John Keells Group - Confidential
THANK YOU
              This document was produced by John Keells Holdings PLC for information purposes only. The information
               contained in this document are a review of the financial information pertaining to FY2019, and does not
            constitute an issue prospectus or a financial analysis. This Investor Presentation should be read in conjunction
               with the JKH Annual Report 2018/19 to obtain a more comprehensive understanding of the drivers and
                                                      strategies of our businesses.

                Whilst John Keells Holdings accepts responsibility for the accuracy of the information contained in this
           document, it does not assume any responsibility for investment decision made by the prospective investors based
             on information contained herein. In making the investment decision, prospective investors must rely on their
                           own examination and assessments of the Company including the risks involved.

                                                                                                                               49
John Keells Group - Confidential
You can also read