SUSTAINING DIFFERENTIATION - JACQUES ESCULIER Chairman & Chief Executive Officer - Wabco
←
→
Page content transcription
If your browser does not render page correctly, please read the page content below
SUSTAINING DIFFERENTIATION

                                         KeyBanc Capital Markets Industrials & Basic Materials Conference 2018

                                                                            JACQUES ESCULIER
                                                                                Chairman & Chief Executive Officer
                                                                                                       May 31st, 2018
1   WABCO Confidential and Proprietary
FORWARD LOOKING STATEMENTS AND NON-GAAP FINANCIAL MEASURES
Comments in this document contain certain forward-looking statements, which are based on management’s good faith expectations and beliefs concerning future developments. Actual
results may differ materially from these expectations as a result of many factors. These factors include, but are not limited to, the risks and uncertainties described in the “Risk Factors”
section and the “Forward Looking Statements” section of WABCO’s Form 10-K, as well as in the “Management’s Discussion and Analysis of Financial Condition and Results of
Operations - Information Concerning Forward Looking Statements” section of WABCO’s Form 10-K Report. WABCO does not undertake any obligation to update such forward-looking
statements. All market and industry data are based on Company estimates.
This presentation contains certain non-GAAP financial measures as that term is defined by the SEC. Sales, gross profit, operating expenses and operating income, which are adjusted
to exclude the effects of foreign exchange and are denoted by the word “adjusted” in the line item, as well as EBIT and pre-tax income attributable to company, are non-GAAP financial
measures. Additionally, gross profit, operating expenses, operating income, operating income margin, EBIT, tax rate, pre-tax income attributable to company, net income attributable to
company and net income attributable to company per diluted share on a “performance basis” are non-GAAP financial measures that exclude items for separation, streamlining,
acquisitions, discrete and one-time tax items, and other items that management believes may mask the underlying operating results of the company, as applicable. Our tax rate
guidance for the full year is presented only on a performance basis as reconciliation to an expected tax rate on a reported basis would not be meaningful due to the complex nature of
such an estimate. Management believes that presenting these non-GAAP measures is useful to shareholders because it enhances their understanding of how management assesses
the operating performance of the Company's business.
Free cash flow presents our net cash provided by operating activities less net purchases of property, plant, equipment and computer software. Performance free cash flow presents our
net cash provided by operating activities less net purchases of property, plant, equipment and computer software; and excludes streamlining, separation and acquisition related
payments. Management believes that presenting free cash flow and performance free cash flow is useful to shareholders because it demonstrates our ability to generate cash and the
health of our business. Free cash flow and performance free cash flow does not represent residual cash flow available for discretionary purposes since it may not include a deduction
for mandatory debt service requirements and other non-discretionary expenditures.
All of the Non-GAAP financial measures presented herein should be considered in addition to, not as a substitute for, GAAP measures. These measures may not be comparable to
similar measures of other companies as not all companies calculate these measures in the same manner. Certain non-GAAP measures may be used, in part, to determine incentive
compensation for current employees. Reconciliations of the non-GAAP financial measures to the most comparable GAAP measures are included herein and are available in WABCO’s
quarterly results presentations posted on the company’s website.
2 WABCO Confidential and Proprietary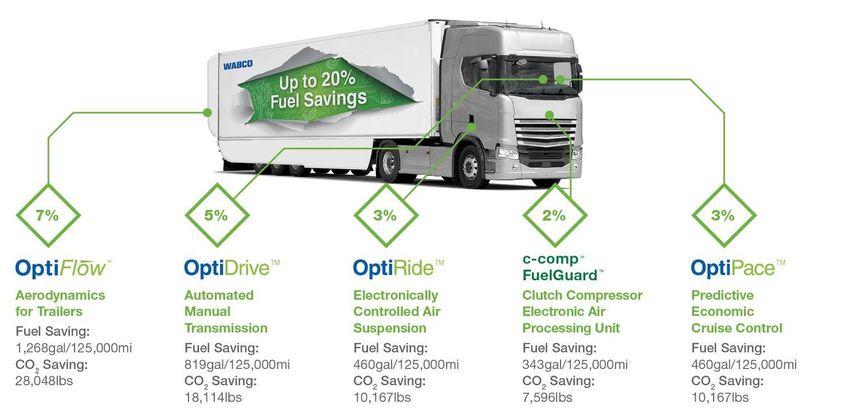
ABOUT WABCO

3   WABCO Confidential and Proprietary
ABOUT WABCO: THE INDUSTRY’S TECHNOLOGY INNOVATOR
                                                                                                        SALES BY CUSTOMER TYPE
In 2017:                                                                                                                6%
                                                                                                                4%

              $3.3B                             ~15,000                 15     Industry technology
                                                                               firsts introduced
                                                                                                                  9%

                                                                                                                24%                    57%
                    Annual                       Employees in
                                                                        during the last 5 years
                    revenues                     40 countries

                                                                                                              OE Truck & Bus       Aftermarket

      No.1                                10 Years           2,900             27                             Trailer
                                                                                                              Car
                                                                                                                                   Off-Highway

       in all BRIC                                           Service
       markets                            NYSE listing       Partners          Factories
                                                                                                                SALES BY REGION
                                                                                                                        3% 1%

                                                                                                                  26%
                 2,600                          $465m                      383                                                           52%
                  Engineers                                                Patents                                18%
                                                Performance EBIT(1)
                  worldwide                     (14.1% Margin)             granted

                                                                                                     Europe   North America     Asia      S.America       Other
                                                                                                                                       See appendix for footnotes

 4   WABCO Confidential and Proprietary
A RICH PORTFOLIO OF TECHNOLOGIES                                                                             X%    AS PERCENTAGE OF
                                                                                                                   WABCO 2017 SALES

             19%                                       12%
                                                                                               3%

                                                                      BRAKING
                                                    Wheel End         CONTROL 35%
                                                                                                Digital Services
                                   Air Processing               Air Brake Valves                                                      12%
                                                                                   EBS & ESC
                       Air Management                                                                     Transmission
           Compressors Systems                                                                              Automation

                                                                                                            Steering Control
                Suspension Control
                                                                                                                                        1%
                                                                                                    Electronic Controls &
                                                                            ABS                      Monitoring Systems

      6%                                        Car Products

                                                                                                               6%
                                             6%

5   WABCO Confidential and Proprietary
OUR VALUE CREATION PROPOSITION
We apply advanced technology and services to support commercial vehicle OEM and fleet needs

                                                    Fleets

                           OEMs                                                                                       EFFICIENCY
                                                                                     CONNECTIVITY                     • Fuel efficiency
                                                    SAFETY                           • Advanced systems integration   • Aerodynamics
                                                    • Braking systems                • Fleet Management Systems       • Emissions reduction
                                                    • Active steering                • Remote diagnostics             • Weight reduction
                        GLOBAL CAPABILITIES
                                                    • Stability control              • V2X communications             • Maintenance costs
                        • Global platforms
                                                    • Collision mitigation systems         • Big data                 • Vehicle and driver performance
                        • Connected R&D network                                                                         monitoring
                                                    • Accident prevention
                        • Frugal engineering
                                                    • Autonomous driving
                        • Localization
                        • Integrated supply chain

6   WABCO Confidential and Proprietary
A BROAD MARKET FOCUS GLOBALLY

             TRUCK & BUS                           TRAILER                 OFF-HIGHWAY                       CAR                          FLEETS

    Ashok Leyland, CNHTC,                 CIMC, Faccini, Guerra,     AGCO, BEML, Caterpillar,      AUDI, BMW, Changan, FCA,     Supporting distributors,
    Cummins, Daewoo,                      GREAT DANE, Kögel          Claas, CNH , Hitachi,         General Motors, Mercedes –   workshops and fleets over
    DAIMLER, Dongfeng, FAW,               KRONE, SCHMITZ             Hyundai CE, John Deere,       Benz, Porsche, SAIC,         vehicle lifetime thanks to:
    Fiat, Foton, GAZ, HINO                Cargobull, Tirsan, Tonar   Komatsu, Liebherr, Liugong,   TESLA, Volvo, VW among       • Global distribution & service
    Motors, Hyundai, Isuzu,               WABASH, Weilton among      SANY, Tandano, Volvo CE,      others.                        network
    KAMAZ, Kinglong, MAN,
    PACCAR, SCANIA, TATA                  others.                    XCMG, ZOOMLION among
                                                                     others.
                                                                                                                                • Comprehensive aftermarket
                                                                                                                                  portfolio
    Motors, Volvo, Yutong, ZF
    among others.                                                                                                               • Fleet Management
                                                                                                                                  Solutions
                                                                                                                                • Digital Services
                                                                                                                                • WABCO Academy

7    WABCO Confidential and Proprietary
WABCO’S SUCCESS IS ROOTED IN OUR CULTURE
Sustaining differentiation throughout a highly diversified, passionately engaged and continuously learning global team

                                                                                    CHANNELLED THROUGH
                                                                               WELL ANCHORED CORE STRATEGIES
                                      POWERED BY PASSION
                 • ANTICIPATION: Reading economic and industry
                     dynamics ahead of the curve

                 • CREATIVITY: First to market with new technologies
                      Continuously applying innovation across our
                      customers’ value chain and vehicle life cycle

                 • EXCELLENCE: Leveraging early globalization and an
                   industry-leading Lean Operating System

 8   WABCO Confidential and Proprietary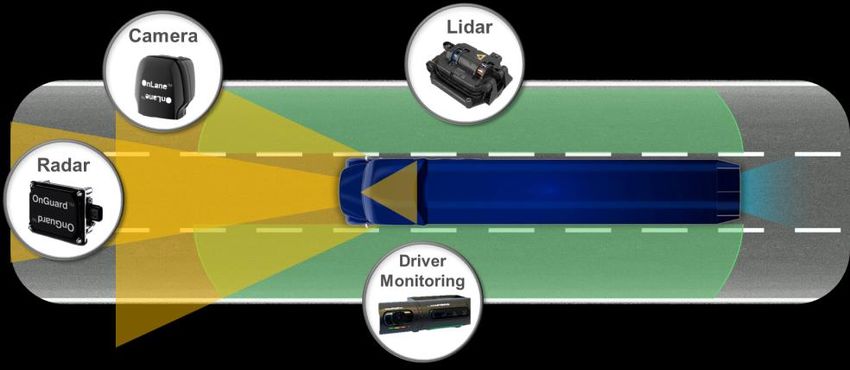
SUSTAINING DIFFERENTIATION THROUGH
                                               TECHNOLOGY LEADERSHIP

9   WABCO Confidential and Proprietary
THE INDUSTRY’S LEADING INNOVATOR IN OUR SECTOR
                                                                                                                                                 OnLaneTM - Lane Departure      Evasive Maneuver Assist
                                                                               RSSplusTM Roll Mitigation System                                  Warning System
                                                                                                                                                                               mBSP TM Modular Braking Platform
                                                                               OnGuardTM Collision Mitigation                                    MAXXUSTM Air Disc Brake
                                                                               System                                                                                          EC-APU Air System Protector
                                                                                                                                                 OptiFlowTM SideWings
     Anti-Lock Braking System (ABS)                                            Hydraulic Transmission              c-compTM Clutch
                                                                               Automation System                   Compressor                    EBS for Hybrid Drivelines     MAXX22TTM Air Disc Brake
     Traction Control System
                                                                               d-compTM Dual Stage Compressor      Trailer OptiLoadTM            New Generation Automated      OptiPaceTM
     Pneumatic Transmission                                                                                                                      Manual Transmission
     Automation System                                                         New Generation Air Disc Brake       ESCsmartTM Simulation                                       OnGuardACTIVETM
                                                                                                                                                 Improved Integrated Vehicle
                                                                               Air System Protector                System                        Tire Monitoring (IVTM TM)
     Electronically Controlled Air                                                                                                                                             Electronic Stability Control (ESC)
     Suspension (ECAS)                                                         Trailer EBS-E                       Trailer OptiTurnTM            Modular EBS                   for Hydraulic Braking

           1980’s                                  1996                                 2004                            2009                           2011                          2015
             to                                     to                                   to                              to                             to                            to
            1995                                   2003                                 2008                            2010                           2014                          2017

                                          Trailer EBS                               OnGuardMAXTM                  Air Disc Brake MAXXTM22                                      OnCityTM
                                                                                    Autonomous Emergency
                                          Electronic Braking System (EBS)           Braking System                Trailer Remote Control                                       OnGuardMaxTM

                                          Roll Stability Support (RSS) for          h-compTM High Output          TrailerGUARDTM Telematics                                    OnHandTM
                                          Trailers                                  Compressor
                                                                                                                                                                               WABCO Communications Unit
                                                                                                                  OnGuardPLUSTM Advanced
                                          Integrated Vehicle Tire                   OptiDriveTM Transmission      Emergency Braking System
                                                                                    Automation System                                                                          OptiFlowTM AutoTail
                                          Monitoring (IVTM TM)
                                                                                                                  TailGUARDTM Rear Blind                                       OnLaneASSIST™
                                          ECAS for automotive                       Trailer Telematics            Spot Detection
                                                                                                                                                                               OnSide
                                          Electronic Stability Control (ESC)                                      e-compTM Electrically Driven
                                                                                                                  Compressor                                                   OptiLock
                                          Adaptive Cruise Control
                                                                                                                  FuelGuardTM Electronic Air                                   OptiLink
                                                                                                                  Processing Unit

10   WABCO Confidential and Proprietary
ANTICIPATING THE EVOLUTION OF OUR INDUSTRY
Mega Trends
Population Growth,
Urbanization & Regulatory Increasingly Exponential
Smart Push for Greener Complex Growth of New
infrastructure Environment Customer Needs Technologies
Commercial
Segmentation
Transportation
of Commercial Vehicles
Requirements
Long Haul Urban / Suburban Off-Highway
Transportation Transportation Application
Impact on Commercial
Vehicles Requirements
11 WABCO Confidential and ProprietaryWABCO BLUEPRINT FOR AUTONOMOUS DRIVING
360° SENSING
CONNECT
Predictive control:
- Predicts traffic situation
- Learns behaviors
- Defines system reaction
Braking Active
- 100ms cycle
system Steering
Reactive Control:
Stability - Measures vehicle situation
Control - Safety critical
Dynamic Motion Control - 5ms cycle
Vehicle
Sensors AMT
Fail Safe Vehicle Architecture
12 WABCO Confidential and ProprietaryTECHNOLOGY TO ADVANCE VEHICLE SAFETY AND AUTONOMOUS DRIVING
We have a solid roadmap identified towards a vision for zero accidents and automated vehicles
Driver Behavior Monitoring
Monitoring
Blind Spot
Stop’n’Go Assist Active Steering Collision Avoidance
Platooning
Electronic Stability Control Active Braking Collision Mitigation
Vulnerable Road User Protection
mBSP™ MAXX™ AMT
SYSTEMS INTEGRATION
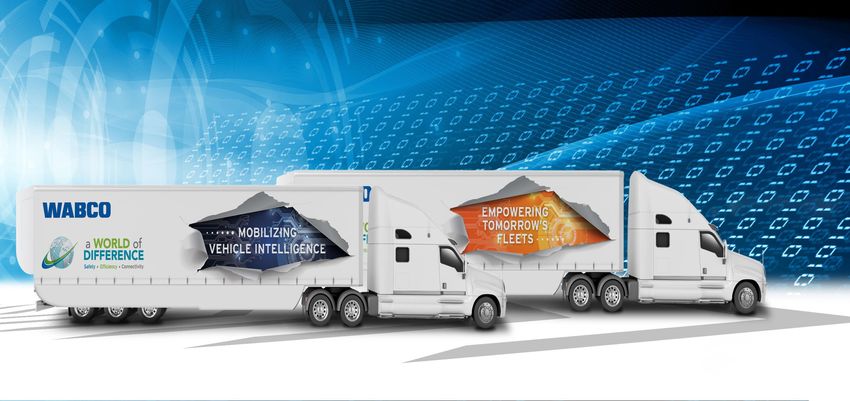
13 WABCO Confidential and ProprietaryTECHNOLOGY TO ADVANCE VEHICLE EFFICIENCY A vehicle equipped with all WABCO efficiency technologies can increase fuel economy up to 20% 14 WABCO Confidential and Proprietary
DRIVING VEHICLE EFFICIENCY & SUSTAINABILITY

                                   Fuel Efficiency                                         Energy                  Electric Vehicles
                                                                                         Recuperation

                    Electronically
           Clutch   Controlled Air           Automated     Hybrid EBS   Air Processing
         Compressor  Suspension                Manual                        Unit         EBS Brake Control
                                            Transmission
                                                                                                                                 Electrically Driven
                                                                                                                                   Compressor or
                                                                                                                                  compressed air
                  Trailer Aerodynamics                                                                                              replacement

                                                                                                              Electronic -APU

                                                                                                                                 Electro
                                                                                                                                Mechanical
                                                                                                                                  Brake
                                                High Output
                          Lightweight Air     Compressor with
                            Disc Brakes        Alu-Crankcase

                                Weight Reduction

15   WABCO Confidential and Proprietary
CONNECTIVITY: MOBILIZING VEHICLE INTELLIGENCE
WABCO uniquely offers insights on truck, trailer and driver performance
Other Data
Providers
Big Data & Analytics
Provide a Broad Spectrum of Vehicle Systems Data
V2X
Platooning
(V2V)
16 WABCO Confidential and ProprietaryDELIVERING FLEET CRITICAL DATA AND ACTIONABLE INFORMATION
TO ONE SINGLE PLATFORM
TX-CONNECT
Cost management & efficiency € Safety & security
Compliance
Maintenance & repair
ECO
WABCO Service network
Satisfaction
WABCO Academy
Supply chain visibility
TX-TRAILERGUARD TX-SKY
WABCO ITP
TX-FLEX
REMOTE DOOR LOCK
CARGO
REMOTE
TRAILER DIAGNOSTICS REMOTE
TRUCK DIAGNOSTICS
OPTITIRE
EBS
BRAKE WEAR
17 WABCO Confidential and ProprietaryEXPANDING RESERVOIR FOR ORGANIC GROWTH
Content per vehicle gap between regions fuels technology adoption Advanced Technology
Adoption
Advanced Technology
Adoption
~$3200
Applicable content per vehicle
~$3000
~$1500
~$1000 ~$1000
~$500
~$300
2014 Today Future
* AT CONSTANT FX
18 WABCO Confidential and ProprietarySUSTAINING DIFFERENTIATION THROUGH
GLOBALIZATION
19 WABCO Confidential and ProprietaryDIFFERENTIATION THROUGH GLOBALIZATION
Global network of development, manufacturing and distribution operations POLAND
RUSSIA
Moscow
GERMANY Wroclaw
Gronau Stanowice
Hannover
Mannheim
CANADA
Oakville, ON
UNITED STATES OF AMERICA CHINA
UNITED KINGDOM Jinan
Rochester Hills, MI
Leeds Qingdao
Troy, MI
North Charleston, SC Taishan
Hebron, KY BELGIUM Shanghai
North Mankato, MN Brussels
Hanover, PA Ieper
Wytheville, VA SOUTH KOREA
Pyungtaek
MEXICO JAPAN
Empalme, Sonora Tokyo
San Luis Potosi
THAILAND
Rayong
BRAZIL
Campinas S.P.
INDIA
Chennai
Mahindra World City
Jamshedpur
Lucknow
Global Headquarters Pantnagar
Pune
20 WABCO Confidential and ProprietaryGLOBALIZATION: A PILLAR OF WABCO’S DIFFERERENTIATION
10
in all BRIC markets
• Uniquely able to supply truck, bus
and trailer technologies across the
globe
of WABCO’s workforce is located Resources, connectivity and
• All regions managed by well- 67% in emerging markets capabilities to
established local teams cost-efficiently support
• Optimized cost structure manufacturing sites around the
leverages mature, fully integrated 27 globe: benchmarks for lean growth strategies in every
global engineering and supply manufacturing standards market
chain presence in all markets
of WABCO’s engineers located in
• Differentiating aftermarket service 55% best-cost countries
network and products
WABCO’s service and technical support
In 2017, WABCO won 25 115 2900 4500
nationalities in
25 major awards from
10 WABCO's senior
customers
executive team Countries Service Partners Distributors
21 WABCO Confidential and ProprietaryTHE DNA OF OUR INNOVATION LEADERSHIP
Advanced Development A Globally Integrated Product Development Team
Organization
seeds innovation, leads technology screening
and concept validation for rapid protoyping
Skilled Application Engineers
in all key regions provide excellent
Broad System &
customer connectivity and support
Vehicle Expertise
During the last decade: Advanced Best Frugal
Strength in Technology Development Solution Engineering
& Innovation
100% Increase in number
of engineers
>30% Increase in R&D
investment
On an annual basis:
Frugal Engineering Expertise
Rich Software
- able to create pull for new technologies
>380 Patents granted* Expertise
and mature products in increasingly price
sensitive markets
>900 Products released*
- Delivers Advanced Technologies at Best Cost
* As of December 2017
22 WABCO Confidential and ProprietarySUSTAINING DIFFERENTIATION THROUGH
EXCELLENCE IN EXECUTION
23 WABCO Confidential and ProprietaryEXCELLENCE IN EXECUTION
WABCO Operating System (WOS)
The WOS defines WABCO’s unique culture and powers us to sustain differentiation in quality,
performance and service to customers
• Built on a backbone of Six Sigma Lean
o Rigorous management environment across global operations
o Standardized processes embedded within advanced quality management systems
• Efficient and agile organization of resources in every region
• Drives continuous productivity within the design – build – deliver value chain
• Learning culture and individual empowerment to continuously advance quality
• Passion to drive excellence in execution as a differentiator for customers
24 WABCO Confidential and ProprietaryABOUT WABCO
AFTERMARKET
25 WABCO Confidential and ProprietaryWABCO AFTERMARKET: CREATING THE HIGHEST BRAND LOYALTY
>170,000 Trained mechanics
Largest trained community
TRUST KNOW WABCO
>27,000 Diagnostics subscribers
Leading penetration
14 Distribution centers worldwide
Best Customer Proximity
REACH WABCO
GET WABCO 2,900 Service partners
Industry benchmark
4,500 Distributors
Worldwide availability
26 WABCO Confidential and ProprietaryTHE INDUSTRY’S MOST COMPREHENSIVE AFTERMARKET PORTFOLIO
Anchored to the fleet eco-system
Fleets
OES Drivers
Distributors Workshops
Delivering differentiated products for every vehicle in every market
ORIGINAL REMAN PROVIA REPAIR KITS RETROFIT WORKSHOP
SOLUTIONS SOLUTIONS
Continuously
expanding our
segment
Trusted Enabling Improving fleet Delivering smart
OE choice Competitive at
original budget quality repairs safety & efficiency productivity tools
premium brand OE quality
parts
WABCO Confidential and ProprietarySUSTAINING DIFFERENTIATION THROUGH
MARKET OUTPERFORMANCE AND
OUR FINANCIAL FRAMEWORK
28 WABCO Confidential and ProprietaryDIFFERENTIATION THROUGH OUTPERFORMANCE
2010 - 2017
+ 2% CAGR* Truck & Bus Production
AVERAGE REGIONAL TRUCK & BUS
15.0%
OUTPERFORMANCE 2010 - 2017 + 9% CAGR WABCO sales
10.0%
MARKET
OUTPERFORMANCE
6% to 10%
5.0%
0.0%
Europe North South Japan/ China India
America America Korea
2017 production as reported in February 2018 * CAGR – Compound annual growth rate
29 WABCO Confidential and ProprietaryORDERBOOK SUBSTANTIATES ROBUSTNESS OF OUTPERFORMANCE
… in the context of sales and New annual business wins announced
outperformance commitments since 2014 …
$2.7B
to $3.5B
~$0.7B
~$0.6B ~$0.8B ~$0.7B
~$0.6B
~$0.5B
OE sales next Cumulative 5yr Cumulative 5yr New OE business 2014 2015 2016 2017 2018
5 years at flat impact of OE price needed over 5yrs
FX and flat platform phase- concessions to achieve
market out OE sales outperformance Next 5 years sales impact
30 WABCO Confidential and ProprietaryWABCO’S FINANCIAL FRAMEWORK
Incremental Margin(7)
Sales growth Incremental margin
Maintain
3% to 5%
margin
5% to 10% 15% to 20%
10% to 15% 20% to 25%
See appendix for footnotes
31 WABCO Confidential and ProprietaryDIFFERENTIATION THROUGH INCREMENTAL MARGIN & CASH CONVERSION
INCREMENTAL MARGIN(7) CASH CONVERSION(3/6)
2012 DERIVED FROM GROWTH 80% - 90%
110%
2010 AVERAGE CONVERSION
2011 RATE ~ 90%
100%
$328
2013 $326
$361
2015
$274
90%
* 2017
$281
$142 $276
Target
2014 Incremental
80%
2016 Margin Range
$250
WABCO Actual
PERF. FREE CASH FLOW (3) (6) IN $M
70%
2009 2010 2011 2012 2013 2014 2015 2016 2017 2018
See appendix for footnotes
*excl. $18M non-cash pension
32 WABCO Confidential and Proprietary1ST QUARTER PERFORMANCE
AND FY GUIDANCE
33 WABCO Confidential and ProprietaryQ1 2018 SALES & TRUCK AND BUS MARKET OUTPERFORMANCE
Q1 2018 Sales Bridge Q1 2018 YoY Sales Growth (4) By Channel
• T&B markets strong in all key regions
84.7 1,003.3 OE 34% • Double-digit growth in all customer groups
71.8
in $ Millions
99.5 • Acquisitions contributing 19%
11.3%
747.3 9.6%
13.3% Translational • Double-digit growth in APAC, CEE and NAFTA
Organic US Acquisitions FX Aftermarket 22% • Continued market erosion in Middle East
• Acquisitions contributing 16%
2017 2018
2018 YoY T&B Sales Growth (4) vs. Estimated Production Growth by Region
WABCO Est. Production Comments
Europe 7% 6% • Europe: Increasing content per vehicle partially offset by phase-out of prior generation AMT
North America 92% 22% • N. America: Increasing content per vehicle from AMT and ESC; Acquisitions contributing 53%
South America 61% 51% • S. America: Product launch of new Tristop and increased penetration of AMT and Air Compressor
Japan/Thailand/Korea (2)% (5)% • Japan/Korea: Continued strong outperformance in Japan offset by negative vehicle mix in Korea
China (3)% 12% • China: Unfavorable vehicle model mix more than offsets continued increase of technology adoption
India 36% 20% • India: Launch of steering and continuing to gain market share for recent products
See appendix for footnotes
34 WABCO Confidential and ProprietaryQ1 ‘18 Global T&B
Q1 % of WABCO Production
Sales
MARKET DYNAMICS SHOWING POSITIVE TREND 2017 2018 %
55% 50% 22%
14%
0.5
18% Europe 15% North America
• New registrations of EU heavy trucks up 6% in the first two • Q1 ’18 T&B production up 22% vs. Q1 ’17; up 14% vs. Q4 ’17
months vs. 2017; expected to be flattish for FY 2018
• Class 8 up 50% in Q1 ’18 vs. Q1 ’17 while classes 5-7 was flat vs.
• Total Europe Q1 ’18 T&B production up 6% vs. Q1 ’17 Q1 ’17
• Total Europe down 5% in Q1 ’18 vs. Q4 ’17 • Class 8 orders more than doubled in volume from a year ago
• 2018 T&B production outlook +2% to +7% • 2018 T&B production outlook +10% to +15% with stronger
growth in Class 8
12% 10% 8% 8%
42% China 14% India
• Q1 ’18 T&B production up 12% vs. Q1 ’17; down 10% vs. Q4 ’17 • Q1 ’18 T&B production up 20% vs. Q1 ’17; up 25% vs. Q4 ’17
• Strength in the economy and infrastructure investments • Pick up of demand driven by strong economic growth
supported growth in construction activities
• 2018 T&B production outlook +12% to +17%
• Production drop expected for remainder of FY 2018
• 2018 T&B production outlook -20% to -10%
35 WABCO Confidential and ProprietaryQ1 ‘18 Global T&B
Q1 % of WABCO Production
Sales
MARKET DYNAMICS SHOWING POSITIVE TREND 2017 2018 %
6% 5% 7% Japan & Korea 3% 3% 4% Brazil
• Q1 ’18 T&B production down 5% vs. Q1 ’17; down 5% vs. Q4 • Q1 ’18 T&B production up 51% vs. Q1 ’17; up 24% vs. Q4 ’17
’17
• Further market recovery from a weak Q1 ’17 due to increased
• Korea production down 31% in Q1 ’18 vs. Q1 ’17 due to agricultural activity in an improving economy
production shutdowns driven by low construction activities
• 2018 T&B production outlook +15% to +25%
• 2018 T&B production outlook (incl. South East Asia) -7% to
-2%
24% 24% 10% 10%
Aftermarket Trailers
• Q1 ’18 up 6% vs. Q1 ’17 excluding impact of acquisitions • Q1 ’18 global production down 7% vs. Q1 ’17; down 3% vs. Q4
• Growth in every region except for Middle East with continued ’17 following steep production drop in China
erosion of demand • 2018 global production outlook -5% to flat
• 2018 outlook up 6% excluding impact of acquisitions
36 WABCO Confidential and ProprietaryQ1 2018 STRONG FINANCIAL PERFORMANCE ($ Millions, except per share data)
Profit and Loss Statement Highlights
Q1
(1),(2) (5) Performance vs. 2017
Q1 Reported Performance in local curr. Performance Drivers
Sales $1,003.3 $1,003.3 22.9% • Sales 4.2% vs. Q4’17
• Price erosion $(15.4) or (1.8)%
Gross Profit 309.0 309.0 17.3% • Volume, mix and absorption $26.8
30.8% 30.8% (144) bps • Materials productivity $16.5 (6.4% gross, 5.0% net) incl. $9.1 supplier
settlement compensating delayed cost reduction project
OPEX & Other (162.0) (157.6) 12.3%
• Conversion productivity $9.0 (7.8%)
(16.1%) (15.7%) 146 bps
• Warranty rate increase of $(1.9) due to reversal in 2017
Operating Income 147.0 151.4 23.0% • Labor inflation $(7.9)
14.7% 15.1% 2 bps • Net R&D and other investments $(1.7)
• Transactional FX unfavorably impacts Op. Income $(10.8)
• US acquisitions contributing $22.2 Gross Profit and $(10.0) OPEX
Equity Income 0.4 0.4 • Equity Income down from $5.7 in Q1’17
Non-controlling Int. Exp. (6.0) (6.0) • Non-controlling Interest up from $(3.6) in Q1’17
Other non-operating Exp. (11.4) (10.4) • Other non-operating exp. driven by pension up $0.5 from last year
EBIT $130.0 $135.4 • Streamlining $0.3 vs. $0.1 in Q1’17
13.0% 13.5% • Separation & other performance adj. $(5.7) vs. $(3.5) in Q1’17
Taxes (26.3) (26.0) • 19.6% Performance Tax Rate, up from 19.3% in Q1’17
Net Income* $100.7 $106.4 • Performance Net Income up from $80.3 in Q1’17
EPS $1.87 $1.97 • Vs. Q1’17 reported EPS of $1.48 and performance EPS of $1.47
See appendix for footnotes
37 WABCO Confidential and Proprietary *Represents net income attributable to companyCASH FLOW SUMMARY Q1 2018
Free Cash Flow (in $ Millions)
• Converting 72% of performance net income into cash
Cash Provided by Operating Activities:
• Seasonal build-up of working capital in Q1 combined
• Net Income including non-controlling interest 106.7 with further increase from sales growth
• Depreciation & amortization 31.4
• Share buyback restarted in March ’18 with target to buy
back up to $300M in 2018; repurchased 221K shares at
• Working capital (45.9) a cost of $30.7M
• Changes in other assets & liabilities (3.2)
Net Cash Provided by Operating Activities 89.0
• Borrowed €300M in German private placement market
Net Purchases of PP&E, Tooling & Computer Software (21.3)
• Repayment of $500M US private placement in Q2
Free Cash Flow(3) reported 67.7
• Optimizing capital structure for tax and interest expense
Streamlining, separation & acquisition related payments 8.8
Performance Free Cash Flow(6) 76.5
See appendix for footnotes
38 WABCO Confidential and ProprietaryFY 2018 CORE GUIDANCE ($ Millions, except per share data)
As of Apr 19th, 2018 2018 Performance EPS(2) Guidance Range
Prior Updated
10.0% - 15.0% 12.0% - 16.0% • Annual price erosion unchanged in line with 2017
Sales Growth (4)
(in local currencies) (in local currencies) • Conversion productivity remaining at near record levels
$3,820 - $3,980 $3,885 - $4,015 • Transactional FX ~$(20)M vs 2017 impacts margin by ~(50) bps
Reported Sales • Performance tax rate ~20%
1 Euro = 1.22 USD 1 Euro = 1.22 USD
Performance
14.5% - 14.9% 14.3% - 14.7% UPDATES
Op Margin (1)
Performance • Raw material inflation of ~1.2% up from ~0.8%
$7.20 - $7.70 $7.30 - $7.80
EPS (2) • Increased pension impact from prior guidance of $5M
• Reduction in cost of financing of ~$6M from prior guidance
Performance
80% - 90% 80% - 90% • Average diluted shares ~53.2M
Free Cash Flow (6)
See appendix for footnotes
39 WABCO Confidential and ProprietaryAPPENDIX
RECONCILIATIONS OF NON-GAAP MEASURES TO GAAP MEASURES
40 WABCO Confidential and ProprietaryFOOTNOTES, TABLES & DEFINITIONS
Footnotes
1. Adjusted for streamlining, separation costs and acquisition related costs
2. Adjusted for streamlining, separation, one-time tax & discrete tax items and acquisition related costs
3. Net cash provided by operating activities less net purchases of property, plant, equipment and computer software
4. Adjusted for currency translation
5. Adjusted for currency translation, streamlining, separation costs and acquisition related costs
6. Free Cash Flow(3) excluding payments or receipts associated with streamlining, separation, indirect tax, acquisition, A/R securitization and EC fine related items
7. Adjusted for currency translation, transactional FX and streamlining, separation, acquisition related costs and other items that may mask the underlying operating results of the
company, as applicable
Tables
The tables that follow provide the reconciliations of the non-GAAP financial measures to the most comparable US GAAP measures.
Definitions
Separation costs include all the incremental costs to establish WABCO as a stand-alone separate independent company. It also includes the costs associated with
certain liabilities, including contingent liabilities, that have been assumed by WABCO from Trane, formerly American Standard, in the separation but which are not related
to the Vehicle Controls Business. These costs would include the (i) periodic adjustments to the carrying values of the liability, (ii) interest on certain liabilities and (iii) costs
to defend certain of these assumed liabilities.
Streamlining costs are costs that help adjust the company’s workforce and other resources to changing market requirements.
Acquisition related costs cover costs related to acquiring a business and non-cash expenses associated with purchase accounting including amortization of identifiable
intangible assets.
Indirect tax related costs pertain to costs recorded in 2015 unrelated to the company’s current business operations
41 WABCO Confidential and ProprietaryWABCO HOLDINGS INC. AND SUBSIDIARIES
Three Months Ended March 31, 2018 Data Supplement Sheet (Unaudited)
Three Months Ended March 31,
% of Sales/ % of Sales/ % Chg vs.
2018 2017 Chg vs. 2017
(Amounts in millions, except per share data) Adj Sales Adj Sales 2017
Sales
Reported $ 1,003.3 $ 747.3 $ 256.0 34.3%
Foreign exchange translational effects (84.7) - (84.7)
Adjusted Sales $ 918.6 $ 747.3 $ 171.3 22.9%
Gross Profit
Reported $ 309.0 30.8% $ 240.2 32.1% $ 68.8 28.6%
Streamlining income - (3.1) 3.1
Performance Gross Profit $ 309.0 30.8% $ 237.1 31.7% $ 71.9 30.3%
Foreign exchange translational effects (30.8) - (30.8)
Adjusted Gross Profit $ 278.2 30.3% $ 237.1 31.7% $ 41.1 17.3%
Operating Expenses
Reported $ 162.0 16.1% $ 131.7 17.6% $ 30.3 23.0%
Streamlining income/(costs) 0.3 (3.0) 3.3
Separation costs (0.2) (0.3) 0.1
Acquisition related costs (4.5) (2.4) (2.1)
Performance Operating Expenses $ 157.6 15.7% $ 126.0 16.9% $ 31.6 25.1%
Foreign exchange translational effects (16.1) - (16.1)
Adjusted Operating Expenses $ 141.5 15.4% $ 126.0 16.9% $ 15.5 12.3%
Operating Income
Reported $ 147.0 14.7% $ 108.5 14.5% $ 38.5 35.5%
Streamlining income (0.3) (0.1) (0.2)
Separation costs 0.2 0.3 (0.1)
Acquisition related costs 4.5 2.4 2.1
Performance Operating Income $ 151.4 15.1% $ 111.1 14.9% $ 40.3 36.3%
Foreign exchange translational effects (14.7) - (14.7)
Adjusted Operating Income $ 136.7 14.9% $ 111.1 14.9% $ 25.6 23.0%
Note: The presentation of the performance measures above are not in conformity with generally accepted accounting principles (GAAP). These measures may not be comparable to similar measures of other companies as not all companies
calculate these measures in the same manner.
42 WABCO Confidential and ProprietaryWABCO HOLDINGS INC. AND SUBSIDIARIES
Three Months Ended March 31, 2018 Data Supplement Sheet (Unaudited)
Three Months Ended March 31,
% of Sales/ % of Sales/ % Chg vs.
2018 2017 Chg vs. 2017
(Amounts in millions, except per share data) Adj Sales Adj Sales 2017
EBIT (Earnings Before Interest and Taxes)
Reported Net Income Attributable to Company $ 100.7 $ 80.7 $ 20.0 24.8%
Income tax expense 26.3 15.3 11.0
Interest expense, net 3.0 3.9 (0.9)
EBIT $ 130.0 13.0% $ 99.9 13.4% $ 30.1 30.1%
Streamlining income (0.3) (0.1) (0.2)
Separation costs 1.2 1.1 0.1
Acquisition related costs 4.5 2.4 2.1
Performance EBIT (Earnings Before Interest and Taxes) $ 135.4 13.5% $ 103.3 13.8% $ 32.1 31.1%
Pre-Tax Income
Reported Net Income Attributable to Company $ 100.7 $ 80.7 $ 20.0
Income tax expense 26.3 15.3 11.0
Pre-Tax Income Attributable to Company $ 127.0 $ 96.0 $ 31.0
Streamlining income (0.3) (0.1) (0.2)
Separation costs 1.2 1.1 0.1
Acquisition related costs 4.5 2.4 2.1
Performance Pre-Tax Income Attributable to Company $ 132.4 $ 99.4 $ 33.0
Tax rate on a reported basis 19.8% 15.4%
Tax rate on a performance basis 19.6% 19.3%
Net Income Attributable to Company
Reported Net Income Attributable to Company $ 100.7 $ 80.7 $ 20.0
Streamlining income (0.3) (0.1) (0.2)
Separation costs 1.2 1.1 0.1
Acquisition related costs 4.5 2.4 2.1
Tax items (1) 0.3 (3.8) 4.1
Performance Net Income Attributable to Company $ 106.4 $ 80.3 $ 26.1
Net Income Attributable to Company per Diluted Common Share $ 1.87 $ 1.48
Performance Net Income Attributable to Company per Diluted Common Share $ 1.97 $ 1.47
Common Shares Outstanding - Diluted 53.9 54.5
Incremental Gross Profit and Operating Income Margin Gross Profit Operating Income
Note: The presentation of the performance measures above are
Increase in adjusted sales from '17 171.3 171.3 not in conformity with generally accepted accounting principles
Increase in adjusted income from '17 41.1 25.6 (GAAP). These measures may not be comparable to similar
Incremental Income as a % of Sales 24.0% 14.9% measures of other companies as not all companies calculate these
Less: YoY Transactional Foreign Exchange (FX) Impact 10.8 measures in the same manner.
Increase in adjusted income from '17 excluding transactional FX impact 36.4
Incremental income excluding transactional FX as a % of Sales 21.2%
(1) The tax impacts calculated are based on the statutory tax rate applicable to the item being adjusted for the jurisdiction from which the adjustment arises.
43 WABCO Confidential and ProprietaryWABCO HOLDINGS INC.
Reconciliation of Net Cash Provided
By Operating Activities to Free Cash Flow
(Unaudited)
Three Months Ended
March 31,
(Amounts in millions) 2018 2017
Net Cash Provided by Operating Activities $ 89.0 $ 54.3
Deductions or Additions to Reconcile to Free Cash Flow:
Net purchases of property, plant, equipment and computer software (21.3) (14.4)
Free Cash Flow $ 67.7 $ 39.9
Less: Streamlining & separation payments (8.6) (18.1)
Less: Acquisition related payments (0.2) -
Performance Free Cash Flow $ 76.5 $ 58.0
Note: This statement reconciles net cash provided by operating activities to free cash flow. Management believes that presenting free cash flow
and performance free cash flow is useful to shareholders because it demonstrates our ability to generate cash and the health of our business. Free
cash flow is also one of the several measures used to determine incentive compensation for certain employees.
44 WABCO Confidential and ProprietaryWABCO HOLDINGS INC. AND SUBSIDIARIES
Reconciliation of GAAP to Non-GAAP Financial Measures for Full Year 2018 Guidance
(Unaudited)
(Amounts in millions, except per share data)
Full Year 2018 Guidance
Sales
Reported Sales $3,885.0 - $4,015.0
(1 Euro = 1.22 USD)
Operating Income
Reported Operating Income Margin 13.6% - 14.0%
Streamlining cost, impact to margin 0.2%
Separation costs, impact to margin 0.1%
Acquisition related items, impact to margin 0.4%
Performance Operating Income Margin 14.3% - 14.7%
Net Income Attributable to Company
Reported Net Income Attributable to Company $369.5 - $396.1
Streamlining cost 7.0
Separation costs 5.0
Acquisition related items 17.0
Tax items (1) (10.1)
Performance Net Income Attributable to Company $388.4 - $415.0
Reported Net Income Attributable to Company per Diluted Common Share (2) $6.95 - $7.45
Performance Net Income Attributable to Company per Diluted Common Share $7.30 - $7.80
Diluted common shares outstanding ~ 53.2
(1)
Includes the tax impacts of the above items, calculated based on the statutory tax rates applicable to each adjustment for the
jurisdiction from which the adjustment arises.
Note: The presentation of performance net income and performance net income per diluted common share is not in conformity
with generally accepted accounting principles (GAAP). These measures may not be comparable to similar measures of other
companies as not all companies calculate these measures in the same manner.
45 WABCO Confidential and ProprietaryWABCO HOLDINGS INC. AND SUBSIDIARIES
Reconciliation of Net Cash Provided by Operating Activities to Free Cash Flow
Twelve Months Ended December 31
(Amounts in millions) 2017 2016 2015 2014 2013 2012 2011 2010
Net Cash Provided/(Used) by Operating Activities $ 421.5 $ 405.4 $ 400.3 $ 314.4 $ 665.8 $ 358.3 $ 333.2 $ (190.0)
Deductions or Additions to Reconcile to Free Cash Flow:
Net purchases of property, plant, equipment and computer software (110.5) (107.0) (100.6) (135.9) (121.5) (100.5) (105.2) (73.7)
Free Cash Flow $ 311.0 $ 298.4 $ 299.7 $ 178.5 $ 544.3 $ 257.8 $ 228.0 $ (263.7)
Less: Streamlining & separation payments (40.7) (33.4) (25.7) (22.4) (20.1) (16.5) (22.1) (28.2)
Less: A/R securitization related (payments)/receipts - - - (73.5) - - - 59.6
Less: EC fine related reimbursements/(payments) - - - - 283.7 - - (437.2)
Less: Indirect tax related payments - - (0.3) - - - - -
Less: Acquisition related (payments)/receipts (8.8) 3.4 (0.7) (1.4) - - - -
Performance Free Cash Flow $ 360.5 $ 328.4 $ 326.4 $ 275.8 $ 280.7 $ 274.3 $ 250.1 $ 142.1
Note: This statement reconciles net cash provided by operating activities to free cash flow. Management believes that presenting free cash flow and performance free cash flow is useful to shareholders because it
demonstrates our ability to generate cash and the health of our business. Free cash flow is also one of the several measures used to determine incentive compensation for certain employees.
46 WABCO Confidential and ProprietaryTHANK YOU 47 WABCO Confidential and Proprietary
You can also read