China Hong Kong Opportunities Strategy - Quarterly Market and Strategy Review (formerly known as Hong Kong Opportunities strategy)* - Manulife ...
←
→
Page content transcription
If your browser does not render page correctly, please read the page content below

Third Quarter 2020

China Hong Kong
Opportunities Strategy
Quarterly Market and Strategy Review
(formerly known as Hong Kong Opportunities strategy)*

*To better align with the manager's strategy, the strategy name was changed effective July 1, 2020.
For a discussion of the risks associated with this strategy, please see the Investment Considerations page at the
end of the presentation.
3Q20: Broad based rally continued to be driven by growth sectors
Market Review
• Chinese equities moved higher in the quarter on the back of • A broad-based rally continued in Q3 with healthcare,
strong economic data despite swings in geopolitical tensions. technology and communication leading the gains. Consensus
earnings growth for Chinese equities in 2021 has been
• Fundamentally, macroeconomic data continued to point to a
revised upward from 20.7% to 21.2%, driven by cyclical
healthy recovery. Caixin manufacturing Purchasing Managers’
sectors especially materials and renewable energy.
Index expanded for all three months in the quarter, while retail
sales posted positive year-on-year growth for the first time in Onshore-wise, favorable reforms and measures in China A-
August and exports rebounded strongly in July and August. The shares were released to streamline refinancing in Shanghai’s
result season was also better-than-expected. STAR Board1 and accelerate IPOs in Shenzhen’s ChiNext2.
• Investors are becoming more confident about China’s recovery • Chinese companies going IPOs in Hong Kong or domestic A-
shown in stronger RMB and higher 10-year China bond yield shares market continued to be well-bid and performing well
despite removal of excessive stimulus in May. despite local monetary easing measures had already
gradually phased out in the quarter.
Market Performance – Q3 2020 (%) Sector Performance – Q3 2020 (%)
Strategy’s benchmark MSCI
Zhong Hua is 85% MSCI China 31.1
& 15% MSCI Hong Kong
15.7
17.5 MSCI Zhong Hua 10.8%
12.6
12.5 11.9
8.9 9.7 9.6 6.4
8.0 4.6 2.7
0.0
5.0
-0.9
1.6 -2.9 -4.5
0.1
Consumer Disc
Financials
Info Tech
Utilities
Energy
Materials
Industrials
Consumer Staples
Health Care
Comm Services
Real Estate
US (S&P MSCI Europe UK Emerging MSCI China A- MSCI MSCI
500) World (Stoxx (FTSE) Markets Asia ex shares China Hong
600) Japan Kong
Source: Manulife Investment Management, 30 September 2020
*Index returns are gross total returns for each country / exchange market. Performance shown in USD
1http://www.xinhuanet.com/english/2020-07/03/c_139186841.htm
2http://english.www.gov.cn/news/photos/202008/25/content_WS5f4468cec6d0f7257693af55.html
For Institutional/Investment Professional Use Only. Not for distribution to the public. MSTR.525014 2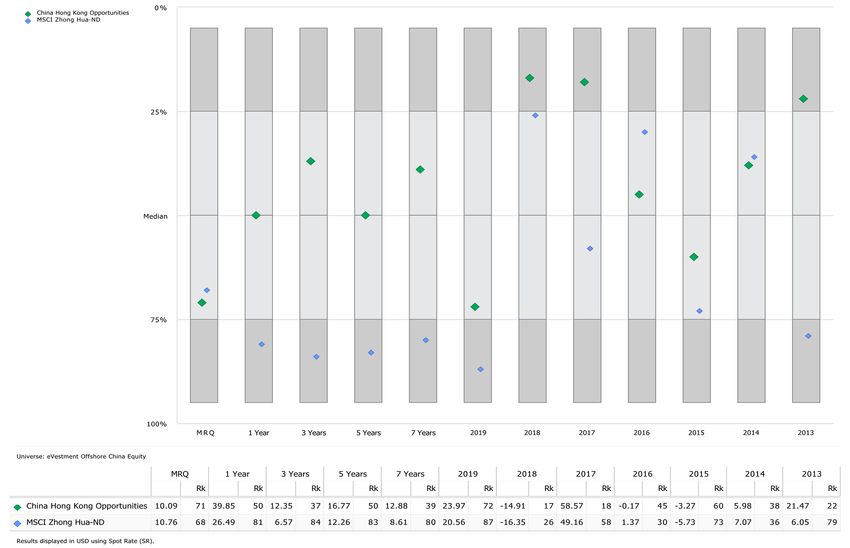
3Q20: Strategy delivered strong absolute returns with marginal
underperformance
What Helped? Preliminary Performance (USD) 3Q20 1Yr 3Yr 5Yr 7Yr SI
• Asset allocation decisions at sector level contributed to China HK Opportunities (Gross)* 10.1 39.8 12.4 16.8 12.9 11.2
positive relative performance. The strategy’s overweight in
Benchmark: MSCI Zhong Hua NR 10.8 26.6 6.7 12.4 8.8 9.8
consumer discretionary and underweight in financials have
helped relative performance. Excess Return over prevailing
-0.7 13.2 5.7 4.4 4.1 1.4
benchmark
On individual holdings, the key contributor was a
MSCI China 10/40 NR 10.5 27.8 6.2 11.8 8.2 10.6
biopharmaceutical company focused on cancer treatments.
The company continued its uptrend on the announcement Excess Return over China equity
-0.4 12.0 6.2 5.0 4.7 0.6
that it had secured Chinese regulatory approval to proceed market
with clinical trial for one of its key products. This further
Attribution over prevailing benchmark
showcased the company’s research capability subsequent to
a few favorable clinical result updates of several drugs in its Detractors Contributors
pipeline.
Selection Effect -210
Allocation Effect 181
What Hurt? Cash -4
Financials 144
• Stock selection in consumer discretionary and consumer Materials 79
staples were the main detractors. Comm Services 54
Utilities 44
• The strategy’s holding in an e-commerce group buying
Health Care 19
platform focused on lower tier cities detracted from
Energy -8
performance. The stock retreated on concerns that the Industrials -25
quarterly results showed a higher customer acquisition cost, Real Estate -37
and competition from key players was getting more keen at Info Tech -61
lower tier cities. We remain positive on the company’s Consumer Staples -84
growth outlook and believed the platform’s active users Consumer Discr -149
have reached a critical mass to bring scale effect.
Total effect (bps)
Source: Manulife Investment Management and FactSet, as of September 30, 2020. Annualized for period over 1 year.
*Note that attribution may not match with official performance figures . Inception Date: 1 January 2006. Current lead portfolio manager: since June 2012.
MSCI Zhong Hua is comprised of MSCI China (85%) and MSCI Hong Kong (15%)
Past performance is not indicative of future results. Performance is shown in USD, gross of fees and does not include advisory fees and other expenses an investor may
incur, which when deducted will reduce returns. Changes in exchange rates may have an adverse effect.
For Institutional/Investment Professional Use Only. Not for distribution to the public. MSTR.525014 3Strategy sector positioning and outlook
• As China gradually comes out from the pandemic, we Sector Active weight (%)
see our investment themes further strengthened by
riding on a more digitalized and more self-
Materials
sufficient economy.
Cash
• In Q3, the strategy has
• taken profits from some of the highflyers YTD in Health Care
the China A-shares and healthcare sector as we
see limited upside from valuation perspective. Info Tech
• added exposures to cyclical growth including
Consumer Disc
building and construction materials to position for
the near to medium term recovery.
Industrials
• added exposure in domestic consumption from
leisure spending to auto and electric vehicles Energy
components, as we see strong pent-up demand
being released. Real Estate
• remain cautious on export-oriented sectors as
they will need to restructure some of their Consumer Staples
products to better cater for domestic demand and
Utilities
this transition may be long and difficult.
Comm Services
• We continue to focus on under-researched ideas
emerging winners and disruptors in the above areas,
Financials
especially in the SMID segment in China A-shares.
(6.0) (4.0) (2.0) - 2.0 4.0 6.0
Source: Manulife Investment Management, FactSet, as of 30 September 2020
For Institutional/Investment Professional Use Only. Not for distribution to the public. MSTR.525014 4China Hong Kong Opportunities Strategy Positioning
SMID cap tilt and actively managed China A-shares exposure
Portfolio breakdown (%)*:
• Strategy’s focus on under-researched ideas resulted in a small and mid cap tilt.
• Selective in China A-shares for unique opportunities not exist in offshore listings.
• Highly actively managed China A-shares exposure (11.5% portfolio holdings only has 0.2% index weight in aggregate)
Market Cap Breakdown (%) Share Type Breakdown (%)
100 95 93 80
80 77
60
60 55
47 Highly active A-shares exposures.
60
Mostly in non-consensus stock picks.
40
40 29
25
20 17 15
20 15 14 14
12 10
5 7
4 1 2 0
0 0
Large cap Mid cap Small cap China (HK-listed) Hong Kong ADRs A-shares
(> USD 5B) (USD 3-5B) (China Equity has always been the primary focus of the strategy
Handpicked outward looking Hong Kong equites as additional alpha source
• The Hong Kong equity holdings in the strategy are mainly outward looking to derive growth from
China, or as beneficiaries of the opening up of Mainland’s capital and financial market.
Historical Allocation by Share Type (%) % Total return of Hong Kong Equity holdings (%)
100
China A: 11.5% 20
80 15.1
15
60 10.5
10
40
5
20 0.7
0
Hong Kong : 16.8%
-
-2.8
Dec-15
Dec-16
Dec-17
Dec-18
Dec-19
Mar-15
Jun-15
Sep-15
Mar-16
Jun-16
Sep-16
Mar-17
Jun-17
Sep-17
Mar-18
Jun-18
Sep-18
Mar-19
Jun-19
Sep-19
Mar-20
Jun-20
Sep-20
-5
3M 1Y
Hong Kong Equity China - ADRs China - HK listed China HK Opps MSCI Zhong Hua
China - A shares Cash
Allocation shown are on ex-cash basis. Total Return based on holdings-based methodology per FactSet in USD term.
Source: Manulife Investment Management, as of 30 September 2020.
Past performance is not indicative of future results. Performance is shown in USD, gross of fees and does not include advisory fees and other expenses an investor may
incur, which when deducted will reduce returns. Changes in exchange rates may have an adverse effect.
For Institutional/Investment Professional Use Only. Not for distribution to the public. MSTR.525014 6Focus on under-researched ideas
Conviction ideas in small & mid cap generated significantly higher returns than
the index
• The strategy’s stock selection in the small and mid cap segment delivered a significantly higher
return than the benchmark constituents.
Historical allocation by market cap Total Return by Market Cap Segment (%)
100%
50 44
42
80%
29
30
20
60%
12 11
10 7
4 4
1
40%
-10
-8
20%
-30 -24
0% Large cap Mid cap (3M) Small cap Large cap (1Y) Mid cap (1Y) Small cap (1Y)
(3M) (3M)
May-13
Oct-13
Jan-15
Jun-15
Jul-17
Apr-16
May-18
Oct-18
Jan-20
Jun-20
Dec-12
Mar-14
Aug-14
Nov-15
Dec-17
Sep-16
Feb-17
Mar-19
Aug-19
LARGE CAP (>USD 5B) MID CAP (USD 3 - 5B)
China HK Opps MSCI Zhong Hua
SMALL CAP (China Hong Kong Opportunities Composite
Investment Results as of 30 September 2020
Annualized Returns (%)
45
39.85
40
35
30 26.63
25 23.14
20 16.77
15 11.92 12.35 12.40 12.88
10.09 10.82 11.25
8.76 9.82
10 6.70
5
0
3 Months YTD 1 Year 3 Years 5 Years 7 Years Since Inception
(1 Jan 2006)
Gross Returns MSCI Zhong Hua Index
Calendar Year Returns (%)
2019 2018 2017 2016 2015 2014 2013 2012
China Hong Kong Opportunities Composite (Gross) 23.97% -14.91% 58.57% -0.17% -3.27% 5.98% 21.47% 24.02%
MSCI Zhong Hua Index 20.71% -16.25% 49.35% 1.52% -5.58% 7.27% 6.26% 24.72%
Excess return (Gross) 3.26% 1.34% 9.22% -1.69% 2.31% -1.29% 15.21% -0.70%
As of 30 September 2020.
Performance shown is the Manulife Investment Management China Hong Kong Opportunities Composite in USD.
Returns greater than one year are annualized. Past performance is not indicative of future results. Performance shown of the strategy is gross of fees and does not include
advisory fees and other expenses an investor may incur, which when deducted will reduce returns. Changes in exchange rates may have an adverse effect.
For Institutional/Investment Professional Use Only. Not for distribution to the public. MSTR.525014 8Capturing the Best of China’s Economic Transition
Why China & Hong
Why This Strategy? Why Manulife IM?
Kong Equities?
• Domestic driven structural • Focus on structural growth • Proven track record with
growth themes remain opportunities from secular stable investment team
intact trends
• Local presence with on-
• China’s economic • Alpha generation driven by the-ground teams in HK,
importance to world’s GDP stock selection thanks to a Taiwan and mainland
growth under-represented consistent and repeatable China via M-TEDA*
by global indices investment framework
• Strong risk management
• China A-shares expected to • Flexible allocation culture
see continuous inflows between Hong Kong and
driven by index inclusion China equities
and diversification benefits
As of September 2020.
*Manulife-TEDA Fund Management Co. Ltd., a 49% joint venture between Manulife Financial and Northern International Trust, part of the Tianjin TEDA Investment Holding Co. Ltd. (TEDA).
Past performance is not indicative of future results. Diversification does not guarantee a profit nor protect against loss in any market.
For Institutional/Investment Professional Use Only. Not for distribution to the public. MSTR.525014 9China Hong Kong Opportunities Strategy
eVestment Offshore China Equity Universe
Top tercile:
• 2018, 2017, 2013 Returns
Source: eVestment as of 30 September 2020
Past performance is not indicative of future results. Performance is shown in gross of fees.
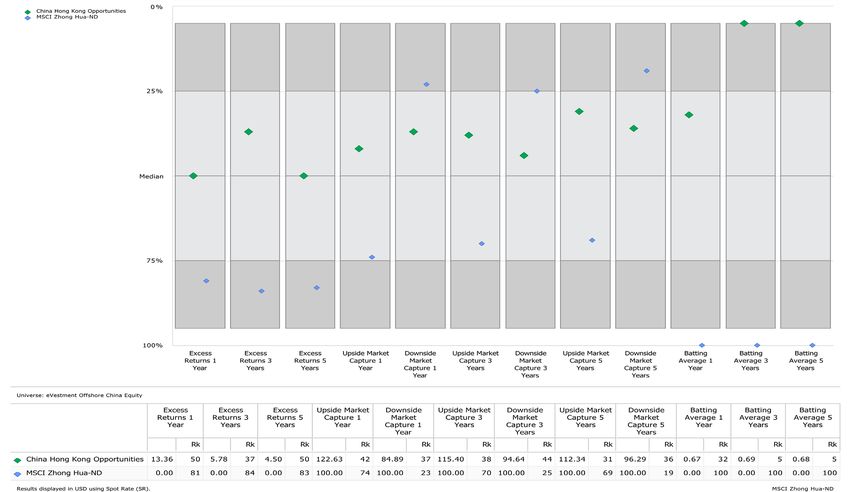
For Institutional/Investment Professional Use Only. Not for distribution to the public. MSTR.525014 10China Hong Kong Opportunities Strategy
eVestment Offshore China Equity Universe
Top tercile:
• 1,3,5 years Batting
Average
• 5 years Upside Market
Capture
Favorable market capture
(Up > down) over 1, 3,
5 years
Source: eVestment as of 30 September 2020
Past performance is not indicative of future results. Performance is shown in gross of fees.
For Institutional/Investment Professional Use Only. Not for distribution to the public. MSTR.525014 11China Hong Kong Opportunities Strategy
eVestment Offshore China Equity Universe
Top tercile:
• 3, 5 years Information Ratio
Source: eVestment as of 30 September 2020
Past performance is not indicative of future results. Performance is shown in gross of fees.
For Institutional/Investment Professional Use Only. Not for distribution to the public. MSTR.525014 12Manulife Investment Management GIPS Presentation
China Hong Kong Opportunities Composite
Creation Date: January 1, 2018 Inception Date: January 1, 2006 Reporting Currency: USD
Schedule of Calendar Year Returns and Assets
Number of Total Assets End Percent of
Gross of Fees Net of Fees Benchmark Composite 3-Yr Benchmark 3-Yr Portfolios End Composite of Period Firm Assets (%)
Year End Return (%) Return (%) Return (%) Std. Dev. (%) Std. Dev. (%) of Period Dispersion (%) (Thousands) End of Period
2019 23.97 23.28 20.71 18.43 17.84Index Definitions
Index Definition
The MSCI Australia Index is designed to measure the performance of the large and mid cap segments of the Australia market. With 70 constituents, the index covers
MSCI Australia
approximately 85% of the free float-adjusted market capitalization in Australia.
The MSCI China Index captures large and mid cap representation across China H shares, B shares, Red chips, P chips and foreign listings (e.g. ADRs). With 150 constituents,
MSCI China
the index covers about 85% of this China equity universe.
The MSCI Hong Kong Index is designed to measure the performance of the large and mid cap segments of the Hong Kong market. With 45 constituents, the index covers
MSCI Hong Kong
approximately 85% of the free float-adjusted market capitalization of the Hong Kong equity universe.
The MSCI Zhong Hua Index is a composite index that comprises the MSCI China (75%) and MSCI Hong Kong Index (25%). The index captures large and mid cap
MSCI Zhong Hua representation across all China securities (B shares, H shares, Red Chips, P Chips and foreign listed shares) as well as Hong Kong securities. Currently, the index also includes
A stock connect large cap shares.
The MSCI India 10/40 Index (Total Return) is a free float-adjusted market capitalization index. The MSCI 10/40 index is designed to measure the performance of the large and
mid cap segments of the India market. It is designed and maintained on a daily basis to take into consideration of the 10% and 40% concentration constraints on funds. A fund
MSCI India 10/40
cannot invest more than 5% of its assets in securities issued by a single issuer. This limit can be increased up to 10%, provided that wherever the 5% limit is surpassed, the
fund’s exposure to these “larger” assets does not exceed 40% of the funds’ total assets.
The MSCI Indonesia Index is designed to measure the performance of the large and mid cap segments of the Indonesian market. With 31 constituents, the index covers about
MSCI Indonesia
85% of the Indonesian equity universe.
The MSCI Korea Index is designed to measure the performance of the large and mid cap segments of the South Korean market. With 111 constituents, the index covers about
MSCI Korea
85% of the Korean equity universe .
The MSCI Malaysia Index is designed to measure the performance of the large and mid cap segments of the Malaysian market. With 41 constituents, the index covers about
MSCI Malaysia
85% of the Malaysian equity universe .
The MSCI New Zealand Index is designed to measure the performance of the large and mid cap segments of the New Zealand market. With 7 constituents, the index covers
MSCI New Zealand
approximately 85% of the free float-adjusted market capitalization in New Zealand.
MSCI AC World Index captures large and mid cap representation across 23 Developed Markets (DM) and 23 Emerging Markets (EM) countries**. With 2,470 constituents, the
MSCI Philippines
index covers approximately 85% of the global investable equity opportunity set.
The MSCI Singapore Index is designed to measure the performance of the large and mid cap segments of the Singapore market. With 27 constituents, the index covers
MSCI Singapore
approximately 85% of the free float-adjusted market capitalization of the Singapore equity universe.
The MSCI Taiwan Index is designed to measure the performance of the large and mid cap segments of the Taiwan market. With89 constituents, the index covers approximately
MSCI Taiwan
85% of the free float-adjusted market capitalization in Taiwan.
The MSCI Thailand Index is designed to measure the performance of the large and mid cap segments of the Thailand market. With 36 constituents, the index covers about 85%
MSCI Thailand
of the Thailand equity universe .
For Institutional/Investment Professional Use Only. Not for distribution to the public. MSTR.525014 14Investment Considerations
A widespread health crisis such as a global annualized compounded return of 10.47%. If an portfolio composition, which will vary. Portfolio
pandemic could cause substantial market volatility, advisory or investment management fee of 0.95% of holdings are representative of the strategy, are
exchange trading suspensions and closures, and the average market value of the account were subject to change at any time, are not a
affect portfolio performance. For example, the novel deducted monthly for the 10-year period, the recommendation to buy or sell a security, do not
coronavirus disease (COVID-19) has resulted in annualized compounded return would be 9.43% and represent all of the securities purchased, sold or
significant disruptions to global business activity. the ending dollar value would be $246,355. Unless recommended for the portfolio. It should not be
The impact of a health crisis and other epidemics otherwise noted, returns greater than one year are assumed that an investment in these securities was
and pandemics that may arise in the future, could annualized; calendar year returns for each one year or will be profitable. Top ten holdings information
affect the global economy in ways that cannot period end in December. Discrepancies may occur combines share listings from the same issuer, and
necessarily be foreseen at the present time. A due to rounding. related depositary receipts, into a singular holding to
health crisis may exacerbate other pre-existing accurately present aggregate economic interest in
Performance information shown is generally for
political, social and economic risks. Any such impact the referenced company.
discretionary strategies/solutions and managed by a
could adversely affect the portfolio’s performance,
Manulife entity which is GIPS compliant and falls No investment strategy or risk management
resulting in losses to your investment.
under the definition of a corresponding Manulife technique can guarantee returns or eliminate risk in
Any performance information shown is the GIPS firm. Some investment strategies/solutions any market environment.
investment strategy composite gross of fees, may not be included in a GIPS compliant firm under
Diversification or asset allocation does not
including advisory and investment management fees certain circumstances, e.g., SMA/UMA business in
guarantee a profit nor protect against loss in any
and other expenses an investor would incur, but net Canada or UMA models in the US.
market. The indices referenced herein are broad-
of transaction costs, unless otherwise noted;
Any characteristics, guidelines, constraints or other based securities market indices and used for
deduction of such expenses would reduce returns.
information provided for this material is illustrative purposes only. The indices cited are
Past performance is not indicative of future results.
representative of the investment strategy and is widely accepted benchmarks for investment
Net performance results reflect the application of the
provided for illustrative purpose only. They may performance within their relevant regions, sectors or
highest incremental rate of the standard investment
change at any time and may differ for a specific asset classes, and represent non-managed
advisory or management fee schedule to gross
account. Such information presented was selected investment portfolios.
performance results, unless otherwise indicated.
by the firm as a representative account that is
Changes in exchange rates may have an adverse If derivatives are employed, note that investing in
deemed to best represent the investment strategy.
effect. Actual fees may vary depending on, among derivative instruments involves risks different from,
Each client account is individually managed; actual
other things, the applicable fee schedule, portfolio or possibly greater than, the risks associated with
holdings will vary for each client and there is no
size and/or investment management agreement. For investing directly in securities and other traditional
guarantee that a particular client’s account will have
example, if $100,000 were invested and investments and, in a down market, could become
the same characteristics as described herein. Any
experienced a 10% annual return compounded harder to value or sell at a fair price.
information about the holdings, asset allocation, or
monthly for 10 years, its ending value, without giving
sector diversification is historical and is not an Source for information shown is Manulife Investment
effect to the deduction of advisory or investment
indication of future performance or any future Management, unless otherwise noted.
management fees, would be $270,704 with
For Institutional/Investment Professional Use Only. Not for distribution to the public. MSTR.513179 15Important Information
© 2020 Manulife Investment Management. All rights reserved. Limited. Indonesia: PT Manulife Aset Manajemen Indonesia. The information in this material may contain projections or other
Manulife Investment Management, the Stylized M Design, and Japan: Manulife Investment Management (Japan) Limited. forward-looking statements regarding future events, targets,
Manulife Investment Management & Stylized M Design are Malaysia: Manulife Investment Management (M) Berhad (formerly management discipline or other expectations, and is only as current
trademarks of The Manufacturers Life Insurance Company and are known as Manulife Asset Management Services Berhad) as of the date indicated. The information in this material including
used by it, and by its affiliates under license. 200801033087 (834424-U) Philippines: Manulife Asset statements concerning financial market trends, are based on current
Management and Trust Corporation. Singapore: Manulife market conditions, which will fluctuate and may be superseded by
This confidential document is for the exclusive use of the intended Investment Management (Singapore) Pte. Ltd. (Company subsequent market events or for other reasons. This material was
institutional investor or their agents and may not be transmitted, Registration No. 200709952G) South Korea: Manulife Investment prepared solely for informational purposes and does not constitute,
reproduced or used in whole or in part for any other purpose, nor Management (Hong Kong). Limited Switzerland: Manulife IM and is not intended to constitute, a recommendation, professional
may it be disclosed or made available, directly or indirectly, in whole (Switzerland) LLC. Taiwan: Manulife Investment Management advice, an offer, solicitation or an invitation by or on behalf of
or in part, to any other person without our prior written consent. (Taiwan) Co. Ltd. United States: John Hancock Investment Manulife Investment Management or its affiliates to any person to
About Manulife Investment Management Management LLC, Manulife Investment Management (US) LLC, buy or sell any security or to adopt any investment strategy, and
Manulife Investment Management Private Markets (US) LLC, and shall not form the basis of, nor may it accompany nor form part of,
Manulife Investment Management is the global wealth and asset Hancock Natural Resource Group, Inc. Vietnam: Manulife any right or contract to buy or sell any security or to adopt any
management segment of Manulife Financial Corporation. We draw Investment Fund Management (Vietnam) Company Limited. investment strategy. Nothing in this material constitutes investment,
on more than a century of financial stewardship to partner with legal, accounting, tax or other advice, or a representation that any
clients across our institutional, retail, and retirement businesses No Manulife entity makes any representation that the contents of investment or strategy is suitable or appropriate to your individual
globally. Our specialist approach to money management includes this presentation are appropriate for use in all locations, or that the circumstances, or otherwise constitutes a personal recommendation
the highly differentiated strategies of our fixed-income, specialized transactions, securities, products, instruments or services discussed to you. Manulife Investment Management or its affiliates does not
equity, multi-asset solutions, and private markets teams—along with in this presentation are available or appropriate for sale or use in all provide legal or tax advice, and you are encouraged to consult your
access to specialized, unaffiliated asset managers from around the jurisdictions or countries, or by all investors or counterparties. All own lawyer, accountant, or other advisor before making any
world through our multimanager model. recipients of this presentation are responsible for compliance with financial decision. Prospective investors should take appropriate
applicable laws and regulations. professional advice before making any investment decision. In all
These materials have not been reviewed by, are not registered with
Any general discussions or opinions contained within this document cases where historical performance is presented, note that past
any securities or other regulatory authority, and may, where
regarding securities or market conditions represent the view of either performance is not indicative of future results and you should not
appropriate, be distributed by the following Manulife entities in their
the source cited or Manulife Investment Management as of the day rely upon it as the basis for making an investment decision.
respective jurisdictions. Additional information about Manulife
Investment Management may be found at of writing and are subject to change. There can be no assurance
www.manulifeim.com/institutional. that actual outcomes will match the assumptions or that actual
returns will match any expected returns. The information and/or
Australia: Hancock Natural Resource Group Australasia Pty analysis contained in this material have been compiled or arrived at
Limited., Manulife Investment Management (Hong Kong) Limited. from sources believed to be reliable, but Manulife Investment
Brazil: Hancock Asset Management Brasil Ltda. Canada: Manulife Management does not make any representation as to their
Investment Management Limited, Manulife Investment Management accuracy, correctness, usefulness or completeness and does not
Distributors Inc., Manulife Investment Management (North America) accept liability for any loss arising from the use hereof or the
Limited, Manulife Investment Management Private Markets information and/or analysis contained herein. Information about the
(Canada) Corp. China: Manulife Overseas Investment Fund portfolio’s holdings, asset allocation, or country diversification is
Management (Shanghai) Limited Company. European Economic historical and will be subject to future change. Neither Manulife
Area and United Kingdom: Manulife Investment Management Investment Management or its affiliates, nor any of their directors,
(Europe) Ltd. which is authorised and regulated by the Financial officers or employees shall assume any liability or responsibility for
Conduct Authority, Manulife Investment Management (Ireland) Ltd. any direct or indirect loss or damage or any other consequence of
which is authorised and regulated by the Central Bank of Ireland any person acting or not acting in reliance on the information
Hong Kong: Manulife Investment Management (Hong Kong) contained herein.
For Institutional/Investment Professional Use Only. Not for distribution to the public. MSTR.513179 16Important Information (continued)
The distribution of the information contained in this presentation may Malaysia: This material was prepared solely for information Instruments Directive (2004/39/EC) as transposed into the relevant
be restricted by law and persons who access it are required to purposes and is not an offer or solicitation by anyone in any jurisdiction. Further, the information and data presented does not
comply with any such restrictions. The contents of this presentation jurisdictions or to any person to whom it is unlawful to make such an constitute, and is not intended to constitute, "marketing" as defined
are not intended for distribution to, or use by, any person or entity in offer or solicitation. in the Alternative Investment Fund Managers Directive.
any jurisdiction or country where such distribution or use would be
contrary to any applicable laws or regulations. By accepting this Singapore: This material is intended for Accredited Investors and United States: Manulife Investment Management (US) LLC
material you confirm that you are aware of the laws in your own Institutional Investors as defined in the Securities and Futures Act. (“Manulife IM US”) and Manulife Investment Management (North
jurisdiction relating to the provision and sale of the funds, portfolios America) Limited (“Manulife IM NA”) are indirect wholly owned
South Korea: This material is intended for Qualified Professional subsidiaries of Manulife. Manulife IM (US) and certain of our
or other investments discussed in this presentation and you warrant Investors under the Financial Investment Services and Capital
and represent that you will not pass on or utilize the information affiliates provide investment management and advisory services in
Market Act ("FSCMA"). Manulife Investment Management does not the United States under the brand name “John Hancock Investment
contained in the presentation in a manner that could constitute a make any representation with respect to the eligibility of any
breach of such laws by any Manulife entity or any other person. Management”. This material is not intended to be, nor shall it be
recipient of these materials to acquire any interest in any security interpreted or construed as, a recommendation or providing advice,
Australia: Manulife Investment Management (Hong Kong) Limited under the laws of Korea, including, without limitation, the Foreign impartial or otherwise.
("Manulife IM (HK)") is exempt from the requirement to hold an Exchange Transaction Act and Regulations thereunder. An interest
Australian financial services license under the Corporations Act in may not be offered, sold or delivered directly or indirectly, or offered,
respect of the financial services being offered in this material. sold or delivered to any person for re-offering or resale, directly or
Manulife IM (HK) is regulated by the Securities and Futures indirectly, in Korea or to any resident of Korea, except in compliance
Commission of Hong Kong ("SFC") under Hong Kong laws, which with the FSCMA and any other applicable laws and regulations. The
differ from Australian laws. This presentation is directed at term “resident of Korea” means any natural person having his place
wholesale investors only. of domicile or residence in Korea, or any corporation or other entity
organized under the laws of Korea or having its main office in Korea.
China: No invitation to offer, or offer for, or sale of any security will
be made to the public in China (which, for the purposes of this Switzerland: This material is intended for Professional Clients,
paragraph, does not include the Hong Kong or Macau Special including Institutional Clients, as defined in the Federal Financial
Administrative Regions or Taiwan) or by any means that would be Services Act ("FinSA") and its implementing ordinance, at the
deemed public under the laws of China. The offering document of exclusion of Professional Clients with an opting-out pursuant to Art.
the subject fund(s) has not been submitted to or approved by the 5 (1) FinSA ("Opting-Out Clients"), and/or Qualified Investors
China Securities Regulatory Commission or other relevant pursuant to the Federal Collective Investment Schemes Act ("CISA")
governmental authorities in China. Securities may only be offered or and its implementing ordinances, at the exclusion of Opting-Out
sold to Chinese investors that are authorized to buy and sell Clients and Managed/Advisory Retail Clients pursuant to Art. 10
securities denominated in foreign exchange. Prospective investors (3ter) CISA where relevant. The information provided in this material
resident in China are responsible for obtaining all relevant approvals is for information purpose only and does not constitute an offer, a
from the Chinese government authorities, including but not limited to solicitation or a recommendation to contract a financial instrument or
the State Administration of Foreign Exchange, before investing. a financial service as defined under FinSA. This material does not
constitute an implicit or explicit investment advice. The information
Hong Kong: This material is provided to Professional Investors, as provided herein is general in nature and does not constitute an
defined in the Hong Kong Securities and Futures Ordinance and the advertisement of financial products in Switzerland pursuant to FinSA
Securities and Futures (Professional Investor) Rules, in Hong Kong and its implementing ordinance.
only. It is not intended for and should not be distributed to, or relied
upon, by members of the public or retail investors. European Economic Area and United Kingdom: The data and
information presented is directed solely at persons who are
Professional Investors in accordance with the Markets in Financial
For Institutional/Investment Professional Use Only. Not for distribution to the public. MSTR.513179 17You can also read