Investment in infrastructure in the EU - BRIEFING - Iberglobal
←
→
Page content transcription
If your browser does not render page correctly, please read the page content below

BRIEFING

 Investment in infrastructure in the EU
              Gaps, challenges, and opportunities
SUMMARY
Public infrastructure consists of the basic physical assets and structures that support economic
activity. Investment in such assets is markedly different from other types of capital expenditure, due
to the heavy involvement of the public sector and the significant positive spill-over that it generates
throughout the economy. Yet the same characteristics that underlie infrastructure investment can
also result in its under-provision over time, due to factors such as fiscal constraints.
In the European Union (EU), following a period of sustained growth, investment in infrastructure has
been declining since 2009. Despite the gradual easing of this negative trend from 2015, investment
rates remain below pre-crisis levels. This has given rise to a lively debate over the emergence of an
investment gap and its implications for the EU's economic recovery and competitiveness. This is
because investment in infrastructure has the potential not only to boost aggregate demand in the
short term, but also to bring important benefits over the longer term by broadening the productive
capacity of the economy as a whole.
Estimates for the EU indicate that plummeting investment is below the levels needed. European
Investment Bank (EIB) estimates suggest that economic infrastructure investment needs for energy,
transport, water and sanitation, and telecoms are as much as €688 billion per year. Additional
estimates for social infrastructure suggest that the investment gap for health, education and social
housing is at €142 billion per year. The mobilisation of resources required is therefore significant. In
due recognition of the emerging needs, the current and previous multiannual financial frameworks
put emphasis on the expansion of programmes and initiatives where infrastructure plays a
prominent role, both directly, as the primary targeted sector, and indirectly through broader
interventions covering a range of sectors.

                                                  In this Briefing
                                                        The issue
                                                        Context and key notions
                                                        Economic rationale for investment in
                                                        infrastructure
                                                        Investment in infrastructure in the EU
                                                        EU programmes and initiatives

                   EPRS | European Parliamentary Research Service
                                   Author: Ioannis Zachariadis
                                   Members' Research Service
                                   PE 628.245 – October 2018                                               EN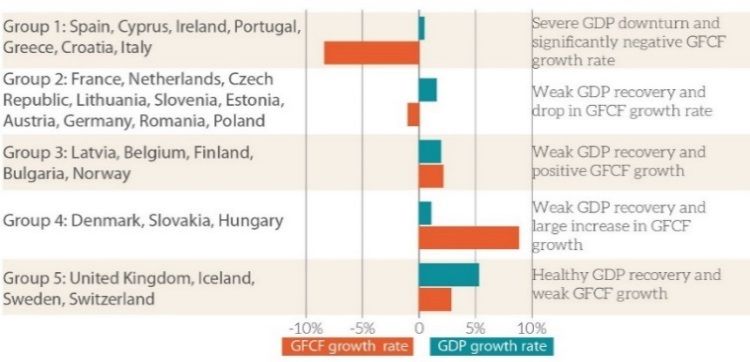
EPRS | European Parliamentary Research Service

The issue
Investment in economic and social infrastructure in the European Union (EU) has been in steady
decline since the outbreak of the economic and financial crisis. Although the negative trend appears
to gradually level off from 2015 onwards, overall investment remains far below pre-crisis levels (see
Figure 1). The extent to which the substantial decline in investment also reflects the emergence of
an alarming gap relative to projected
infrastructure needs has been the subject Figure 1– Infrastructure investment, real terms
of debate over the past decade.             (2008=100)
                                                  105
On one strand of the discussion lies the          100
premise that the observed drop may                 95
                                                   90
reflect the fact that infrastructure has           85
reached saturation point considering               80
that key assets regarding transport,               75
energy and communication are in place
in the EU countries. Technological                          Infrastructure investment in education and health
                                                            Infrastructure investment in utilities, transport and telecoms
change may also be shifting investment
                                                 Data source: Eurostat, Author's own calculations.
from infrastructure to other growth-
enhancing spending.
However, as stressed by the European Investment Bank (EIB), this view fails to explain the significant
fall in government investment in most EU countries. Crucially, it overlooks the fact that public capital
stock depreciates and may indeed depreciate even faster if not properly sustained. Hence there is a
need to spend on maintenance, replace old assets, and complete long overdue connections.
Most importantly, there is need for new and modern infrastructure to keep up with rapid changes
on the technological and demographic fronts. According to the European Commission, the number
of European citizens aged over 65 will rise by more than half by 2030 relative to 2005 levels. This
implies that the pressure on healthcare infrastructure will grow substantially over the next decade.
Equally, the changes brought about by the ongoing new industrial revolution (Industry 4.0) and
digitalisation will both transform and escalate demand for new infrastructure investments. For
example, supply chains and channels for the delivery of products and services to consumers could
evolve considerably through these transformations, and require new infrastructure in the years to
come. In this context, EIB estimates indicate that achieving the targets of the EU digital agenda –
which includes expanding data centre capacity to reach international benchmarks – would demand
additional investment of approximately €55 billion per annum.
In view of the above, research by the European Commission and the EIB suggests that the availability
of adequate and modern infrastructure able to support the rapidly evolving economic landscape
lies at the centre of a robust economic recovery for the EU, as it would promote growth and
competitiveness, link people and businesses and provide sustainable access to resources and
energy, while upholding inclusiveness and equal opportunities for all.

Context and key notions
Public infrastructure denotes the basic physical assets and structures that facilitate economic
activity, through the provision of services to households and enterprises. In economics literature,
there is no strict definition of the term, whilst its scope has expanded considerably over time. Over
two decades ago, the notion used to refer primarily to capital-intensive sectors, such as
telecommunications, transport and power generation. Since then, in the literature, the term has
extended to other less-tangible assets relating to the protection and development of human and
social capital across the economy.
In this context, public infrastructure falls into two main classes: economic and social infrastructure.
Economic infrastructure refers primarily to the fixed physical assets that directly support the

2
Investment in infrastructure in the EU
production process. This includes public utilities, such as electricity and water, transport networks
and communication systems. The assets themselves – and the services supported by them – provide
essential inputs to the production of other goods and services. They therefore play a critical role in
respective supply chains, as well as a wider role connecting producers and consumers and enabling
information and knowledge exchange.
Social infrastructure refers to what may be considered as public necessities such as education,
health and community services. Although not contributing directly to the production process, they
do play a critical role in protecting and developing the health and skills of the workforce. They
therefore improve the human capital endowment of the nation, which in turn, results indirectly in
efficiency and productivity improvements over the longer term. By providing equal access to public
health and education services, social infrastructure contributes to the improvement of social
cohesion and the alleviation of inequalities.
How infrastructure differs from other capital expenditure
Investment in infrastructure is markedly different from other types of capital expenditure. As emphasised
by the International Monetary Fund (IMF), a number of distinct features render such investments subject
to market failures, which can result in their under-provision over time. For example, infrastructure projects
are often characterised by large physical size and increased capital intensity. This makes their provision
by many entities problematic. Additionally, while their costs are significant and front-loaded, the benefits
are not felt until much later in time. This makes private-sector provision difficult due to both financing
and operational issues. Finally, infrastructure investments can generate wider positive spill-over effects.
The existence of such externalities may imply that private returns on an investment project are lower than
the social returns, thus making its provision by a public entity more likely relative to private investors. It is
largely due to these considerations that infrastructure investment is traditionally led by the public sector,
with the private sector entering infrastructure projects primarily through special contractual
arrangements, such as public-private partnerships.
Infrastructure investment is usually thought of in terms of new projects. However, this is to overlook
equally essential capital expenditure relating to maintenance and operations. These are critical,
particularly in the context of aging infrastructure, as they help prolong operational use and slow
down capital depreciation, thereby also reducing risks to human health. Research by the IMF argues
that, despite its critical role, maintenance capital expenditure is usually not given top priority relative
to new infrastructure. It is often one of the first budget items to be cut in periods of fiscal pressure
even though in reality the expenses are simply postponed to a later period.
Economic rationale for investment in infrastructure
Infrastructure investment impacts upon the economy through a range of different channels.
Economic literature differentiates between economic and broader social benefits, as well as
between shorter and longer-term horizons.
Short-term economic impacts relate to the boost that infrastructure investment brings to aggregate
demand. Like other types of government spending, infrastructure expenditure permeates the
economy, triggering demand in a variety of sectors (such as construction material or engineering
services) via the short-term fiscal multiplier. 1 Its overall impact depends on the state of the economy
at the time of the investment. Beyond the structural changes of an economy that affect the size of
fiscal multipliers over time, the type of public financing employed to support the investment can
also be critical in determining its impact. For example, should the investment be financed through
additional debt, then the effect on debt as a share of gross domestic product (GDP) will depend on
the size of the multiplier and elasticity of tax revenues to output. If these are large enough, then
GDP may grow much faster than debt and bring higher tax revenues, thus resulting in a lower net
effect on public finances.
Economic studies emphasise that, over the longer term, investment in infrastructure can also bring
important supply side benefits to the economy. As the capital stock of infrastructure expands, it can
3EPRS | European Parliamentary Research Service raise the productivity of all factors of production, thereby broadening the productive capacity of the economy as a whole. For example, larger and better public transport networks reduce transportation costs for business and cut-down on commuting times for the general public. This not only results in improved labour productivity, but can also generate benefits resulting from economies of scale. Similarly, investments in telecommunications infrastructure can improve access to information and technology, for both citizens and business, which, in turn, broadens markets, promotes competition and enables technological innovation to flourish. World Bank research has stressed that such longer-term benefits can increase significantly when there is strong complementarity with other factors of production. For example, investments in network infrastructure, such as electricity or telecommunications, improve access to corresponding services and lower costs for entrepreneurs, which is conducive to the growth of private investment. Public infrastructure investments may therefore enhance the productivity of private investment, thus having a crowding-in effect. In a recent study, the Commission also emphasises other wider benefits, namely that infrastructure has the potential to induce other investments by sending signals to key sectors in the economy. Importantly, the efficiency of the investment is central in the realisation of the aforementioned benefits. If there are inefficiencies in the investment process, such as poor selection of projects with a low benefit-to-cost ratio, then the long-term gains for the economy can be limited. Clearly identified infrastructure needs and efficient public investment procedures have been identified by the IMF as critical in improving the efficiency of infrastructure investment. On the social benefits front, the economics literature emphasises the central role of public infrastructure in generating broad welfare gains. This is achieved by improving access to markets and critical social services and lowering regional and income disparities, thereby supporting economically disadvantaged groups. According to a recent Council of Europe Development Bank (CEB) report, infrastructure services generally account for about a third to a half of households' final consumption. This suggests that more and better infrastructure that lowers pressure on household budgets can result in notable monetary benefits for citizens, especially those with lower incomes. Beyond the direct monetary benefits of economic infrastructure, social public infrastructure can serve to enhance human capital development. A recent joint report by the EIB and the World Economic Forum (WEF) argues that infrastructure has the potential to address both competitiveness and inclusiveness issues at the same time. For example, health-related public infrastructure simultaneously improves personal well-being and labour productivity by helping to maintain the health of the population. The non-exclusive nature of the services provided by new hospitals or water sanitation facilities helps to alleviate socioeconomic disparities. Equally, education-related infrastructure allows for the growth of human capital across society, which again results in improved productivity of labour and is linked to the reduction of socioeconomic inequalities. Investment in infrastructure in the EU Recent trends Over the past decade, investment in infrastructure in the EU has been broadly pro-cyclical, following the course of overall economic activity. EIB estimates indicate that, after a period of sustained growth, investment in infrastructure started to decline sharply from 2009 onwards. The contraction was driven mostly by the deep drop in public infrastructure expenditure. The chief underlying reason behind this drop was the general shift in public spending from gross fixed capital formation towards current expenditure throughout the crisis, but especially so after outbreak of the sovereign debt crisis of 2011-2012 and the cyclical fiscal consolidation adopted in many countries. Private infrastructure investment also dropped, but at a more stable rate, recovering in recent years. According to the EIB, this declining trend appears to have levelled off in 2015 and most probably also in 2016, based on provisional data (see Figure 2). 2 This has been driven largely by an 4
Investment in infrastructure in the EU

improvement in private investment with
public investments following at a slower        Figure 2 – Infrastructure investment by sector
pace. Despite the return to stability,          (% of GDP)
investment rates remain well below pre-         2,5%
crisis levels. These are estimated as the       2,0%
percentage of infrastructure investment         1,5%
– i.e. gross fixed capital formation (GFCF) 3   1,0%
                                                0,5%
– in GDP. In 2015, investment rates were
                                                0,0%
about 20 % below pre-financial crisis
rates, dropping from a peak of 2.2 % in
2009 to 1.8 % in 2015.                             Health   Education    Utilities   Communication   Transport

On the sectoral front, data for the EU * provisional data
                                              Source: EIB, Investment Report 2017/2018: From Recovery
suggest that the largest decline in
                                              to Sustainable Growth, November 2017.
infrastructure investment between 2009
and 2015 was experienced in the transport sector at approximately 0.2 % of GDP. To put this figure
in context, in 2015 transport accounted for 26 % of total investment in infrastructure down from
31 % in 2007. 4 Utilities and education also experienced considerable contraction in investment at
0.18 % and 1.15 % of GDP respectively, while other sectors exhibited greater stability.
The general decline in infrastructure investment has not been uniform across Europe. Owing to
divergent initial conditions in the stock and quality of infrastructure, as well as the fundamentally
different macroeconomic factors at play, the experience between European states has been
heterogeneous. For example, research indicates that the reduction in infrastructure investment has
generally been more marked in countries that began with low infrastructure quality. This has further
exacerbated difficulties in promoting the convergence of infrastructure quality. CEB analysis further
highlights how macroeconomic conditions underlie countries' divergent experience in
infrastructure investment in recent years. Their analysis clusters this experience into five main
groups over the period between
2009 and 2015 (see Figure 3). The first     Figure 3 – Clustering of European states by GDP
group consists of countries severely        and infrastructure investment growth rates
hit by the economic downturn, such          (average 2009-2015)
as Greece, Spain, Italy and Portugal,
with GDP growth averaging only
0.44 % between 2009 and 2015 and
GFCF declining by an average
of -8.35 % per annum. Fiscal
consolidation had a negative impact
on public investment spending, while
weak economic recovery further
slowed        down        infrastructure
investment. Countries in the second
and largest group, which includes the
                                            Source: Council of Europe Development Bank, Investing in
Czech Republic, Germany, France,            Public Infrastructure in Europe, February, 2017.
and the Netherlands, experienced
better economic recovery. Yet, they
have still collectively exhibited declining public GFCF growth rates since 2009. The third and fourth
groups share the characteristic of weak GDP recovery between 1.06 % and 1.91 % per annum, with
positive growth in GFCF – the latter to varying degrees. For example, Belgium, Bulgaria, Latvia,
Norway and Finland experienced weaker GFCF rates at 2.13 %, whereas Denmark, Hungary and
Slovakia exhibited much stronger investment growth at 8.82 % on average. The final group includes
countries with sound GDP recoveries at 5.29 % per annum, with positive albeit weaker GDFC growth
at round 2.83 %. EU Member States in this group are Sweden and the United Kingdom.

                                                                                                                 5
EPRS | European Parliamentary Research Service Investment needs versus actual spending Investment in infrastructure today stands at its lowest level in a decade. Research suggests that this drop is evident not only in the EU, but also globally, which in turn has given rise to a lively debate over the potential gap that has been generated between actual infrastructure expenditure and potential infrastructure investment needs. 5 Data constraints make any attempt to identify what and how much investment is missing very complicated. This is especially because estimates of potential needs are highly sensitive to the methodological approaches adopted. For example, studies tend to make different assumptions regarding location and time and, more importantly, future trends including demographic, technological and climate changes. Research estimates global infrastructure investment needs at around 3.9 % to 9.7 % of world GDP. This figure is driven mainly by the very high needs for new capital investments still present in developing countries. In Organisation for Economic Co-operation and Development (OECD) countries, according to a 2006 estimate, total cumulative infrastructure requirements in road, telecoms, electricity and water will reach about US$53 trillion by 2030. 6 In the EU, according to estimates drawn up by the Commission in 2011, the completion of the TEN-T network in transport alone would require about €550 billion by 2020. Additional Commission estimates indicate that in the field of energy alone about €200 billion will be required up to 2020 to develop cross border interconnections between Member States. A more recent attempt by the EIB in 2016 estimated the EU's total investment needs in economic infrastructure at €688 billion per year until 2020. Energy, at €230 billion, accounts for the bulk of this. With current annual expenditures in energy infrastructure estimated at €130 billion, this implies a gap of €100 billion. For transport and logistics, investment needs are estimated by the same study at €160 billion per annum. Furthermore, current annual expenditure in transport and logistics stands at €80 billion, while another €80 billion is needed to close the investment gap. For water and sanitation, and telecoms, needs reach €160 billion and €138 billion respectively. On the social front, a recent report by the High-Level Task Force on Investing in Social Infrastructure in Europe indicates that the investment gap for education and lifelong learning, health and long-term care, and affordable housing in the EU amounts to €142 billion per annum. These estimates indicate that bridging the gap between actual spending and estimated needs will be costly. Dealing with the backlog to boost competitiveness through the improvement of infrastructure stock in the long term will require significant mobilisation of resources. A sub-national view: the role of local and regional authorities Traditionally, the provision of public infrastructure has tended to be centralised. However, one of the key characteristics of many public services that are supported by public infrastructure is that their delivery and consumption takes place at local level. Various tiers of government (central, state and local) can be involved. This observation is all the more significant considering the importance of infrastructure in promoting regional development. According to the OECD, it contributes to the growth of cities and is fundamental to the development of economic and regional clusters. EIB research also underlines that infrastructure investment, even when localised, tends to generate externalities, whose reach goes beyond the local economy, while also affecting the geographical distribution of economic activities. Many EU countries are increasingly recognising that the decentralisation of public infrastructure investment decisions can be critical in improving viability and effectiveness in the provision of key services related to public infrastructure. Developments on this front have been mixed across EU, largely reflecting differences in public governance systems, as well as alternative views between countries on the scope of the competences that should be rendered to local authorities. A 2017 EIB survey indicates that municipalities across the EU fared slightly better in infrastructure investment during the crisis than the aggregate EU declining trend. This does not mean that they 6
Investment in infrastructure in the EU

were unaffected, however, as one in three municipalities indicated that investment activities since
2012 had been consistently below actual needs. Of those that reported infrastructure gaps, around
75 % indicated that a major obstacle in addressing these were fiscal constraints (budget and/or debt
ceilings). Beyond this, regulatory and political instability were also identified as major obstacles, with
the first mentioned by close to 50 % of the municipalities surveyed. While the loosening of national
fiscal constraints is perceived by the municipalities surveyed to be important, effective planning,
prioritisation based on cost and benefit, and execution will play a central role in reviving
infrastructure investment. The EIB survey revealed that while 80 % of municipalities have an urban
development strategy, roughly one in four do not consult their strategy when planning for new
projects, while less than half assess quality prior to implementation.

EU programmes and initiatives
In recognition of the growing investment gap in the EU, the current and previous multiannual
financial frameworks provided for the expansion of programmes and initiatives, and the
development of new financial instruments for their implementation. Infrastructure investment is
addressed directly or indirectly by the majority of these funding and support initiatives.
The five European structural and investment funds – jointly managed by the Commission and the
EU countries – address infrastructure through a range of channels. Under the European Regional
Development Fund (ERDF), infrastructure investment has a more horizontal character, broadly
entering the various fund's thematic areas including the digital agenda, innovation and research
and the low-carbon economy. The Cohesion Fund (CF) has more direct relevance as it funds
transport and environment projects – under its €63.4 billion envelope – in specific countries, 7
focusing on trans-European transport networks, rail and public transport and projects supporting
energy efficiency and use of renewable energy. Other funds, such as the European Agricultural Fund
for Rural Development (EAFRD) and the European Maritime and Fisheries Fund (EMFF) are still
relevant, albeit more specific in character given their sectoral concentration. Finally, the European
Social Fund (ESF) could be argued to hold a more indirect role in relation to infrastructure as it
complements social infrastructure by investing in Europe's human capital.
Complementary to the above are grant financing and other actions under specific policy areas. The
most crucial of these in relation to infrastructure investment are the Connecting Europe Facility
(CEF) and the Digital Europe Programme. The CEF is designed to promote and part-finance the
construction of pivotal cross-border transport, energy and telecommunications infrastructure links
between EU Member States. The Commission has proposed the extension of the CEF as part of the
2021 to 2027 EU budget, with a total of €42.3 billion, in current prices, of which 72 % would be
allocated to transport, 21 % to energy and 7 % to digital (high-capacity broadband networks).
Infrastructure investment has also benefited significantly from the European Fund for Strategic
Investments (EFSI) 1.0 and 2.0, which has been providing EU investment guarantees in cooperation
with the EIB. Around 48 % of the total €335 billion of investments mobilised under EFSI relate to
economic and social infrastructure. This substantial support will continue under the InvestEU
Programme proposed by the Commission for 2021 to 2027. InvestEU will build on the success of
EFSI and bring together under one roof various EU financial instruments, including the
Competitiveness of Enterprises and Small and Medium-sized Enterprises (COSME) programme, as
well as specific guarantees and facilities under the Employment and Social Innovation (EaSI)
programme and InnovFin. The aim is to capitalise on economies of scale and mobilise public and
private investment through an EU budget guarantee of €38 billion to back the investment projects
of financial partners such as the EIB and others, thereby extending their risk-bearing capacity.
MAIN REFERENCES
Abiad A., Almansour A., Furceri D., Mulas Granados C., and Topalova P, Is it time for an infrastructure push?
The macroeconomic effects of public investment, IMF, October 2014.

                                                                                                           7
EPRS | European Parliamentary Research Service
Council of Europe Development Bank, Investing in public infrastructure in Europe: A local economy
perspective, February 2017.
European Commission, Infrastructure in the EU: Developments and impact on growth, European
Economy, Occasional Papers 203, December 2014.
European Energy Security Strategy, COM (2014)330, European Commission, May 2014.
European Commission, White paper on transport. Roadmap to a Single European Transport Area -
Towards a competitive and resource efficient transport system, March 2011.
EIB, Investment Report 2017/2018: From Recovery to Sustainable Growth, November 2017.
EIB, Restoring EU competitiveness, January 2016.
Szczepański, M., Public investment to support long term economic growth in the EU, EPRS, European
Parliament, July 2016.
ENDNOTES
1
Fiscal multipliers measure how much additional income is generated from government spending. Studies that have
measured the impact of public investment argue that it has a rather high fiscal multiplier, ranging between 1.3 and 1.8.
This means that €1 of general government expenditure in public investment increases gross domestic product (GDP) by
an average of 30 to 80 cents –see also M. Szczepański, Public investment to support long-term economic growth in the
EU, EPRS, European Parliament, July 2016.
2
EIB preliminary estimates for 2016 based on information only for Bulgaria, Germany, Estonia, Ireland, France, Austria,
Slovakia, Slovenia, Finland, suggest negative growth rates become stabilised.
3
Infrastructure is not a single economic activity and, as such, is not classified separately in national accounts. Data on
infrastructure investment are commonly examined separately by different studies. The most common approach is to
employ gross fixed capital formation (GFCF, i.e. investment) in the activity sectors that reflect economic and social
infrastructure, namely transport, energy and water supply, communications, education and health. Recent Eurostat
offerings provide a detailed breakdown of fixed capital by type, which has allowed studies to focus on strict
infrastructure elements alone, namely buildings and other structures. These refinements have helped generate more
realistic estimates in recent years, which in turn can feed better into ongoing policy discussions – see Wagenvoort et al.
(2010) and Revoltella et al. (2016).
4
This estimate is drawn from Revoltella et al. (op. cit.), who base their calculations on total fixed GFCF. Estimates may differ
in later studies, which focus on buildings and other structures.
5
See e.g. Bhattacharya A. et al. (2016), Delivering on sustainable infrastructure for better development and better climate,
Brookings Institution, December 2016.
6
For electricity this estimate includes transmission and distribution only. If electricity generation is included the figure
rises to US$71 trillion.
7
For the 2014-2020 period, the Cohesion Fund concerns Bulgaria, the Czech Republic, Estonia, Greece, Croatia, Cyprus,
Latvia, Lithuania, Hungary, Malta, Poland, Portugal, Romania, Slovenia, and Slovakia.
DISCLAIMER AND COPYRIGHT
This document is prepared for, and addressed to, the Members and staff of the European Parliament as
background material to assist them in their parliamentary work. The content of the document is the sole
responsibility of its author(s) and any opinions expressed herein should not be taken to represent an official
position of the Parliament.
Reproduction and translation for non-commercial purposes are authorised, provided the source is
acknowledged and the European Parliament is given prior notice and sent a copy.
© European Union, 2018.
Photo credits: © metamorworks / Fotolia.
eprs@ep.europa.eu (contact)
www.eprs.ep.parl.union.eu (intranet)
www.europarl.europa.eu/thinktank (internet)
http://epthinktank.eu (blog)
8You can also read