Regional inequalities in the EU - Europa EU
←
→
Page content transcription
If your browser does not render page correctly, please read the page content below

BRIEFING

           Regional inequalities in the EU
SUMMARY
The issue of inequality has gained increasing importance in the public and political agenda in the
aftermath of the financial and economic crisis, and in the context of political movements
representing the 'places left behind'. Inequality may relate to income and wealth, but also to a
variety of aspects such as access to basic services, education and infrastructure. In the context of
regional disparities, it may also refer to differing levels of socio-economic development.
Common inequality measures have revealed that, while regional disparities have been decreasing
when considering the EU as a whole, they have been increasing within some countries. A number
of persistently low-growth regions exist in southern Europe, as do many low-income regions in
eastern Europe. Every Member State has a number of 'inner peripheries', which are habitually
located in post-industrial or rural areas and often characterised by high levels of unemployment,
poor infrastructure, lack of skilled workforce and hampered accessibility.
Strengthening social, economic and territorial cohesion, and reducing regional disparities is the
main goal of EU cohesion policy. As a major EU tool to address regional inequalities, this policy
provides a wide range of support for businesses and activities in areas such as research,
environment, transport, employment, social inclusion, education and institutional capacity-
building. Such support is crucial for addressing the underlying problems of many lagging regions,
helping them create better living conditions, retain and attract talent, encourage investment,
improve productivity and develop regional innovation systems. Together with economic
governance frameworks and EU support for structural reform, EU cohesion policy can play an
important role in reducing inequality, in a comprehensive and multidimensional way.
While traditionally, GDP per capita has been used to assess regional convergence, a variety of new
indicators tracking progress on issues correlated with inequality are available for this purpose today.
Moreover, the proposals for the EU's post-2020 policy framework include new additional funding
allocation criteria such as youth unemployment, education levels, climate change, and the reception
and integration of migrants. These changes possibly indicate a shift towards a more comprehensive
view of territorial convergence in the EU.

                                                 In this Briefing
                                                     Introduction
                                                     Measuring inequality and convergence
                                                         Common measures of income inequality
                                                         Regional convergence
                                                         Multidimensional approach to inequality
                                                     Policy response
                                                     Outlook

                   EPRS | European Parliamentary Research Service
                                   Author: Agnieszka Widuto
                                   Members' Research Service
                                    PE 637.951 – May 2019                                                 EN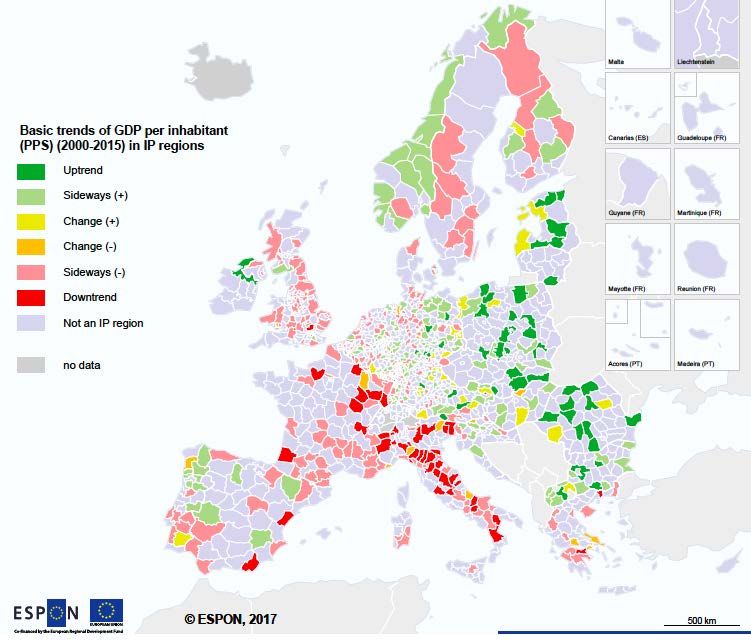
EPRS | European Parliamentary Research Service

Introduction
In its Article 174, the Treaty on the Functioning of the European Union (TFEU) states that the EU's
goals include 'strengthening of its economic, social and territorial cohesion' and 'reducing
disparities between the levels of development of the various regions and the backwardness of the
least favoured regions'. The social scoreboard, which monitors the implementation of the European
Pillar of Social Rights, adopted in 2017, includes income inequality 1 alongside several other
indicators closely related to providing more equal chances. This corresponds to one of the key
concepts behind the pillar: the achievement of equal opportunities for all.
According to a 2015 European Commission study, inequality has been on the rise in many Member
States in the past three decades, and was further exacerbated by the 2008 economic crisis. In some
countries, income inequality is not particularly high, but wealth inequality has been on the rise. The
issue of inequality has also gained importance in the public debate, fostered by well-publicised
economic research literature by economists such as Tony Atkinson and Thomas Piketty. 2 Overall,
increasing inequalities are believed to have a negative impact on economic growth, and to
undermine social peace and political stability.
Inequality can be defined in various ways. The traditional view focuses on 'inequality of outcomes',
usually referring to the distribution of income and wealth in society. This type of inequality is
believed to result from a combination of factors beyond one's control (such as family background,
ethnicity or gender), as well as effort. A more rights-based approach proposes the concept of
'inequality of opportunity', aiming to ensure an equal starting point for all (such as access to
education and healthcare). Policy response may thus depend on the approach taken. About a third
of the 2014-2020 EU budget is dedicated to implementing the EU cohesion policy, whose primary
aim is to reduce regional disparities and strengthen social, economic and territorial cohesion.
Funding earmarked for cohesion provides various kinds of support, including to businesses,
transport infrastructure and skills development, in order to address several underlying drivers of
regional inequalities.

Measuring inequality and convergence
Common measures of income inequality
Income inequality can be measured in a variety of ways. The most common indicators of income
inequality used in the EU context are the S80/S20 ratio and the Gini co-efficient (see Box). The
S80/S20 ratio is the indicator used for measuring inequality in the social scoreboard accompanying
the European Pillar of Social Rights. This measure compares the income of the richest 20 % of
households to the income of the poorest 20 % of households. For instance, an S80/S20 of 5.0 means
that the richest 20 % of households receive five times
as much income in a year as the poorest 20 %. A Income quintile share ratio (S80/S20)
higher S80/S20 ratio implies more income
inequality, while a lower number implies less. An The income quintile share ratio or the S80/S20 ratio is
S80/S20 ratio of 1 means perfect equality of income a measure of the inequality of income distribution. It is
(all households having the same annual income). On calculated as the ratio of total income received by the
                                                       20 % of the population with the highest income (the
the other hand, an S80/S20 ratio of 10 means perfect
                                                       top quintile) to that received by the 20 % of the
inequality (one person having all the income).         population with the lowest income (the bottom
The latest available EU-28 data (for 2016) shows that    quintile). All incomes are compiled as 'equivalised
the top 20 % of the population received 5.2 times as     disposable income' (i.e. the total income of a
much income as the bottom 20 %. There were               household after tax and other deductions, that is
                                                         available for spending or saving, divided by the
considerable variations across countries, ranging
                                                         number of household members converted into
from 3.5 in the Czech Republic and 3.6 in Slovenia,      equalised adults).
Slovakia and Finland, to over 6.0 in Latvia, Italy,
Spain, Greece, and more than 7.0 in Lithuania and        Source: Eurostat glossary, 2019.

2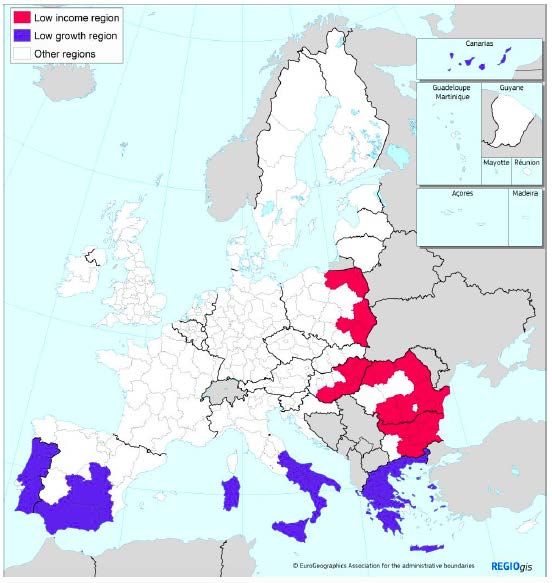
Regional inequalities in the EU

Romania, with the highest inequality ratio of 7.9 in Bulgaria. Overall, there was a rise in inequality in
many, but not all Member States. Income inequality has increased the most in Portugal, Greece and
Bulgaria; in many Member States it has hardly changed (Hungary and France); and in some it has
fallen (Ireland, Luxembourg, Italy).
The Gini coefficient is the most common measure
of income inequality used internationally. It Gini coefficient
compares each household's income position to The Gini coefficient (sometimes called Gini index)
that of all other households in order to measure measures the extent to which the distribution of
income distribution. For the EU-28, the Gini income within a country deviates from a perfectly
coefficient was around 30.7 % in 2017. The highest equal distribution. A coefficient of 0 expresses perfect
income disparities of at least 35.0 % were recorded equality where everyone has the same income, while a
in Bulgaria and Lithuania. A group of countries – coefficient of 1 expresses full inequality where only one
Estonia, Italy, Romania, the United Kingdom, person has all the income. It can also be presented as a
                                                    percentage with values ranging from 0 to 100.
Greece, Portugal, Spain and Latvia – had a Gini
coefficient above the EU-28 average (31.0 % – Source: Eurostat glossary, 2019.
34.5 %). On the other end of the spectrum were
countries with a more even income distribution (26.0 % or less): Slovakia, Slovenia, the Czech
Republic, Finland and Belgium.
Overall for the EU-28, the Gini value has registered a slight decrease since its peak in 2014 and 2015
at 31 %. However, differences between the Member States still persist. Both measures (the S80/S20
and Gini) show a similar picture of inequalities between countries. It is important to point out that,
while common drivers of inequality exist in all Member States (for instance, unemployment and
technological progress rewarding high-level skills), the specific national and regional contexts may
vary. Moreover, the distribution of income tends to be more equitable among the older generations
(65+ group) across the EU, which may be attributed to changes in tax and social transfers systems.
Other common statistics associated with income inequality and income distribution include the
median equivalised net income; the income share of the bottom 40 % of the population; and the
relative median at-risk-of-poverty gap. 3 These are measured by Eurostat and monitored under the
EU statistics on income and living conditions (EU-SILC), as well as under initiatives such as the
European Commission's annual 'Employment and Social Developments in Europe' review and UN
Social Development Goal 10 (reduced inequalities) in the EU context. Techniques for measuring
income inequality at regional level are currently being developed.

Regional convergence
While EU cohesion policy aims to promote a comprehensive approach – i.e. social, economic and
territorial cohesion – the measurement of the reduction in regional disparities has mainly been
based on the convergence of regional levels of GDP per capita relative to the EU average.
In 2016, 101 out of the 276 NUTS2 regions 4 recorded a level of GDP per capita above the EU-28
average. These regions were largely found in an area stretching from northern Italy to Austria and
Germany, which then split off in two sections: the first covering several regions in the Benelux
countries, southern England and southern Ireland, and the second covering the Nordic Member
States (see Map 1). 5 A prominent trend is the concentration of pockets of relatively high wealth
creation in almost every capital city region. Particularly high ratios were recorded in Inner London –
West with a GDP per capita six times as high as the EU-28 average (i.e. 611 %), Luxembourg (258 %
of EU average), the Irish capital city region (217 % of EU average) and the Belgian capital city region
(200 % of EU average). One should keep in mind, however, that these statistics refer to a fairly large
area, while a higher level of detail might demonstrate internal disparities within the region. In the
context of EU-wide convergence, it is also interesting to note that in 2016 the majority of Spanish,
French, UK and southern Italian regions had levels of GDP per capita lower than the EU-28 average.
Such regions (sometimes described as 'left behind') are usually either sparsely populated, rural and
characterised by net emigration, or post-industrial.

                                                                                                        3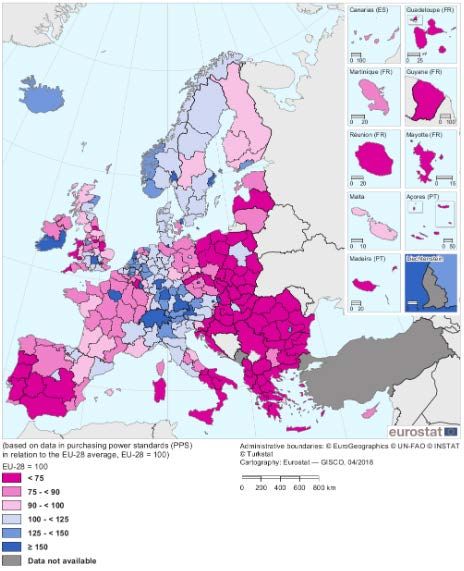
EPRS | European Parliamentary Research Service

In the 2007-2016 period, which also witnessed Europe's financial and economic crisis, GDP per capita
increased in 117 NUTS2 regions, while 157 regions experienced a decline. GDP per capita grew at a
faster pace than the EU-28 average in many 'new' Member States (Bulgaria, Hungary, Poland,
Romania, Slovakia, Lithuania, Latvia, Estonia and the Czech Republic). Many regions in Germany and
Austria also experienced a fast growth. By contrast, GDP per capita grew slower than the EU-28
average in Greece, Spain, Croatia, Italy, the Netherlands, Slovenia, Finland and Sweden, France and
Portugal. These trends lead to a diminishing East-West divide.
A 2009 European Commission study explored two
main processes of convergence among regions in Map 1 – GDP per inhabitant (PPS) relative to
the EU. The first one, Beta-convergence, refers to a EU average, 2016
process where poor regions grow faster than rich
ones and therefore catch up with them. The study
found that a Beta-convergence process was taking
place among EU regions, at both EU-15 and EU-27
level; however, the speed of convergence was not
constant over time. Moreover, convergence was
sometimes higher within some groups of regions
compared to others (such as core and periphery
regions), and often lower between these groups.
While Beta-convergence focuses on the catching-
up processes (for instance, towards the EU average),
the second process, Sigma-convergence, refers to a
reduction of disparities among regions in time. The
authors suggest that the concept of Sigma-
convergence is more revealing in terms of
describing the distribution of income across
economies, and recommend relying on several
methods for this purpose (rather than on just one
summary measure such as the Gini coefficient). This
allows to track individual movements within the
distribution of regional GDP per capita in order to
detect the mechanisms in the convergence process. Source: Eurostat, 2019.
Using a variety of measures, the authors arrived at
the conclusion that, while regional disparities are declining in the EU as a whole, more detailed data
show that this decline can be attributed to upward movements in the lower end of the distribution,
with a simultaneous increase in disparities within a number of Member States.

Multidimensional approach to inequality
There is an increasing consensus in the global community that measuring inequality in a one-
dimensional economic way must be complemented by other measures, in line with the concept of
inequality of opportunity. This is supported by the fact that inequality is correlated with a variety of
underlying factors.
However, inequality of opportunity is difficult to measure with the use of standard indicators. Proxy
indicators are thus needed to assess progress. The choice of such indicators will predominantly
depend on what are seen as drivers of inequality. Low educational performance and high poverty
levels are believed to be highly correlated with inequality, which suggests that these areas should
be carefully monitored and targeted via policy measures. Regional inequalities can also be
attributed to a wide range of factors, including changes caused by globalisation (e.g. relocation and
outsourcing of manufacturing and service activities), the legacy of former economic systems,
geographic remoteness, and the availability of human, natural and capital resources. Many of these

4
Regional inequalities in the EU

factors translate into social deprivation, poor-quality housing, healthcare or education, higher levels
of unemployment, or inadequate infrastructure.
Measuring reduction in disparities with the help of the GDP per capita measure presents only a
partial picture. If the goal is to gain a comprehensive overview of progress made by EU regions, then
complementary measures could be useful. Moreover, analysing income inequality requires the
development of regional data at NUTS2 level. Currently, a variety of indexes measuring other areas
related to inequality exist at regional level. The EU regional Social Progress Index tracks a number of
crucial indicators related to healthcare, access to knowledge and personal rights, etc., in all EU
NUTS2 regions. The Regional Competitiveness Index tracks progress with regard to infrastructure,
technology, innovation and macroeconomic stability, among others. The EU Quality of Government
Index focuses on corruption, impartiality and quality of public service delivery. These indexes,
published at regular intervals, allow to assess progress made on a number of variables both over
time and in comparison to other regions. 6
It is also important to note in this context that EU cohesion policy – the main investment tool to
redress regional disparities – is often assessed on the basis of the narrowly understood concept of
convergence (measured by GDP per capita). However, given the diversity of programmes
implemented as part of the cohesion policy, there is possibly a scope for looking at convergence
and inequality as facets of a multidimensional phenomenon. A step in this direction has been made
in the European Commission proposals on the 2021-2027 multiannual financial framework, where
GDP remains the leading criterion for cohesion policy allocations, but is complemented with
additional criteria, such as youth unemployment, low education levels, climate change, and the
reception and integration of migrants.

Policy response
The 'Lagging regions report', published by the European Commission in 2017, identified two types
of lagging regions in the EU, whose level of development is significantly lower than the EU average
(see Map 1 above). The first type are low-growth regions (mainly located in the southern EU Member
States), which experience a persistent lack of growth. These regions have a GDP per capita of up to
90 % of the EU average and did not converge to the EU average between 2000 and 2013. The second
type, the low-income regions (mainly located in the eastern EU Member States), are the ones
remaining far below the EU average GDP per capita. They include all regions with a GDP per capita
below 50 % of the EU average in 2013. An estimated 83 million people (one in six EU residents) live
in these two types regions.
The report identifies a variety of factors that need to be addressed in order to accelerate the
catching-up process. While there is no one-size-fits-all solution, investment needs usually include
human capital, innovation, high-quality institutions and better accessibility. Macroeconomic
imbalances caused by the crisis undermined the convergence process and wiped out many of the
earlier economic advances. Low-growth regions suffered a combination of stagnating productivity,
rising labour costs and high debt levels, which reduced their export share and investment capacities.
In general, lagging regions struggle with low productivity, educational attainment and employment
rates compared to other regions in their country. The business environment can also vary within the
same common national framework, depending on the efficiency of local and regional
administrations. Low-income regions have significant basic gaps in their infrastructure, while low-
growth ones often struggle with accessibility. In both types of regions, the innovation systems are
underdeveloped and skills gaps undermine competitiveness. This is combined with significant
population losses, especially in low-income regions, caused by the out-migration of the younger
and more educated members of the population. Low-growth regions, on the other hand, experience
a considerable fall in public and private investment.

                                                                                                       5
EPRS | European Parliamentary Research Service
To overcome these challenges, the report proposes to make use of the smart specialisation
strategies; these would enhance the regional innovation systems by improving interactions among
businesses and between businesses and higher education institutions. Furthermore, the report
proposes ways to invest in human capital, for instance by means of ushering university graduates
into the labour market, matching educational supply and labour demand, and encouraging lifelong
learning. This should be accompanied by making infrastructure improvements – for instance,
creating better road networks and linking
Map 2 – Low-growth and low-income regions cities with the surrounding areas – to
stimulate spill-over effects from successful
cities that function as economic engines.
Moreover, the report argues that
strengthening institutional capacity and
improving the efficiency of public
administrations can help increase the
transparency and accountability of public
services, promote e-government, reduce
regulatory burdens, modernise public
procurement, support anti-corruption
measures and support judicial reform. Lastly,
the report proposes to strengthen the link
between the European Semester and EU
cohesion policy. The positive impact of
cohesion policy on small and medium-sized
enterprises, skills, transport, social
infrastructure, energy efficiency and the
environment can be combined with
supporting favourable macroeconomic and
structural conditions via the EU economic
Source: European Commission, 2019.
governance frameworks.
A 2018 study by the European Observation Network for Territorial Development and Cohesion
(ESPON) explores the concept of 'inner peripherality' and stresses that 'inner peripheries' are present
in almost all European countries. Their general performance, levels of development, access to
services of general interest, and quality of life of the population are relatively worse than those of
their neighbouring territories. Such inner peripheral areas can include enclaves of low economic
potential, areas with poor access to services of general interest, and areas experiencing a lack of
relational proximity. A combination of these factors is also possible. Inner peripheries seem to share
a perception of 'being forgotten' in the national political agenda. The study proposes to overcome
their marginalising effects by establishing cooperation and connectedness across boundaries, and
making greater use of national and EU programmes.
A core aspect identified in the context of inner peripherality is the 'capacity of a territory to connect
with its environment'. In addition to geography, such connectedness can be 'relational' and include
interactions between local actors, the level of insertion in relevant networks, and the capacity of
local institutions, organisations and companies to establish links with other entities in neighbouring
territories and beyond. A well-connected territory helps create better conditions of access to
services of general interest (SGI) and a more dynamic labour market, capable of retaining a skilled
population. This in turn generates opportunities to establish new connections, generating virtuous
circles favouring better-connected territories. In contrast, highly 'disconnected' areas tend to
reproduce that situation over a longer time.
The study identifies border regions (not only national but also regional) as having a greater
incidence of being inner peripheral. Moreover, 80 % of the inner peripheries with low economic
potential or poor accessibility are located in non-urban regions. Half of the inner peripheries with
6Regional inequalities in the EU
poor accessibility lie in mountainous regions. Areas lacking relational proximity are often located in
urban (32.2 %) and metropolitan areas (43 %). Some of their challenges include demographics, that
is, decreasing population, increasing old-age dependency and ageing, lower ratios of children and
people of working age, but also out-migration of young and skilled members of the population.
Inner peripheries also often coincide with regions that are lagging, especially from a national
perspective.
The study recommends addressing the connectivity gaps by shortening the travel time to centres
of economic activity, reducing travel costs and improving transport connections. It also suggests
strengthening the interaction among local players (for instance, via community-led local
development strategies) and improving intra-regional service delivery and access, possibly based
on innovative IT solutions and investment in digital infrastructure. Moreover, it recommends
investing in education, skill development and business support services. The potential of cohesion
policy funding combined with funding under other programmes is underlined in this context as a
powerful tool to overcome the peripheralisation processes.
In addition, a 2018 European
Map 3 – Inner peripheries (GDP per capita trends, Investment Bank (EIB) paper on
2000- 2015) 'Inequality in Europe' highlights the
quality of policies and reforms in
helping reduce inequality and
increase inclusiveness. It
recommends applying a mix of
policies in areas such as economic
governance, labour market,
education and skills, competition
and product market regulation,
innovation and entrepreneurship,
financial markets, infrastructure and
public services, development and
urban governance. The role of fiscal
policies and welfare systems is also
highlighted in this context; however,
it is important to keep in mind that
taxation and specific social security
arrangements fall within the
competence of the Member States.
The EIB sees the main role of EU
funding as one that addresses three
Source: ESPON, 2017. dimensions of inequality:
geography, education and health.
Equality of opportunity can thus be stimulated by supporting investment in availability and quality
of basic services (such as education and health), helping to create favourable business conditions,
as well as improving public services provision and infrastructure in the less developed territories.
Outlook
The picture of regional inequalities in the EU is complex. While aggregate disparities between the
Member States are decreasing, there seems to be a growing spatial disconnect, with some regions
growing dynamically and others stagnating or falling behind. Cohesion policy, alongside economic
governance mechanisms, can be used to counteract these phenomena.
GDP per capita is currently the main measure used to assess convergence, as it is believed to provide
a good proxy for the standard of living. In order to fully assess the picture of inequalities, other
complementary indicators are increasingly becoming available; these allow the monitoring of
7EPRS | European Parliamentary Research Service
various aspects that may impact inequalities (such as access to education, healthcare and
infrastructure). In its proposals for the 2021-2027 multiannual financial framework, the European
Commission has maintained GDP per capita as the main measure for cohesion policy allocations.
However, it has also added several new criteria, including youth unemployment, low education
levels, climate change, and the reception and integration of migrants. While this may indicate a shift
towards a more comprehensive view of territorial convergence and the adoption of an opportunity-
oriented perspective, the final shape of the new regulations remains to be seen in the course of the
ongoing negotiations on the post-2020 cohesion policy framework.
MAIN REFERENCES
Competitiveness in low-income and low-growth regions – The lagging regions report, European
Commission, October 2017.
The EU-wide income distribution: inequality levels and decompositions, European Commission,
May 2018.
Mind the Gap. European Research for Combating Inequalities, European Commission, 2015.
Convergence of EU regions – Measures and evolution, European Commission, Working Papers, No 1,
January 2008.
Inequality in Europe, European Investment Bank, January 2018.
Inner peripheries in Europe – Possible development strategies to overcome their marginalising effects,
European Observation Network for Territorial Development and Cohesion (ESPON), September 2018.
In It Together: Why Less Inequality Benefits All, OECD, May 2015.
ENDNOTES
1
Income inequality is understood here as the quintile share ratio (S80/S20). The indicator used in the social scoreboard
is based on the EU-SILC data (statistics on income, social inclusion and living conditions).
2
Atkinson T. (2015) Inequality: What Can Be Done?, Harvard University Press, and Piketty, T. (2014), Capital in the 21st
Century, Belknap Press.
3
Other measures, offering more detailed information on inequality and distribution, include the Coefficient of Variation,
the Atkinson Index, the Theil Index, the Mean Logarithmic Deviation (MLD) and the Transition Probability Matrix. They
use different weighting schemes and may be more sensitive to changes at the lower or upper end of the distribution
or around the median.
4
NUTS (Nomenclature of territorial units for statistics or Nomenclature des Unités territoriales statistiques in French) is
a geographical nomenclature subdividing the economic territory of the European Union into regions at three different
levels (NUTS 1, 2 and 3 respectively, moving from larger to smaller territorial units).
5
The Nordic Member States include Denmark, Finland and Sweden.
6
For a comprehensive overview of EU regional indicators, see A. Widuto, Beyond GDP: Global and regional development
indicators, EPRS, European Parliament, 2016.
DISCLAIMER AND COPYRIGHT
This document is prepared for, and addressed to, the Members and staff of the European Parliament as
background material to assist them in their parliamentary work. The content of the document is the sole
responsibility of its author(s) and any opinions expressed herein should not be taken to represent an official
position of the Parliament.
Reproduction and translation for non-commercial purposes are authorised, provided the source is
acknowledged and the European Parliament is given prior notice and sent a copy.
© European Union, 2019.
Photo credits: © Karolina / Fotolia.
eprs@ep.europa.eu (contact)
www.eprs.ep.parl.union.eu (intranet)
www.europarl.europa.eu/thinktank (internet)
http://epthinktank.eu (blog)
8You can also read