2016 SYMBIOTICS MIV SURVEY - Market Data & Peer Group Analysis 10th edition September 2016 - Presentation
←
→
Page content transcription
If your browser does not render page correctly, please read the page content below
2016 SYMBIOTICS MIV SURVEY
Market Data & Peer Group Analysis

10th edition
September 2016
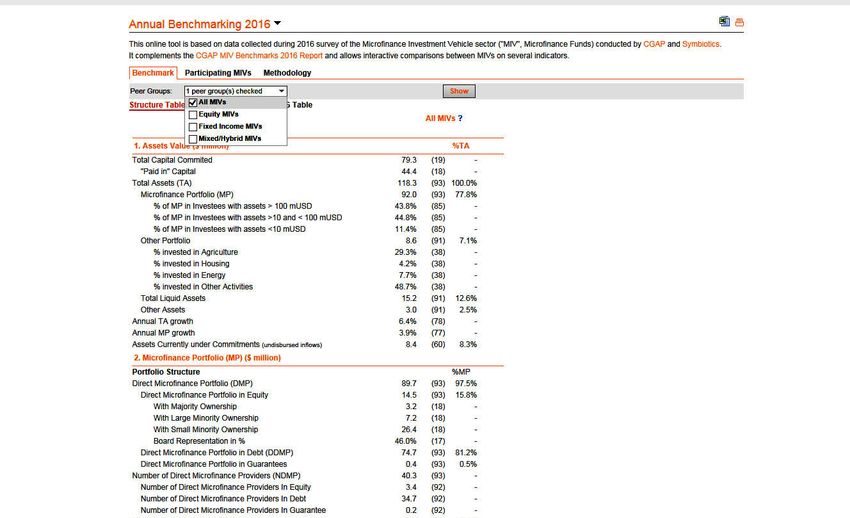
2016 Symbiotics MIV Survey

TABLE OF CONTENTS
1.   About the MIV Survey. . . . . . . . . . . . . . . . . . . . . . . . . . . . . . . . . . . . . . . . . .          3          4.3      Peer Groups – Asset Composition and Liquidities Growth. . . . . . . . .  30
     1.1      About the MIV Survey – Overview. . . . . . . . . . . . . . . . . . . . . . . . . . . . .                 4         4.4      Peer Groups – Regional Allocation: Volume. . . . . . . . . . . . . . . . . . . . .  31
     1.2      About the MIV Survey – Study Scope. . . . . . . . . . . . . . . . . . . . . . . . . . .                  5         4.5      Peer Groups – Regional Allocation: Number of Investees. . . . . . . . .  32
2.   Main results at a glance. . . . . . . . . . . . . . . . . . . . . . . . . . . . . . . . . . . . . . . .          6          4.6      Peer Groups – Country Allocation Top 10. . . . . . . . . . . . . . . . . . . . . . .  33
3.   MIV Market. . . . . . . . . . . . . . . . . . . . . . . . . . . . . . . . . . . . . . . . . . . . . . . . . .  10           4.7      Peer Groups – Risk Concentration. . . . . . . . . . . . . . . . . . . . . . . . . . . . .  34
     3.1      MIV Market – Market Size. . . . . . . . . . . . . . . . . . . . . . . . . . . . . . . . . . . .  11                4.8      Peer Groups – Funding Sources. . . . . . . . . . . . . . . . . . . . . . . . . . . . . . .  35
     3.2      MIV Market – Number of Funds. . . . . . . . . . . . . . . . . . . . . . . . . . . . . . .  12                      4.9      Peer Groups – Cost Structure. . . . . . . . . . . . . . . . . . . . . . . . . . . . . . . . .  36
     3.3      MIV Market – Growth of Total Assets and Microfinance Portfolio. . .  13                                            4.10 Peer Groups – Financial Performance. . . . . . . . . . . . . . . . . . . . . . . . . .  37
     3.4      MIV Market – Market Concentration. . . . . . . . . . . . . . . . . . . . . . . . . . .  14                         4.11 Peer Groups – Fixed Income Funds’ Performance. . . . . . . . . . . . . . . .  38
     3.5      MIV Market – Asset Managers . . . . . . . . . . . . . . . . . . . . . . . . . . . . . . . .  15                    4.12 Peer Groups – Governance in ESG Practices. . . . . . . . . . . . . . . . . . . . .  39
     3.6      MIV Market – Asset Composition & Investee Size. . . . . . . . . . . . . . . .  16                                  4.13 Focus on Equity Funds’ Characteristics. . . . . . . . . . . . . . . . . . . . . . . . .  40
     3.7      MIV Market – Financial Instruments. . . . . . . . . . . . . . . . . . . . . . . . . . .  17                        4.14 Equity Funds: Geographical Concentration per Country – Top 10. . .  41
     3.8      MIV Market – Direct Debt Investments. . . . . . . . . . . . . . . . . . . . . . . . .  18                     5.   In Cooperation with the Social Performance Task Force. . . . . . . . . . . . . .  42
     3.9      MIV Market – Zoom on “Other Portfolio”. . . . . . . . . . . . . . . . . . . . . . . .  19                          5.1      SPTF Cooperation – Investment Terms for Lenders . . . . . . . . . . . . . .  43
     3.10 MIV Market — Yield on Direct Debt Investments. . . . . . . . . . . . . . . . .  20                                     5.2      SPTF Cooperation – Preferential Terms. . . . . . . . . . . . . . . . . . . . . . . . . 44
     3.11 MIV Market – Regional Distribution. . . . . . . . . . . . . . . . . . . . . . . . . . . . 21                           5.3      SPTF Cooperation – MIVs' Principal Social Goals . . . . . . . . . . . . . . . .  45
     3.12 MIV Market – Regional Distribution – 10 years. . . . . . . . . . . . . . . . . .  22                                   5.4      SPTF Cooperation – Financial and Social Returns . . . . . . . . . . . . . . .  46
     3.13 MIV Market – Country Allocation. . . . . . . . . . . . . . . . . . . . . . . . . . . . . .  23                         5.5      SPTF Cooperation – Measurement non-Financial Returns . . . . . . . .  47
     3.14 MIV Market – Environmental, Social, Governance (ESG):                                                                  5.6      SPTF Cooperation – Social Rating & Social Audit. . . . . . . . . . . . . . . .  48
              Social Outreach . . . . . . . . . . . . . . . . . . . . . . . . . . . . . . . . . . . . . . . . . . . .  24        5.7      SPTF Cooperation – Green Loans. . . . . . . . . . . . . . . . . . . . . . . . . . . . . .  49
     3.15 MIV Market – ESG: Investee Product Range. . . . . . . . . . . . . . . . . . . . .  25                                  5.8      SPTF Cooperation – Responsible Governance: Equity & Mixed Funds. . 50
     3.16 MIV Market – ESG: Client Protection. . . . . . . . . . . . . . . . . . . . . . . . . . .  26                           Annex 1: Participating MIVs. . . . . . . . . . . . . . . . . . . . . . . . . . . . . . . . . . . . . . . .  51
4.   MIV Peer Group Analysis . . . . . . . . . . . . . . . . . . . . . . . . . . . . . . . . . . . . . . .  27                   Annex 2: Syminvest Benchmarking. . . . . . . . . . . . . . . . . . . . . . . . . . . . . . . . . .  53
     4.1      Peer Groups – Segmentation . . . . . . . . . . . . . . . . . . . . . . . . . . . . . . . . .  28
     4.2      Peer Groups – Growth of Total Assets and Microfinance Portfolio. .  29

                                                                                                                                                                                                                                     Page 2
1. ABOUT THE MIV SURVEY
2016 Symbiotics MIV Survey

1.1
ABOUT THE MIV SURVEY – OVERVIEW
ABOUT THE SURVEY

The 2016 Symbiotics MIV Survey is an annual study which aims to provide           The survey offers two levels of analysis:
comprehensive market trends and peer group analysis on microfinance off-          1.   Key market trends and figures
shore investments. Its primary function is to allow microfinance investors and    2.   Benchmarks and peer group analysis
fund managers to benchmark themselves and improve their knowledge of the
industry. It also allows academia researchers and companies to have access to     It focuses on two dimensions:
unique information about microfinance funds over a 10-year period.                1.   Financial performance, with a focus on growth, risk, return, efficiency and
                                                                                       funding patterns
The Survey, in its 10th edition, is based on December 2015 financial and social   2.   Social performance, with a focus on commitment to Environmental, Social
performance indicators reported by nearly all microfinance investment vehicles         and Governance (ESG) practices and reporting
(MIVs). Participating MIVs report their data based on the CGAP MIV Disclosure
Guidelines (2010) and the Microfinance Investment Vehicles Disclosure             As an add-on for this 10th edition, Symbiotics has collected and reported
Guidelines: Additional Indicators (2015) developed in 2015 by Symbiotics in       aggregated results on selected ESG indicators developed by the Social
collaboration with other microfinance asset managers.                             Performance Task Force (SPTF), a global membership organization that works to
                                                                                  advance social performance management.

                                                                                                                                                               Page 4
2016 Symbiotics MIV Survey
1.2
ABOUT THE MIV SURVEY – STUDY SCOPE
SAMPLE CHARACTERISTICS THE BENCHMARK AND PEER GROUPS
This year’s sample compiles data from the following types of vehicles: The 2016 Symbiotics MIV Survey offers a benchmark comprised of 93 MIVs.
§§ Independent investment entities with more than 50% of their non-cash Initially, 95 funds had submitted their data to Symbiotics but two of them
assets invested in microfinance and open to multiple investors. were removed from the final benchmark because they did not match the
§§ Microfinance investment funds that are not open to multiple investors. These aforementioned inclusion criteria.
are classified as “Other Microfinance Investment Intermediaries (MIIs)” as per
the CGAP MIV Disclosure guidelines. These 93 MIVs are broken down into the following peer groups:
§§ Fixed Income Funds: Investment funds and vehicles of which the core
The survey sample does not include microfinance funds of funds as to avoid any activity, defined as more than 85% of their total non-cash assets, is to invest
double counting of investment volumes. in debt instruments.
§§ Mixed Funds: Investment funds and vehicles that invest in both debt and
equity with more than 15% and less than 65% of their total non-cash assets
invested in equity investments.
§§ Equity Funds: Investment funds and vehicles of which the core activity,
defined as more than 65% of their total non-cash assets, is to invest in
equity instruments.
The above peer-group classification is made in accordance with the CGAP MIV
Disclosure Guidelines and could result in a different classification compared to
the MIV’s mission statement.
Page 52. MAIN RESULTS AT A GLANCE
2016 Symbiotics MIV Survey
2.
MAIN RESULTS AT A GLANCE
SURVEY COVERAGE ASSETS UNDER MANAGEMENT ( USD billion)
§§ The 10th edition of the MIV Survey gathered a record participation rate:
out of the 113 MIVs identified, 93 were included in the benchmark. Estimation of MIV Universe 11.6
§§ These 93 MIVs had USD 11 billion of total assets under management as of
December 31st, 2015.
MIV Survey Size 11.0
§§ They represent 95% of the MIV market asset base, currently estimated at
USD 11.6 billion.
§§ Out of the participating MIVs (93): 54 were Fixed Income Funds, 22 were 0 2 4 6 8 10 12
Mixed/Hybrid Funds and 17 were Equity Funds.
MARKET SHARE OF MIVs PARTICIPATING
IN THE SURVEY
95%
0% 20% 40% 60% 80% 100%
Page 72016 Symbiotics MIV Survey
2.
MAIN RESULTS AT A GLANCE (continued)
MIV MARKET
§§ Participating MIVs are managed by 46 different asset managers located in
§§
16 countries. The top 3 asset managers managed 41% of the sample’s total
assets.
Growth in 2015 was slightly lower than in 2014 on a USD constant basis:
99
Countries covered by Survey Participants
12.4% in total assets and 9.3% in microfinance portfolio.
§§ Nearly 60% of the MIVs’ microfinance portfolio is channelled mainly to “large
microfinance institutions” (those with USD assets above 100 million).
§§ Volumes channelled to Eastern Europe & Central Asia region have decreased MIVS’ MICROFINANCE PORTFOLIO BREAKDOWN
by 17% in 2015, while in terms of countries, India received the largest share BY INSTITUTION SIZE (n=85)
of direct microfinance investments in 2015 (11%).
§§ The MIVs’ outreach continues to improve with more active borrowers being 6%
Microfinance Portfolio invested in investees
reached, i.e. 307,450, while Microfinance Institutions are providing lower size with total assets of over USD 100 million
loans to their end-clients, i.e. USD 1,545. Microfinance Portfolio invested in investees
36% with total assets between USD 10 million
PERCENT
and USD 100 million
58%
Microfinance Portfolio invested in investees
with total assets under USD 10 million
Page 82016 Symbiotics MIV Survey
2.
MAIN RESULTS AT A GLANCE (continued)
PEER GROUP ANALYSIS EQUITY FUNDS’ PERCENTAGE OWNERSHIP
IN MICROFINANCE INVESTEES (n=18)
§§ Fixed Income Funds still represented close to 75% of the benchmark volume
while Equity Funds have reached 10%. 9%
Majority Ownership
§§ Equity Funds witnessed the largest growth in terms of total assets (+28%)
in 2015. 19% Large Minority Ownership
§§ The majority of direct microfinance equity investments (72%) enabled PERCENT Small Minority Ownership
Equity Funds to take a “small minority” stake (under 25% ownership) in their
portfolio investees.
72%
§§ While some similarities exists between Fixed Income Funds and Mixed
Funds in terms of top 10 countries exposure, Equity Funds mostly target
India (59%).
§§ Institutional investors remained the prime funding resource for MIVs,
USD 4.5 billion. For a constant sample of 70 MIVs, capital from the private GROWTH IN FUNDING SOURCES: ALL MIVs (n=70)
retail and high-net worth individuals represented the largest increase in
4,000 3,579 3,666
2014 2015
2015, respectively 16% and 18%. 3,500
§§ Based on a constant sample of 55 MIVs, the Total Expense Ratio (TER) 3,000
2,411
slightly increased while management fees slightly decreased, implying an 2,500 2,272
overall increase in other operating expenses. 2,000
§§ Overall, net returns to investors decreased in 2015 across all vehicle types, 1,500
1,044
1,000 903
to below 3% for USD, EUR, and CHF share classes.
500 283 333
0
Retail High-Net Worth Institutional Public Sector
Investors Individuals Investors Investors
Growth 16% 18% 2% 6%
Page 93. MIV MARKET
2016 Symbiotics MIV Survey

3.1
MIV MARKET – MARKET SIZE
In its tenth year, the 2016 MIV Survey experienced the highest ever participation   ASSETS UNDER MANAGEMENT ( USD billion)
rate. Out of the 113 MIVs identified, 95 submitted their data and 93 were
included in the final benchmark. Together, these 93 MIVs’ total assets,
i.e. USD 11 billion, represented 95% of the total market size, estimated at
                                                                                    Estimation of MIV Universe                         11.6
USD 11.6 billion.

                                                                                              MIV Survey Size                          11.0

95
Study Participants
                                         113
                                         Total Number of MIVs
                                                                                                                 0         2     4        6      8       10       12

                                                                                    MARKET SHARE OF MIVs PARTICIPATING
                                                                                    IN THE SURVEY

                                                                                                                           95%

                                                                                    0%            20%                40%         60%            80%            100%

                                                                                                                                                              Page 11
2016 Symbiotics MIV Survey
3.2
MIV MARKET – NUMBER OF FUNDS
Compared to 2014, where a significant number of MIVs were launched or terminated, only five new MIVs were launched in 2015 and one ceased its activity. Four out of five
newly created funds are Fixed Income Funds.
MIV INCEPTION AND TARGETED CLOSING DATES
Newly-Opened Funds
Closed Funds
Funds Expected to Close
1 1 2 1 1 2 1 1 1 5 1 3 5 5 12 12 17 10 11 18 12 9 5 10 5
2007
2017
1975
1983
1984
1989
1992
1994
1996
1998
1999
2000
2001
2002
2003
2004
2005
2006
2008
2009
2010
2011
2012
2013
2014
2015
2016
2018
2019
2020
2021
2022
2023
2024
2025
2026
-3 -9 -6 -7 -13 -1 -10 -7 -6 -3 -7 -4 -3 -1 -2 -1 -1
Page 122016 Symbiotics MIV Survey
3.3
MIV MARKET – GROWTH OF TOTAL ASSETS AND
MICROFINANCE PORTFOLIO
The MIVs’ total assets grew by 6.4% in 2015, compared to the 2014 forecast MIV TOTAL ASSETS GROWTH
of 5.5%. In 2016, MIVs are expected to have the lowest growth in a 10-year 25%
Effective Growth Rate
period, at 2.6%2. Looking at the past 10 years, the market size has more than 20.7%
20% 19.4% 19.3%
Forecasted Growth Rate
quintupled since 2006, representing a compounded growth rate of 20% for total 16.9%
16.0%
assets and 24% for microfinance portfolio. If we only consider the MIVs that have 15% 14.0% 14.1%
participated in this survey for 10 consecutive editions3, their respective growth 9.8% 10.0%
10%
was of 16% for total assets and 21% for microfinance portfolio. 6.4%
5.5%
4.9%
5%
2.6%
0%
2010 2011 2012 2013 2014 1 2015 2016
(n=73) (n=47) (n=51) (n=56) (n=57) (n=78) (n=57)
10-YEAR GROWTH IN TOTAL ASSETS AND
MICROFINANCE PORTFOLIO
12,000
10,000
8,000
6,000
1. Total Assets Growth is different from the online benchmarking tool due to manual readjustment 4,000
of the data of two outliers.
2,000
2. When considering only the MIVs that are going to remain active at the end of 2016, the
forecasted growth rate of total assets would have been 8.2% on the basis of 42 MIVs that have 0
reported on this indicator. 2006 2007 2008 2009 2010 2011 2012 2013 2014 2015
3. Constant Sample of 14 MIVs. Total assets (CAGR: 20%) Microfinance Portfolio (CAGR: 24%)
Page 132016 Symbiotics MIV Survey
3.4
MIV MARKET – MARKET CONCENTRATION
While the MIV market remains relatively concentrated with the top 10 MIVs managing 56% of the total assets, it is overall less concentrated than in 2014, especially for
the top 5 largest MIVs. They represented 42% of the market size in terms of assets, a decrease of 3 percentage points from 2014.
Annual Change in Asset Microfinance Annual Change in MFP
Total Assets (USDm) % %
Concentration Portfolio (USDm) Concentration
All participating MIVs 10,998 100% 6.4%4 8,557 100% 3.9%4
Top Five 4,624 42% -3% 3,524 41% -4%
Top Ten 6,113 56% -2% 4,767 56% -3%
Top Twenty 8,000 73% -2% 6,323 74% -3%
Top Fifty 10,286 94% -1% 8,026 94% -2%
4. Annual growth calculation is based on MIV accounting currencies translated into USD using the respective end of year FX rates. Annual Growth is calculated on the basis of a constant sample of 78 MIVs.
Page 142016 Symbiotics MIV Survey
3.5
MIV MARKET – ASSET MANAGERS
The MIVs’ total assets are managed by specialized ASSET MANAGERS’ DOMICILE: TOP 5
asset management companies located in No. of MIVs per Asset
Total Assets (USDm) Microfinance Portfolio (USDm)
16 different countries5. Switzerland remains the Manager Location
country where most assets are managed from, at
2014 2015 2014 2015 93
30%, followed by the Netherlands which manages
a fifth of the market. The market shares among Switzerland 30% 30% 32% 32% 17
the top 5 domiciles of asset managers is relatively
stable compared to 2014. However, the market is Netherlands 25% 23% 24% 22% 12
slightly less concentrated among the top managers Germany 17% 17% 17% 16% 9
with the largest three managing 41% of the
market compared to 43% at the end of 2014. Luxembourg 7% 9% 8% 9% 6
USA 8% 8% 7% 8% 20
ASSET MANAGERS’ CONCENTRATION ( USD billion)
10
Total Assets 2014 Total Assets 2015
8.2
8 7.7
5.8 6.1
6
4.3 4.5
4
2
0
Top 3 Top 5 Top 10
5. The country allocation is determined by the asset managers’
management mandate and not by their advisory mandate 2015 Market
Share in % 41% 55% 74%
(if any).
Page 152016 Symbiotics MIV Survey
3.6
MIV MARKET – ASSET COMPOSITION & INVESTEE SIZE
The MIVs’ asset composition has followed a relatively similar trend over the past MIV ASSET COMPOSITION
few years: the microfinance portfolio forms the bulk of total assets followed by
4% 4% 4% 3% 3% 2% 3%
liquidities at 13%, while other assets only account for less than 5%. At the end 100%
17% 14% 13% 13% 12% 13%
26% 16% 13% 14%
of 2015, 58% of the total microfinance investment volume was directed towards 9% 7% 7%
80% 13% 10% 8% 9% 8%
10%
large institutions, i.e. those having over USD 100 million in total assets. This 12%
60%
proportion is similar to what was observed in 2014.
40% 62% 70% 77% 70% 73% 75% 75% 76% 80% 78%
20%
0%
2006 2007 2008 2009 2010 2011 2012 2013 2014 2015
Microfinance Portfolio Liquidities
Other Portfolio Other Assets
(SME, Fair Trade, Market Instruments)
Other Assets and Other Portfolio
MIVS’ MICROFINANCE PORTFOLIO BREAKDOWN
BY INSTITUTION SIZE (n=85)
6%
Microfinance Portfolio invested in investees
with total assets of over USD 100 million
Microfinance Portfolio invested in investees
36% with total assets between USD 10 million
PERCENT
and USD 100 million
58%
Microfinance Portfolio invested in investees
with total assets under USD 10 million
Page 162016 Symbiotics MIV Survey
3.7
MIV MARKET – FINANCIAL INSTRUMENTS
Nearly the entire volume of microfinance investments (97%) was channelled FINANCIAL INSTRUMENTS AS %
to investees using a direct investment strategy, through either debt (81%) or OF TOTAL MICROFINANCE PORTFOLIO (n=92)
equity (16%). The use of indirect investments remained scarce and this type 1% 1%
of financing has decreased by nearly 20% in 2015 using a constant sample of
77 MIVs. Direct Debt
16%
1%
Direct Guarantees
PERCENT Direct Equity
Indirect Debt
81% Indirect Equity
GROWTH ( IN %) AND AVERAGE VOLUME OF
FINANCIAL INSTRUMENTS (in USDm) 2014-20156
120
99.0 102.8
100
83.9 85.9 2014 2015
80
60
40
20 14.9 16.4
2.6 2.1 1.7 1.1 0.7 0.9
0
Total Direct Direct Direct Total Indirect Indirect Indirect
Portfolio Equity Debt Portfolio Equity Debt
Growth 4% 10% 2% -19% -36% 30%
6. Growth rate calculated using a constant sample of 77 MIVs.
Page 172016 Symbiotics MIV Survey
3.8
MIV MARKET – DIRECT DEBT INVESTMENTS
At the end of 2015, debt investment of USD 2.2 million are outstanding per investee, up from USD 2 million in 2014. Remaining maturity is relatively stable at over
21 months while the portion of debt investments in local currency amounts to 30% of the direct debt microfinance portfolio. On average, an MIV finances more institutions
in 2015, respectively 40 vs. 35 in 2014.
MIV DIRECT DEBT INVESTMENT CHARACTERISTICS AVERAGE DEBT INVESTMENT SIZE ( ADIS ) vs.
AVERAGE REMAINING MATURITY ( ARM )
2014 2015
22.0
Average Debt Investment Size USD 2 million USD 2.2 million
21.7
Average Number of Investees (n=93) 35 40 2.5 2.2
2.0
2.0
Average Remaining Maturity (n=67) 22.0 months 21.7 months
1.5
1.0
Share of Local Currency (n=70) 30.8% 29.5%
0.5
Unhedged Portion7 (n=56) 16.1% 15.9% 0.0
2014 2015
ADIS (n=82) ADIS (n=92)
Outstanding Loan Loss Provisions (n=68) 2.6% 2.5% ARM=(n=60) ARM=(n=67)
Loans Written-off (n=60) 0.1% 0.4% Average Remaining Maturity (in months)
Average Debt Investment Size (USDm)
7. The unhedged portion is reported on the Direct Microfinance Portfolio in Debt. However, if we
analyse the share of unhedged investments on the proportion of local currency debt investments,
the value is equal to 45%.
Page 182016 Symbiotics MIV Survey
3.9
MIV MARKET – ZOOM ON “OTHER PORTFOLIO”8
On average, 7% of an MIV’s total assets is allocated to financing other impact OTHER PORTFOLIO CHARACTERISTICS (n=38)
themes than microfinance. Of this other portfolio, a third is invested in
31.0% 11.5% 3.5% 55.9%
agricultural value-chain while 56% in other activities that include, among others,
SME financing, education, or health. While energy remains the least financed
sector, its share in “other portfolio” has increased from 0.2% in 2014 to 3.5%
in 2015.
Agriculture Housing Energy Other Activities
8. Other Portfolio breakdown is computed on a weighted average basis.
Page 192016 Symbiotics MIV Survey
3.10
MIV MARKET — YIELD ON DIRECT DEBT INVESTMENTS
Out of the 44 MIVs which reported on the net income of their direct debt HISTORICAL SIMPLE AND WEIGHTED AVERAGE YIELD
microfinance portfolio, the computed yield was 6.9% on a weighted average ON DIRECT MICROFINANCE DEBT PORTFOLIO 9
basis. The trend has been very stable since 2013, especially on a weighted
10%
average basis.
8.1% 8.0% 8.1% 8.2% 7.9%
8% 7.5% 7.7% 7.8%
6.7% 6.9% 6.8% 6.9%
6%
4%
2%
0%
2010 2011 2012 2013 2014 2015
(n=33) (n=32) (n=41) (n=46) (n=37) (n=44)
Weighted Average Yield Simple Average Yield
9. All income figures are converted to USD to compute the average yields.
Page 202016 Symbiotics MIV Survey
3.11
MIV MARKET – REGIONAL DISTRIBUTION
All participants reported on their regional distribution. Compared to 2014, MIV PORTFOLIO REGIONAL BREAKDOWN AS %
there has been a significant reduction in MIVs’ outstanding exposure in Eastern OF DIRECT MICROFINANCE PORTFOLIO (n=93)
Europe & Central Asia, which decreased from 38% to 30% at the end of 2015.
3%
The portfolio is more balanced across the different regions and South Asia has 10% Eastern Europe & Central Asia (EECA)
attracted more capital, increasing its share of direct microfinance portfolio from
30% Latin America & Caribbean (LAC)
9% in 2014 to 15% in 2015. These shifts in regional exposures are especially
15% East Asia & Pacific (EAP)
apparent when looking at the annual growth rates in Eastern Europe & Central PERCENT
Asia with volumes having decreased by 17% whereas investments in South Asia South Asia (SA)
12%
have grown by 62% during 2015. Middle East and North Africa (MENA)
30%
Sub-Saharan Africa (SSA)
GROWTH (in %) AND AVERAGE VOLUME OF REGIONAL
EXPOSURE (in USDm) 2014-201510
40 38.2
2014
35 31.9
30.2 31.4 2015
30
25
20
15.3
15 12.5
10.8 9.5 10.0
10 8.8
5 2.1 2.5
0
EECA LAC EAP SA MENA SSA
Growth -17% 4% 16% 62% 18% 13%
10. Constant sample of 76 MIVs.
Page 212016 Symbiotics MIV Survey
3.12
MIV MARKET – REGIONAL DISTRIBUTION – 10 YEARS
When looking at regional trends over the past decade, one can see the exponential growth of microfinance investments witnessed in South Asia from 2012 onwards
growing at a rate of nearly 40% annually. Middle East and North Africa exhibited the fastest growth but absolute volumes in this region have remained low. Latin America
& the Caribbean as well as Sub-Saharan Africa have witnessed a linear, steady growth since 2010.
EASTERN EUROPE & CENTRAL LATIN AMERICA & CARIBBEAN MIDDLE EAST & NORTH AFRICA
ASIA ( EECA ) ( LAC ) ( MENA )
Compounded Annual Growth Rate: 23% Compounded Annual Growth Rate: 21% Compounded Annual Growth Rate: 70%
3500 3000 250
3000 2500 200
2500
2000
2000 150
1500
1500 100
1000
1000
500 50
500
0 0 0
2006 2007 2008 2009 2010 2011 2012 2013 2014 2015 2006 2007 2008 2009 2010 2011 2012 2013 2014 2015 2006 2007 2008 2009 2010 2011 2012 2013 2014 2015
EAST ASIA & PACIFIC ( EAP ) SOUTH ASIA ( SA ) SUB - SAHARAN AFRICA ( SSA )
Compounded Annual Growth Rate: 33% Compounded Annual Growth Rate: 51% Compounded Annual Growth Rate: 29%
1200 1500 1000
1000 1200 800
800
900 600
600
600 400
400
200 300 200
0 0 0
2006 2007 2008 2009 2010 2011 2012 2013 2014 2015 2006 2007 2008 2009 2010 2011 2012 2013 2014 2015 2006 2007 2008 2009 2010 2011 2012 2013 2014 2015
Page 222016 Symbiotics MIV Survey
3.13
MIV MARKET – COUNTRY ALLOCATION
In 2015, India moved to first place in terms of MIVs’ invested countries, followed by Cambodia, Ecuador, Peru and Georgia that have maintained their rankings in the list of
top 10 countries since 2014. However, due to the effects of currency devaluation and low oil prices in Russia, Caucasus and Central Asia, MIVs decreased their investments
in other prime countries for microfinance, such as Azerbaijan, Kyrgyzstan and Tajikistan. 11 Azerbaijan
3.7%
Georgia 35 MIVs
4.6%
33 MIVs
Armenia
3.1%
26 MIVs
Cambodia
Costa Rica 9.7%
3.3% 43 MIVs
24 MIVs
Ecuador
6.3% Bolivia
50 MIVs
3.6% India
45 MIVs 10.7%
Peru 41 MIVs
4.8% Paraguay
49 MIVs
3.3%
29 MIVs
Countries of MIV Investments: 99
Top 10 Country Allocation
11. The country exposures and regional exposures might not always match as certain MIV survey respondents only reported on their regional exposure but not on their country exposure.
Page 232016 Symbiotics MIV Survey
3.14
MIV MARKET – ENVIRONMENTAL, SOCIAL,
GOVERNANCE ( ESG ): SOCIAL OUTREACH
In terms of social outreach, the number of active borrowers financed by MIVs MIV OUTREACH
has kept increasing since 2011 and reached on average 307,450 clients in 2015.
350,000 Average Number of Active Borrowers Financed (n=78) 307,450
In parallel, the average loan size of microfinance institutions to their clients 300,000
259,291
decreased slightly in 2015. In terms of environmental measurement, nearly 250,000
201,952
80% of respondents reported that they now have a procedure to integrate the 200,000 165,246
150,000 137,381
consideration of environmental issues in their investment decision process. 118,892
100,000
50,000
53%
Rural
Average
0
2010
1,631
2011
1,797
2012
2,069
2013
1,787
2014
1,622
2015
1,575
Loan Size*
* Average Loan Size of MFIs to Active Borrowers (in USD) (n=85)
68% 2%
Female Borrowers Semi-urban
ENVIRONMENTAL ISSUES INTEGRATED IN
INVESTMENT DECISION (in %)
79.2% 79.5%
80% 72.0% 70.7%
65.7%
60%
45%
45.5%
40%
Urban 20%
0%
2010 2011 2012 2013 2014 2015
(n=66) (n=67) (n=75) (n=75) (n=77) (n=83)
Page 242016 Symbiotics MIV Survey
3.15
MIV MARKET – ESG: INVESTEE PRODUCT RANGE
Active borrowers making voluntary savings increased by 7.4 percentage points, VOLUNTARY SAVERS AS A % OF ACTIVE BORROWERS
a significant jump after three years of stagnation. Other financial services such
80%
as debit and credit cards, money transfers, payments by check, etc. took the 65.7%
58.3%
lead in terms of microfinance investees’ “other product offerings” (i.e: excluding 60%
loans), followed by insurance products and non-financial services (enterprise
40%
services, adult education, health services, agricultural extension and training,
and women’s empowerment). 2015 also saw a major increase in the proportion
20%
of investees that make use of mobile banking (either through its incorporation
into their business processes or by acting as agents of mobile money providers) 0%
2014 (n=39) 2015 (n=44)
representing 18.4% of these offerings up from 9.3% in 2014.
OTHER PRODUCT OFFERINGS
Non-financial Services (n=51) 57.1%
Other Financial Services (n=45) 60.7%
Insurance (n=46) 58.5%
Savings (n=60) 50.9%
Mobile Banking Facilities12 (n=25) 18.4%
0% 10% 20% 30% 40% 50% 60% 70%
12. Mobile banking % is computed on a weighted average basis while the rest of the product
offerings are calculated using a simple average methodology.
Page 252016 Symbiotics MIV Survey
3.16
MIV MARKET – ESG: CLIENT PROTECTION
Endorsement of the Smart Campaign’s Client Protection Principles (CPPs)13 ENDORSEMENT OF THE CLIENT PROTECTION
slightly decreased by 1% due to the increase of the size of the sample reporting PRINCIPLES (% MIVs)14
on this indicator (87 out of 93 in 2015 vs. 76 out of 84 in 2014). The percentage
98.8% 97.7%
100%
of microfinance institutions of the MIVs’ Direct Microfinance Portfolio that
have undergone a Smart Assessment (an intermediate step in the aim towards 80%
becoming “Client Protection Certified”) or received CPP certification increased
60%
from 25% in 2014 to 32% as of December 2015.
40%
20%
0%
2014 (n=76) 2015 (n=87)
32%
Smart Assessment Completion
13. Source: The Smart Campaign
14. Percentage computed on a weighted average basis.
Page 264. MIV PEER GROUP ANALYSIS
2016 Symbiotics MIV Survey

4.1
PEER GROUPS – SEGMENTATION
The 2015 market segmentation was stable compared to 2014. Fixed Income remains the lead strategy, both in terms of number of MIVs and in terms of investment
volumes. Their combined assets still account for nearly three-fourth of the total benchmark. Equity funds have increased their market share compared to 2014 and
represented 18% of the benchmark in terms of number of MIVs (vs. 17% in 2014) and 10% in terms of total assets (vs. 8% in 2014).

2015 MIV MARKET SEGMENTATION
                                                                               Total Assets                              Microfinance Portfolio
                             Number of MIVs                 %                                              %                                               %
                                                                                 (USDm)                                         (USDm)

All participating MIVs             93                     100%                   10,998                   100%                     8,557                 100%

Fixed Income Funds                 54                     58%                     8,056                   73%                      6,190                  72%

Mixed Funds                        22                     24%                     1,814                   16%                      1,462                  17%

Equity Funds                       17                     18%                     1,128                   10%                      905                    11%

                                                                                                                                                                   Page 28
2016 Symbiotics MIV Survey
4.2
PEER GROUPS – GROWTH OF TOTAL ASSETS AND
MICROFINANCE PORTFOLIO
The positive growth witnessed by MIVs in 2015 is well translated for Fixed-Income Funds and Equity Funds especially which have grown by more than 25% in size. Mixed
Funds experienced negative growth in 2015, shrinking by 8% and 13% in total assets and in relation to their microfinance portfolio respectively15. In terms of the forecast
for 2016, Equity Funds are expected to decrease quite significantly in terms of volume (-13%) while Fixed-Income Funds and Mixed Funds should both experience an
increase in total assets of 4%.
ANNUAL GROWTH OF TOTAL ASSETS ANNUAL GROWTH OF MICROFINANCE PORTFOLIO
30% 28% 30%
2014 201515 2016 – Forecast 2014 2015 25%
20% 16% 20%
10%
10% 7% 8% 10% 8% 7% 7%
5% 6%
3% 4% 4% 4%
0%
0% 0%
-10% -6% -10%
-8%
-13% -13%
-20% -20%
All MIVs Fixed Income Funds Mixed Funds Equity Funds All MIVs Fixed Income Funds Mixed Funds Equity Funds
(n=78) (n=43) (n=22) (n=13) (n=77) (n=42) (n=22) (n=13)
15. If Symbiotics Market Research had applied a constant FX rate, growth in total assets would have amounted to respectively 12.4%/14.1%/-0.2%/27.6% for, All MIVs/Fixed Income/ Mixed/Equity Funds.
Page 292016 Symbiotics MIV Survey
4.3
PEER GROUPS – ASSET COMPOSITION AND
LIQUIDITIES GROWTH
MIVs’ microfinance portfolio proportion of total assets decreased slightly from 80% in 2014 to 78% in 2015 while the share of liquidities has increased across all peer
groups, most notably for Equity Funds, from 3% in 2014 to 7% in 2015. This is well reflected in the annual growth figures for liquidities where there was a 161% increase
for Equity Funds although the base value is relatively low16. The portion of liquidities remains nonetheless the lowest for Equity Funds, justified by this particular business
model’s strategy.
TOTAL ASSET COMPOSITION BY PEER GROUP LIQUIDITY GROWTH BY PEER GROUP 2014-2015
3% 3% 1% 1% 1,500
100% 1,307
17% 7% 2014 2015
13% 13% 1,146
12% 1,200
80% 7% 8% 2%
931
900 835
60%
77% 76% 600
40% 78% 77% 81% 80%
286 311
300
20%
25 65
0
0% All MIVs Fixed Income Funds Mixed Funds Equity Funds
All MIVs Fixed Income Funds Mixed Funds Equity Funds (n=91) (n=52) (n=22) (n=17)
(n=91) (n=52) (n=22) (n=17)
Liquidities
Other Assets Liquidities Growth 14% 12% 9% 161%
Other Portfolio (Agriculture, Housing, Energy, SMEs and Other Market Instruments)
Microfinance Portfolio
16. Growth figures for liquidities are calculated using a constant sample of 77 MIVs across the period 2014-2015.
Page 302016 Symbiotics MIV Survey
4.4
PEER GROUPS – REGIONAL ALLOCATION: VOLUME
Regional exposure in Eastern Europe & Central GEOGRAPHICAL ALLOCATION IN 2014 AND 2015
Asia, historically the prime region for microfinance
38% 2014 2015
investments, decreased considerably in 2015 as 30% 30% 30%
market difficulties encountered in Russia spread in All MIVs (n=93) 15%
11% 12% 9% 9% 10%
neighbouring countries. This region accounts for 3%
2%
30% of the direct microfinance portfolio at the end
of 2015, equal with Latin America & the Caribbean. 45%
South Asia also witnessed a significant shift in 35%
28% 29%
exposure, across all strategies. It is now the 3rd
Fixed Income Funds (n=54)
largest region for MIV investments, overtaking East 10% 12% 11% 8% 10%
7%
2% 3%
Asia and Pacific. Additionally, Mixed Funds exhibit
the most diversified regional concentration of all
three peer groups. 29% 31% 32%
22%
18%
15% 14% 13% 12%
Mixed Funds (n=22) 11%
2% 2%
49% 47%
35% 32%
Equity Funds (n=17)
8% 6% 7% 7%
2% 5%
1% 1%
Eastern Europe Latin America East Asia South Asia Middle East Sub-Saharan
& Central Asia & Caribbean & Pacific & North Africa Africa
Page 312016 Symbiotics MIV Survey
4.5
PEER GROUPS – REGIONAL ALLOCATION:
NUMBER OF INVESTEES
Most investees remain located in Latin America GEOGRAPHICAL ALLOCATION: % OF DIRECT INVESTEES IN 2014 AND 2015
& the Caribbean compared to other regions
36% 36% 2014 2015
(36%). As observed with volumes, the number of 28%
24%
investees also decreased in Eastern Europe & All MIVs (n=93) 16% 16%
13%
10% 9%
Central Asia while institutions in South and East 7%
3%
2%
Asia represent together 22% of portfolio investees.
Presence in the Middle East & North Africa
remains scarce across all strategies. Sub-Saharan 37% 37%
29%
25%
African institutions remain an important part of Fixed Income Funds (n=54)
12% 15% 15%
the portfolio for all peer groups as they account for 10% 7%
6% 3%
2%
16% of all portfolio institutions.
33% 33%
26% 23% 20% 17%
16%
Mixed Funds (n=22) 10% 8%
7% 4% 3%
40%
33% 32%
Equity Funds (n=17) 25%
20% 21%
8% 10%
5% 6%
1% 1%
Eastern Europe Latin America East Asia South Asia Middle East Sub-Saharan
& Central Asia & Caribbean & Pacific & North Africa Africa
Page 322016 Symbiotics MIV Survey
4.6
PEER GROUPS – COUNTRY ALLOCATION TOP 10
Fixed-Income and Mixed Funds both had Cambodia, India and Ecuador in FIXED INCOME FUNDS (n=54)
descending order as their top 3 country allocation while Peru was listed in their
Cambodia 9.3%
top 5. Compared to 2014, notable differences include India which was in the
India 7.4%
2nd position as of December 2015 (5th in the previous year) while Azerbaijan Ecuador 6.3%
came out of the top 5 for all strategies. Cambodia remains the top country in Peru 5.0%
terms of microfinance investments for Fixed Income and Mixed funds and has Georgia 5.0%
increased its market share in relation to other countries. Overall, India has taken Azerbaijan 4.3%
the 1st position, which is attributable to major equity investments taking place Costa Rica 4.1%
by specialized regional investment vehicles17. Serbia 3.8%
Armenia 3.7%
Turkey 3.5%
0% 1% 2% 3% 4% 5% 6% 7% 8% 9% 10%
MIXED/HYBRID FUNDS (n=22)
Cambodia 13.5%
India 10.1%
Ecuador 8.0%
Bolivia 5.5%
Peru 4.7%
Georgia 4.4%
Kyrgyzstan 3.9%
Tajikistan 3.6%
Paraguay 3.4%
Nicaragua 2.7%
17. Country exposures and regional exposures might not always match as certain MIVs only reported
on their regional exposure but not on their country exposure. 0% 2% 4% 6% 8% 10% 12% 14%
Page 332016 Symbiotics MIV Survey
4.7
PEER GROUPS – RISK CONCENTRATION
Comparatively to 2014, risk concentration with CONCENTRATION INDICATORS (% OF DIRECT MICROFINANCE PORTFOLIO )
regards to the top 5 investees remained very
100%
91% 89%
stable while MIVs were slightly less diversified 86%
based on their the top 5 country exposure, with a 78%
80%
concentration level at 55% vs. 54% in 2014. The
Top one region exposure is showed to be more 60% 55% 53%
51% 51% 52%
segmented compared to 2014 due to a decrease in 38%
40% 34%
concentration of Fixed-Income Funds which stood 29% 28%
24%
21%
at 51% compared to 57% in 2014. Conversely, the 20% 12%
Top 5 unhedged currency exposures account for a
larger portion of the direct microfinance portfolio 0%
All MIVs Fixed Income Funds Mixed Funds Equity Funds
today (28% vs. 23% in 2014).
Top One Region Exposure Top Five Country Exposure
Top Five Investment Exposure Top Five Unhedged Currency Exposure
Number of Observation All MIVs Fixed Income Funds Mixed Funds Equity Funds
Top One Region Exposure 93 54 22 17
Top Five Country Exposure 93 45 22 17
Top Five Investment Exposure 89 53 22 14
Top Five Unhedged Currency Exposure 52 20 19 13
Page 342016 Symbiotics MIV Survey
4.8
PEER GROUPS – FUNDING SOURCES
In terms of MIVs’ funding sources, institutional SOURCE OF MIV FUNDING
investors remained the prime source for MIVs 60%
60%
(USD 4.5 billion), financing an average of 47% of 50%
47% 48%
their capital. The distribution of other investor- 45%
37%
type sources was similar to 2014, with public 29%
30% 26% 24%
funding still representing a fourth of MIV capital 21% 20% 21%
(USD 2.2 billion) and the remaining portion 15% 12%
covered by retail and high-net worth individuals 4% 3% 1% 1%
0%
(USD 2.7 billion). Mixed Funds remain largely All MIVs (n=86) Fixed Income Funds (n=48) Mixed Funds (n=22) Equity Funds (n=16)
funded by retail investors at 50%. In terms of
Public Sector Funders Institutional Investors High-Net Worth Individuals Retail Investors
10-year trends, institutional investors’ fundings
have grown the fastest since 2006 at a rate of 26%
annually, followed by Public Sector Funders (21%) FUNDING SOURCES
and Retail & High Net Worth Individuals (15%)18.
5000
4000
3000
2000
1000
0
2006 2007 2008 2009 2010 2011 2012 2013 2014 2015
Institutional Investors (CAGR: 26%)
18. Due to a lack of data availability from certain large funds Public Sector Funders (CAGR: 21%)
known to have a retail licence, growth trends for retail Retail & High-Net Worth Individuals (CAGR: 15%)
investors have been estimated.
Page 352016 Symbiotics MIV Survey
4.9
PEER GROUPS – COST STRUCTURE
The Total Expense Ratio (TER) for the category “all MIVs” increased from MANAGEMENT FEES AND TER COMPARISON
3.1% in 2014 to 3.3% in 2015. Mixed Funds witnessed the largest increase
Simple Weighted Simple Weighted
in TER, attributable to both management fees (from 2.3% to 2.5%) and other Management Fees Change19
Average average Average average
expenses (from 1% to 1.3%). When considering a constant sample of over
50 MIVs, management fees have decreased while TER increased by 6 basis 2014 2015
points, implying that other expenses have risen, especially for Fixed-Income
All MIVs (n=52) 1.95% 1.57% 1.97% 1.53% -4 bps
Funds (+15 basis points). The TER for Equity Funds, of 3% is understated as the
computation doesn’t include certain fees specifically incurred by such vehicles Fixed Income (n=26) 1.63% 1.30% 1.68% 1.28% -2 bps
like carried interest, for example.
Mixed (n=16) 2.25% 1.92% 2.15% 2.04% +12 bps
TOTAL EXPENSE RATIOS AND MANAGEMENT FEES Equity (n=10) 2.31% 2.33% 2.40% 2.00% -33 bps
4% TER: 3.8%
TER: 3.3% Simple Weighted Simple Weighted
TER: 3.0% 1.3% TER: 3.0% TER Change19
3% Average average Average average
1.3% 0.6%
1.4%
2% 2014 2015
77% 76%
2.5% 2.4% All MIVs (n=55) 3.08% 2.23% 3.09% 2.29% +6 bps
1% 2.0%
1.6%
Fixed Income (n=29) 2.63% 2.14% 2.80% 2.27% +13 bps
0%
All MIVs Fixed Income Funds Mixed Funds Equity Funds
(TER n=68) (TER n=37) (TER n=21) (TER n=10) Mixed (n=16) 3.21% 2.29% 3.11% 2.14% -15 bps
(Mgt Fees n=63) (Mgt Fees n=33) (Mgt Fees n=20) (Mgt Fees n=10)
Equity (n=10) 2.87% 2.85% 3.04% 2.87% +2 bps
Management Fees Other Expenses
19. Change in basis points based on the weighted average figures.
Page 362016 Symbiotics MIV Survey
4.10
PEER GROUPS – FINANCIAL PERFORMANCE
Net returns of MIVs (weighted average) exhibited 2015 FINANCIAL PERFORMANCE – UNLEVERAGED VEHICLES
a downward trend across most strategies and
vehicle structures. Unleveraged vehicles’ returns Simple Weighted Simple Weighted Simple Weighted
dropped below 3% in 2015 for USD, EUR and Average Average Average Average Average Average
CHF share class currencies. In terms of leveraged
USD EUR CHF
vehicles, notes had a return of 2.5% on a weighted
average basis, down from last year’s observation Fixed Income Funds 1.8% (13) 2.6% (13) 1.9% (13) 2.4% (13) -0.5% (5) 1.1% (5)
of 3.6%.
Mixed Funds – – 4.7% (7) 2.9% (7) – –
2015 FINANCIAL PERFORMANCE – LEVERAGED VEHICLES
Simple Weighted Simple Weighted
Average Average Average Average
USD EUR
Fixed Income Notes 4.5% (7) 2.5% (7) – –
Equity Tranche (ROE) -0.2% (4) 1.4% (4) 5.2% (4) 7.1% (4)
Page 372016 Symbiotics MIV Survey
4.11
PEER GROUPS – FIXED INCOME FUNDS’ PERFORMANCE
Fixed Income Funds’ USD and EUR share classes returned 1.9% in terms of share FIXED - INCOME MIVs: NAV SHARE PRICE PERFORMANCE
price performance. This is the lowest net return since 2006 for the USD share
7%
class. It’s important to note that this percentage is comparable to the SMX-MIV
6%
debt index20, the industry benchmark, which also recorded returns at 1.9% in
2015, its lowest yearly return since the index’s inception. MIVs’ EUR share class 5%
category performed better than the SMX-MIV debt index for the same currency 4%
(1.7%). 3%
2%
1%
0%
2006 2007 2008 2009 2010 2011 2012 2013 2014 2015
Annual Return USD (n=12)
Benchmark (SMX – MIV Debt USD)
Annual Return EUR (n=13)
Benchmark (SMX – MIV Debt EUR)
20. The SMX - MIV Debt USD, EUR and CHF indexes are Symbiotics’ in-house indexes which track,
on a monthly basis, the NAV of a selection of funds with a majority of assets invested in fixed
income instruments. The funds are equally weighted. The index has been available on syminvest.
com in USD, EUR and CHF since 2004.
Page 382016 Symbiotics MIV Survey
4.12
PEER GROUPS – GOVERNANCE IN ESG PRACTICES
As of December 2015, 90% of all MIVs required their investees to have anti- REQUIREMENTS OF ANTI - CORRUPTION POLICIES
corruption policies and/or whistle-blowing procedures. This portion has (% OF MIVs)
increased across all strategies compared to 2014. In contrast, a slightly lesser 96%
100% 93%
90%
proportion of MIVs produced a special report on ESG practices for their 87%
investors or included ESG performance results in their annual report (83% vs. 80%
84% in 2014), especially Equity Funds. In terms of technical assistance, an MIV 60%
incurred on average USD 414,000 of technical assistance costs, up from USD
40%
406,ooo in 2014. Finally, more than one-third of MIVs expressed the annual cost
of raising debt financing as a single percentage figure to their investees. 20%
0%
All MIVs Fixed Income Funds Mixed Funds Equity Funds
(n=83) (n=47) (n=22) (n=14)
USD 414k
Average Annual Technical Assistance Cost (n=22) REPORTING OF ESG INFORMATION TO INVESTORS
(% OF MIVs)
100% 91%
83% 81% 79%
35.2%
80%
60%
Annual Percentage Rate Disclosure (n=63) 40%
20%
0%
All MIVs Fixed Income Funds Mixed Funds Equity Funds
(n=83) (n=47) (n=22) (n=14)
Page 392016 Symbiotics MIV Survey
4.13
FOCUS ON EQUITY FUNDS’ CHARACTERISTICS
On average, an Equity Fund in this year’s survey had USD 66 million in total assets, 80% of which were invested in microfinance. More than 15% of this category’s portfolio
was invested in institutions that are relatively small in size with assets of under USD 10 million. Comparatively, in 2014, 11% was invested in these particular institutions.
Also, close to three-fourths of this category’s portfolio is invested in small minority stakes, i.e: under 25%, while less than 10% is channelled towards a majority ownership.
In terms of institution pricing, the average price-to-book value remains at 1.86x overall. Regional differences exist however with South Asian institutions being priced at
over twice their book value.
Equity Fund Term sheet
§§ Vintage Year (Median): 2008 §§ Carried Interest: 20%
§§ Investment Period: 6 years §§ Hurdle Rate: 7.3%
Equity Fund: Asset Base Funding Sources Ownership
§§ Committed Capital: USD 67.3m §§ Private Institutional: 60% §§ Majority Ownership (>50%): 9%
§§ Paid-in: 73% §§ High Net Worth Individual: 21% §§ Large Minority Ownership (25.5%): 20%
§§ Total Assets: USD 66.3m §§ Public: 20% §§ Small Minority Ownership (2016 Symbiotics MIV Survey
4.14
EQUITY FUNDS: GEOGRAPHICAL CONCENTRATION
PER COUNTRY – TOP 1021
Philippines
Ghana 2.3%
Colombia 1.9% Pakistan
2.8%
2.5%
Peru
1.7% Nigeria India Sri Lanka
3.4% 59.4% 8.9%
Paraguay Bolivia
2.3% 4.0%
21. The Equity Funds’ Country concentration differs from the Regional concentration as some MIVs reported only on the latter.
Page 415. IN COOPERATION WITH THE SOCIAL PERFORMANCE TASK FORCE The Social Performance Task Force (SPTF) is a non-profit membership organization with more than 2,700 members from all over the world. SPTF engages to develop and promote standards and good practices for social performance management (SPM), in an effort to make financial services safer and more beneficial for clients. For more information, please visit www.sptf.info. In 2015, the SPTF partnered with Symbiotics to add questions to the MIV survey that look at how MIVs incorporate various aspects of social performance into their activities. The questions cover policies, tools and initiatives related to the work of the SPTF and its Social Investor Working Group in the pursuit of ensuring responsible investment in inclusive finance.
2016 Symbiotics MIV Survey

5.1
SPTF COOPERATION – INVESTMENT TERMS
FOR LENDERS
The SPTF’s lenders’ guidelines for setting reasonable covenants in support                 LOAN AGREEMENTS
of responsible microfinance (“reasonable            covenants22”)     is a common set of   60
covenants and social undertakings developed by a group of public and private                         2
                                                                                           50        6
investors. Out of 52 respondents, 30 MIVs, in majority Fixed-Income Funds,
                                                                                           40        14                                 2
reported that they are currently aligned with the guidelines while 14 of them                                            2
                                                                                           30                                           6
included some social undertakings but are not aligned with the guidelines.
                                                                                           20                                                                          0
                                                                                                     30
                                                                                                                                        24                            4
                                                                                           10                                                                          6
                                                                                                                                                                      30
                                                                                            0
                                                                                                  All MIVs                      Fixed Income                     Mixed Funds
                                                                                                  (n=52)                            (n=36)                          (n=16)

                                                                                                 Do not know what the Lenders' Guidelines are

                                                                                                 Not Aligned

                                                                                                 Include social undertakings but not aligned with the Lenders' Guidelines

                                                                                                 Aligned with the Lenders' Guidelines

22. For more information on Financial and Social covenants’ initiative, click here.

                                                                                                                                                                               Page 43
2016 Symbiotics MIV Survey
5.2
SPTF COOPERATION – PREFERENTIAL TERMS
A total of 10 MIVs out of 68 respondents offer preferential terms (i.e. interest rate FUNDS OFFERING PREFERENTIAL TERMS
reduction or lenient financial covenants) to financial institutions demonstrating
100
a strong social performance commitment.
80 24
1
60
14
40 58 0
31 3
4
20 1
31 0 7
10 9 10
0 1 0
All Fixed Income Mixed Equity
(n=93) (n=54) (n=22) (n=17)
Did not answer question Not yet No Yes
KIND OF PREFERENTIAL TERMS – ALL MIVs (n=10)
Non specified 5
More lenient financial covenants 4
Lower interest rate 9
0 2 4 6 8 10
Page 442016 Symbiotics MIV Survey
5.3
SPTF COOPERATION – MIVs' PRINCIPAL SOCIAL GOALS
When ranking all MIVs based on their principal social goals, «increased access to financial services» appeared to be their main social goal, followed by «employment
generation» and «improving livelihoods of clients» (except for Mixed Funds, whose third preferred choice was «growth of existing businesses»). «Growth of existing
businesses» and «gender equality & women’s empowerment» came in 4th and the 5th places respectively.
RANKING OF THE PRINCIPAL SOCIAL GOALS
Borda Count Method23 for All MIVs (n=80)
1st
Increased Access
2nd
Employment
3rd
Improving
4th
Growth of
5th
Gender Equality and
to Financial Services Generation Livelihoods of Clients Existing Businesses Women’s Empowerment
23. For the Borda Count Method, each alternative gets 1 point for each last place received, 2 points for each next-to-last point, etc., all the way up to N points for each first place alternative (where N is the number
of alternatives). The alternative with the largest point total is ranked as first.
Page 452016 Symbiotics MIV Survey
5.4
SPTF COOPERATION – FINANCIAL AND
SOCIAL RETURNS
The majority of Fixed-Income, Mixed and Equity Funds seek market rate FUNDS’ INVESTMENT STRATEGY WITH RESPECT
financial returns and postitive social returns, while only a few accept «below TO RETURNS
market» financial returns (7). The majority of MIVs measure both financial and
Maximize financial returns 2
social returns (63), while only a few (5) focus on financial returns measurement
exclusively. Market rate financial returns
37 18 13
and positive social return
Focus on social returns and accept
5 2
“below market” financial returns
Other 1
0 10 20 30 40 50 60 70
Fixed Income (n=42) Mixed (n=21)
Equity (n=15)
MEASUREMENT OF SOCIAL RETURNS (n=63)
We measure financial, social
10
and environmental returns
We only measure financial returns;
our impact is through giving access 5
We measure both financial
and social returns 63
0 10 20 30 40 50 60 70
Page 462016 Symbiotics MIV Survey
5.5
SPTF COOPERATION – MEASUREMENT
NON - FINANCIAL RETURNS
In terms of measuring non-financial returns such as social outreach and OUTREACH & OUTCOMES: DATA COLLECTION
outcomes, the majority of Fixed Income and Equity Funds seem to use mainly
70 65 Collect and analyze outreach indicators on our investees
in-house tools (65 out of 73) while half of them use both in house and externally
60
Collect and analyze outcomes data from our investees
developed social performance tools. Collecting and analyzing data to evaluate 50
social outreach and outcomes seemed to be the common practice for half of the 40 37 36
reporting MIVs. 30
21
20 15 14
7 9
10
0
All MIVs Fixed Income Mixed Equity
(n=73) (n=38) (n=21) (n=14)
ASSESSMENT TOOLS USED TO MEASURE INVESTEES’
SOCIAL PERFORMANCE
60 55
50
40 35
30
30
20 16 15 16
10 9
4
0
All MIVs Fixed Income Mixed Equity
(n=73) (n=38) (n=21) (n=14)
Use tools developed by the industry.
Use in house developed tools to assess the social performance management of our investees
Page 472016 Symbiotics MIV Survey
5.6
SPTF COOPERATION – SOCIAL RATING & SOCIAL AUDIT
When looking into the number of MIVs using internal or external social rating or NUMBER OF MFIs WITH INTERNAL/ EXTERNAL
auditing, 45 MIVs perform internal social ratings on 93% of their investees (on SOCIAL RATING/ OR SOCIAL AUDIT
a weighted average basis). Among these, only 11 MIVs make use of both, internal Simple Average
and external ratings.
25.4%
Internal (n=45)
9.8%
External (n=29)
Weighted Average
93%
Internal (n=45)
22%
External (n=29)
Page 482016 Symbiotics MIV Survey
5.7
SPTF COOPERATION – GREEN LOANS
On average, Mixed Funds had the highest percentage of investees offering green % OF MICROFINANCE INVESTEES IN THE MIVs'
loans (20%), followed by Fixed-Income Funds (11%) and Equity Funds (10%). DIRECT PORTFOLIO THAT OFFER “GREEN LOANS”
However, on a weighted average basis, the category "All MIVs" only reached 4%, ( SIMPLE AVERAGE )
based on a total of 27 observations.
25%
19.7%
20%
15%
11.4%
9.8%
10%
5%
0%
Fixed Income Mixed Equity
(n=14) (n=6) (n=7)
4%
Weighted Average (All MIVs)
Page 492016 Symbiotics MIV Survey
5.8
SPTF COOPERATION – RESPONSIBLE GOVERNANCE:
EQUITY & MIXED FUNDS
The majority of the Equity and Mixed Funds (6) systematically included SHAREHOLDER AGREEMENT CLAUSES (n=6)
clauses pertaining to the “Client Protection Principles’ Implementation” in their
shareholder agreements. Only two of these Funds included a clause ensuring 1 CPPs Implementation
that there would be no mission drift caused by new shareholders. Some
Social and Environmental (E&S)
other clauses included the creation of a Social Performance Measurement Management System Creation
2
Committee at the board level and the appointment of a responsible person for
Ensure No Mission Drift by New Shareholders
Environmental & Social (E&S) risk management. 6
Responsible Person for
1 E&S Risk Management Nomination
Page 502016 Symbiotics MIV Survey
ANNEX 1
PARTICIPATING MIVs
Fixed Income Funds Mixed/Hybrid Funds Equity Funds
Public Placement Fund BlueOrchard Microfinance Fund (ex. Dexia Microcredit Fund) ASN-Novib Microcredit Fund
Dual Return Fund SICAV Triodos Fair Share Fund
IIV-Mikrofinanzfonds Triodos SICAV II - Triodos Microfinance Fund
responsAbility Global Microfinance Fund
responsAbility Microfinanz-Fonds
Private Placement Funds AccionBridge Guarantee Program Fund Access Africa Fund LLC Aavishkaar Goodwell India Microfinance Development Company
Actiam Institutional Microfinance Fund III Actiam Institutional Microfinance Fund Aavishkaar Goodwell India Microfinance Development Company II
agRIF Coöpertiaf U.A. Actiam Institutional Microfinance Fund II Bamboo Financial Inclusion Fund
Capital Gestion - Impact Investing Actiam Institutional Microfinance Fund III Catalyst Microfinance Investors
Capital Gestion - Microfinance DWM Microfinance Fund Creation Investment Social Venture Fund I
CreSud SpA Fonds Desjardins pour la Finance Inclusive Creation Investments Social Ventures Fund II
Deutsche Bank Microcredit Development Fund Gawa Microfinance Fund DWM Microfinance Equity Fund I
Dual Return Fund – Vision Microfinance Local Currency Global Financial Inclusion Fund DWM Inclusive Finance Equity Fund II
DWM Microfinance Fund-J Impulse Microfinance Investment Fund NV Elevar Equity II, LP
EMF Microfinance Fund AGmvK NMI Frontier Fund Goodwell West Africa Microfinance Development Company Ltd
Envest Microfinance Fund LLC NMI Fund III India Financial Inclusion Fund
European Fund for South East Europe Prospero Microfinanzas Fund, LP MicroVest II, LP
FEFISOL responsAbility SICAV (Lux) Microfinance Leaders Fund Shore Cap II
FINCA Microfinance Fund B.V. Rural Impulse Fund II Unitus Equity Fund, LP
Finethic Microfinance SICAV-SIF Rural Impulse Microfinance Fund Women's World Banking Capital Partners
FPM S.A.
Global Commercial Microfinance Consortium II BV
Global Partnerhips Social Investment Fund 2010
Global Partnerships Social Investment Fund 5.0
KCD Mikrofinanzfonds (FIS) I "Global"
KCD Mikrofinanzfonds II "Lateinamerika"
KCD Mikrofinanzfonds III
Kolibri Kapital ASA
Locfund II L.P.
Luxembourg Microfinance and Development Fund
Microfinance Enhancement Facility SA
Microfinance Growth Fund
MicroVest Short Duration Fund
MicroVest+Plus
MIFA - Microfinance Initiative for Asia Debt Fund
ProPulse Fund
Regional MSME Investment Fund for Sub-Saharan Africa (REGMIFA)
Symbiotics SICAV - SEB Microfinance Fund
Symbiotics SICAV - SEB Microfinance Fund II
Symbiotics SICAV - SEB Microfinance Fund III
Symbiotics SICAV (Lux.) - Emerging Impact Bond Fund
Symbiotics SICAV (Lux.) - High Yield Frontier Impact
The SANAD Fund for MSME
The Small Enterprise Impact Investing Fund
Wallberg Global Microfinance Fund
Page 512016 Symbiotics MIV Survey
ANNEX 1
PARTICIPATING MIVs (continued)
Fixed Income Funds Mixed/Hybrid Funds Equity Funds
Cooperative Companies/NGOs Alterfin cvba Incofin CVSO
Capital for Communities Fund SIDI "Solidarité Internationale pour le Développement et l'Investissement"
Fonds International de Garantie
Grameen-Jameel Pan-Arab Microfinance Ltd
MCE Social Capital
Oikocredit
Other MIIs24 Global Microfinance Fund DID - Partnership Fund Accion Gateway Fund
Grameen Credit Agricole Microfinance Foundation Hivos-Triodos Fund Foundation
responsAbility SICAV (Lux) Financial Inclusion Fund NMI Global Fund25
Symbiotics Emerging Sustainable Funds25 Triodos Sustainable Finance Foundation
24. Other MIIs from this list include: Microfinance investment funds that are not open to multiple investors, Fund of funds, and Vehicles with less than 50% of their non-cash assets invested in microfinance.
25. Microfinance Fund of Funds, not included in the benchmark
Page 522016 Symbiotics MIV Survey
ANNEX 2
SYMINVEST BENCHMARKING
Page 53GENEVA (HQ) ZURICH MEXICO CITY
Rue de la Synagogue 31 Forchstrasse 280 Diagonal Patriotismo 12 - 602
1204 Geneva 8008 Zurich Colonia Hipódromo
Switzerland Switzerland Código Postal 06100
t +41 22 338 15 40 t +41 43 499 87 89 México D. F.
t +52 55 55 84 78 72
SINGAPORE CAPE TOWN LONDON
Singapore Land Tower 4 Loop Street, Studio 502 6 Bevis Marks
50 Raffles place, 30-28 Cape Town 8001 London EC3A 7BA
Singapore 048623 South Africa United Kingdom
t +65 66 31 27 58 t +27 21 425 51 19 t +44 203 786 1186
symbioticsgroup.comYou can also read