National Survey of 2020 Likely Voters - Get the DIGITAL VERSION - Courthouse News
←
→
Page content transcription
If your browser does not render page correctly, please read the page content below

Get the
                                                                                         DIGITAL
                                                                                         VERSION
                                                                                              GO

National Survey of 2020 Likely Voters
Dr. Rachel Bitecofer assistant director o: 757-594-8997, c: 541-729-9824 rachel.bitecofer@cnu.edu
Dr. Quentin Kidd director o: 757-594-8499, c: 757-775-6932 qkidd@cnu.edu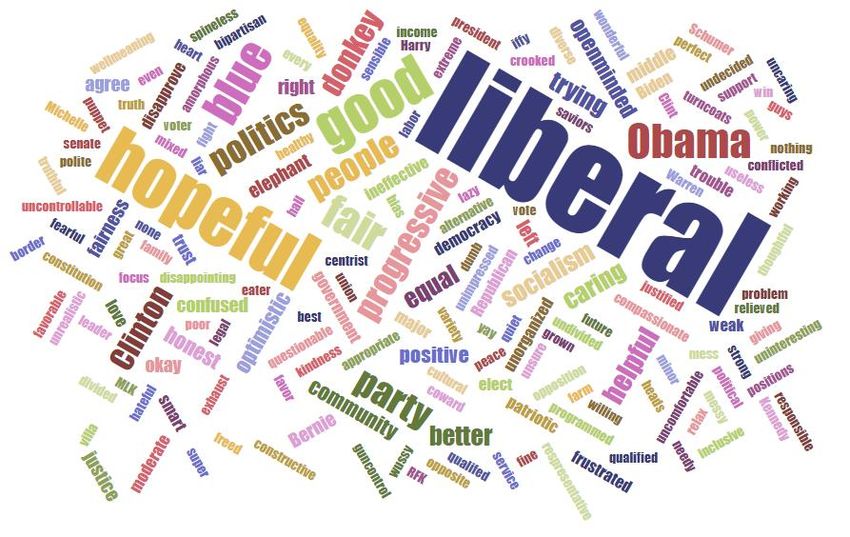
Summary of Report
   Section 1: The 2020 Electorate
• This survey is of 1,001 likely 2020 presidential election voters drawn from a nationally representative
  random probability sample using voter file sampling. A full description of our rigorous, AAPOR-standard
  methodology can be found on page 47 of this report and the demographic breakdown of survey
  respondents appears on page 46.
• Pages 4-5: Provides an overview of partisanship of the American electorate in the 2020 cycle and offers
  partisanship with Independent “leaners” sorted into their respective parties.
• Page 6: Provides an overview of the ideological distribution of the 2020 electorate with a new division of
  moderates into “lean conservative” and “lean liberal” categories.
• Page 7: Provides a breakdown of partisanship of the 2020 electorate, by nuanced ideology.
• Pages 8-10: Results of 2020 general election ballot question between President Trump and the Democratic
  Party’s nominee, as well as the vote breakdown by party and by ideology.
• Pages 11-13: Results of 2020 general election ballot question with an Independent candidate included on
  the ballot, as well as vote breakdown party and by ideology.

                                                                                                               2
Summary of Report
       Section 2: Polarization in the 2020 Electorate
• Pages 14-22: Presents data visualizations (word clouds) of voters’ one word, open-end responses to the question, “What is
  the first word that comes to your mind when you hear _____?” Voters were asked to provide answers for the following
  prompts: Congress, the Supreme Court, Republican, and Democrat. Data for Congress and Supreme Court is presented for
  all respondents only. Data for Republican and Democrat are presented for all voters, Democrats on Democrats, Democrats
  on Republicans, Republicans on Republicans, Republicans on Democrats, and pure Independents on both Republicans and
  Democrats.
• Pages 23-25: Presents findings from the question, “Our nation’s major news organizations publish fake news stories for
  political purposes.”
• Pages 26-28: Presents findings from the questions, “Views of Democrats/Republicans threaten the well-being of the
  country.”
• Page 29: Presents findings from the question, “The blame for America’s dysfunctional politics falls as much on my own
  political party, or party I most often vote for or agree with, as the other political party.”
• Pages 30-31: Presents findings from the question, “When I vote, I am very concerned with keeping the other party’s
  candidate from winning.”
• Pages 32-45: Presents findings from a supplemental experimental national survey* that measures Americans’
  responsiveness to partisan cues in terms of their policy preferences.
*Data for this analysis comes from the Wason Center Political Attitudes Experimental Survey. Survey demographics and methodology can be found on pages 48 & 49.   3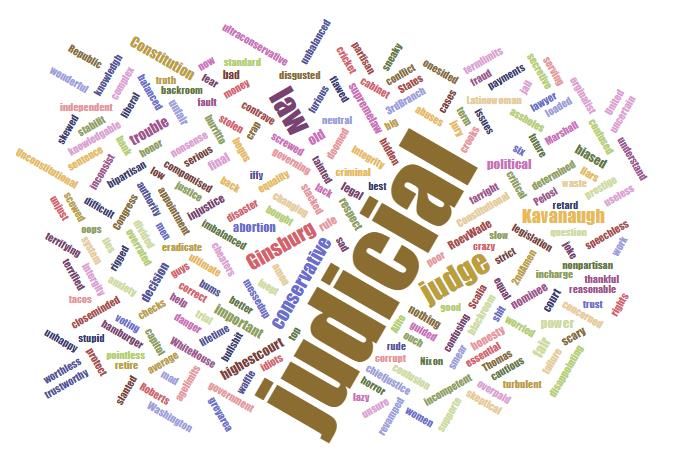
Partisanship of the American Electorate: The
                                                                                                              Traditional View
                                                                                               35                    32

 Partisanship of the 2020 Electorate                                                           30
                                                                                                         30                      29

                                                                                               25

                                                                                  Percentage
                                                                                               20
                                                                                               15
           A durable finding from political science research
                                                                                               10
           is that people who self-identify as “Independent”
                                                                                               5
           but who admit to leaning towards one party or                                                                                       2
                                                                                               0
           the other in a follow up question behave very
                                                                                                     Republican   Democrat   Independent   DK/Refused
           similarly to their partisan counterparts.
           Increasingly, research is treating these
                                                                                                    The "True" Partisanship of the 2020 American
           Independent “leaners” as soft partisans and                                                               Electorate
           distinguishing “pure” Independents from them.                                       50
                                                                                                                     44
                                                                                                         41
           This is important because Independent “leaners”                                     40
           account for the majority of people who fall into

                                                                                  Percentage
           the Independent category and including leaners                                      30

           in the Independent category may create a                                            20
           distorted picture of how fluid the American
                                                                                                                                  9
           electorate really is.                                                               10
                                                                                                                                               2
                                                                                               0
                                                                                                     Republican   Democrat   Independent   DK/Refused
Data from Wason Center for Public Policy National Survey of 2020 Likely Voters.
Includes Independent “leaners.”
                                                                                                                                                    4
If the 2020 presidential election were held today would you
                                                                                                vote for the incumbent president, Republican Donald Trump,
                                                                                                           or for the Democrat running against him?
                                                                                                                    96
       A Partisan by Any Other Name
                                                                                      100
                                                                                             86                                                     Trump
                                                                                       90
                                                                                                                                                                      Democrat
                                                                                       80
                                                                                       70                                                                             Undecided
                                                                                       60                                                                             Will Not Vote

                                                                                  Percent
                                                                                       50                                                                    43       3rd Party
        The vote preferences of Independent “leaners”                                  40
                                                                                                                                               39
                                                                                                                                                                      DK/Refused
        demonstrate how closely these voters mirror the                                30
        preferences of their partisan counterparts, with                               20             12                                            12
                                                                                                  7                        5               5
        the relationship especially strong for Democrats.                              10                      1 0   2              2 0                           1
                                                                                        0
        86% of Republicans and 96% of Democrats                                               Republicans                Democrats        All Independents
        indicate they plan to vote for their respective
        party’s nominees. Although Republican leaners                                           If the 2020 presidential election were held today would you
        are less supportive of Trump (60%) than                                        100     vote for the incumbent president, Republican Donald Trump,
        Democratic leaners are of the Democrat (78%), in                                90                or for the Democrat running against him?
                                                                                                                   78
        general, leaners are indistinguishable from their                               80
                                                                                                                                                                      Trump
        partisan counterparts.                                                          70   60                                                                       Democrat
                                                                                        60

                                                                                  Percent
                                                                                                                                                             44       Undecided
                                                                                        50
                                                                                                                                               39                     Will Not Vote
                                                                                        40            31                                                              3rd Party
                                                                                        30
                                                                                                                           16                                         DK/Refused
                                                                                        20                                                          11
                                                                                        10        3            5                    4      6
                                                                                                           1         1          0                        0
                                                                                         0
                                                                                             Lean Republican         Lean Democrat        Pure Independents
Data from Wason Center for Public Policy National Survey of 2020 Likely Voters.
Includes Independent “leaners.”
                                                                                                                                                                                      5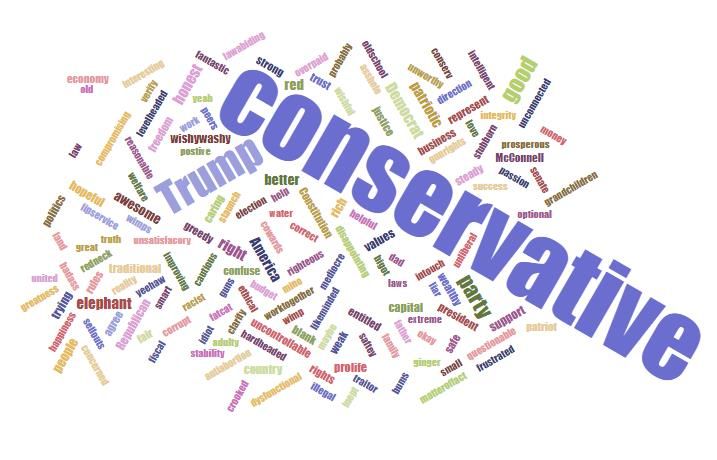
3 Category Ideology of the American
                                                                                                              Electorate
      Ideology of the 2020 Electorate                                                       60
                                                                                                                    51
                                                                                            50

                                                                                            40

                                                                                  Percent
                                                                                                                                      31
                                                                                            30
             Despite the high levels of polarization and
             partisan acrimony in American politics,                                        20         16
             American voters still largely consider                                         10
                                                                                                                                                         1
             themselves ideologically moderate, with 51%                                    0
             of voters describing their ideology this way.                                          Liberal       Moderate        Conservative       DK/Refused
             Digging deeper, moderates are evenly split,
             with about half leaning liberal and half
                                                                                                 Ideology of the American Electorate
             leaning conservative. Similar to previous
                                                                                            30
             studies, “conservative” is a far more robust                                   25
                                                                                                                   25        24
                                                                                                                                        21
             response than its counterpart “liberal.”

                                                                                  Percent
                                                                                            20
             While 21% of voters self-identify as                                           15
                                                                                                              9                                  9
                                                                                            10     7
             conservative, just 9% self-identify as liberal.                                 5
                                                                                                                                                             5

             Just 9% of voters consider themselves to be                                     0
             strong conservatives while just 7% of voters
             consider themselves to be strong liberals.

Data from Wason Center for Public Policy National Survey of 2020 Likely Voters.
Includes Independent “leaners.”
                                                                                                                                                                  6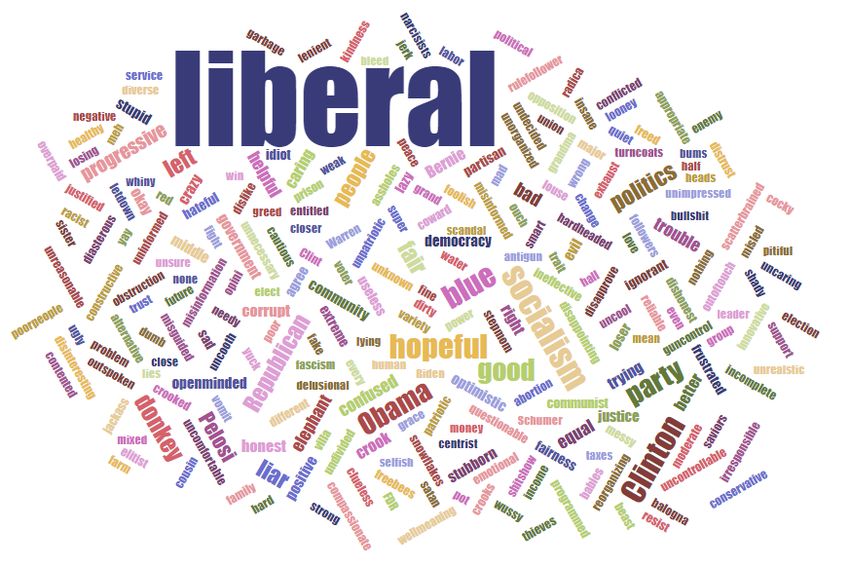
Partisanship by Ideology
        Partisanship & Ideology of the                                                              50

             American Electorate                                                                    45
                                                                                                                                                  46

                                                                                                    40                    39
Another stable finding from survey research are the differences in the ideological                                   36
                                                                                                    35                                                                               34
compositions of the Republican and Democratic Party coalitions. Republican voters
are more ideologically robust, with the modal category for Republicans being
“conservative.” Democrats have always been less liberal, or at least less willing to                30                                                                          28

                                                                                          Percent
think of themselves as liberal. Here, voters who choose the moderate category are
also forced to choose whether they lean towards liberalism or conservatism. As such,                25
for Democrats the modal category in these data contains the word “liberal.”
                                                                                                    20                         19
However, the way ideology is conventionally coded, moderate is not distinguished in                                                                                                       17
                                                                                                                                             16
this way and if you compare these data with other data you will see that the plurality,                                                 15                                                         15
                                                                                                    15
if not majority, of Democrats describe their ideology as “moderate.” One of the most
interesting findings here is that despite being offered a less robust category,                                                                        10
                                                                                                    10                                                      8
Republicans still prefer to describe their ideology as “conservative” although more
Republicans populate the “moderate, lean conservative” category than you might                               4                                                      4                          4
                                                                                                    5
find in other surveys where the moderate category is not structured this way. There                              2                  2                                   2
                                                                                                                                                                1
are three other important findings from this analysis. After lagging for the last two                    0                                                                  0
                                                                                                    0
decades the percent of voters who consider themselves “strong liberals” is beginning
                                                                                                             Republicans                      Democrats                 Pure Independents
to catch up to the percent who identify as “strong conservatives.” Second, although
they continue to decline, 8% of Democrats describe their ideology as “conservative.”                     Strong Liberal                                     Liberal
Finally, most pure Independents identify as moderates with “lean conservative”                           Mod, Lean Liberal                                  Mod, Lean Conservative
outnumbering “lean liberal” by about 7 points.                                                           Conservative                                       Strong Conservative
                                                                                                         DK/Refused
Data from Wason Center for Public Policy National Survey of 2020 Likely Voters.
Includes Independent “leaners.”
                                                                                                                                                                                                        7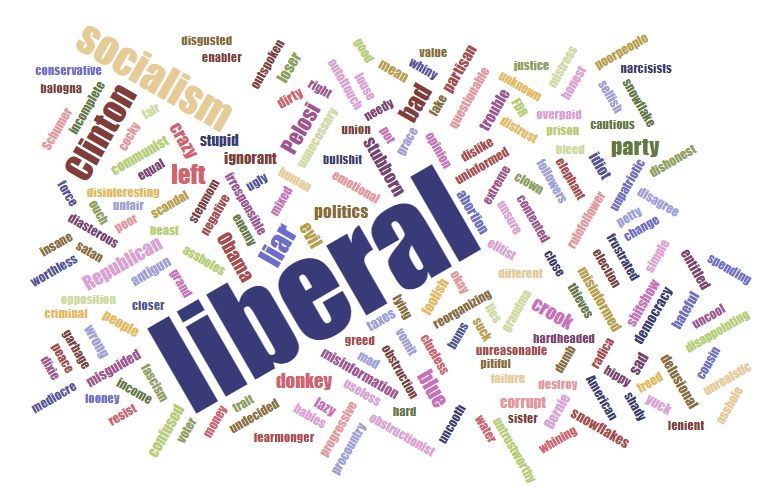
If the 2020 presidential election were held
                                                                                                  today would you vote for the incumbent
                                                                                                     president, Donald Trump, or for the
            The 2020 General Election                                                                  Democrat running against him?
                                                                                            60

     Heading into the Democratic Party’s primary season, President Trump
     is at an 11-point disadvantage against his generic Democratic Party                    50              48
     opponent, a margin well outside the survey’s +/- 3.2 point margin of
     error. More importantly, Trump would need all voters who currently
     report being undecided (10%) to break in his favor in order to close the
     gap. Should he run for reelection, President Trump will do so facing                   40     37
     the most hostile electoral environment an incumbent president has
     faced in the modern era. His predecessors, Barack Obama, George W.

                                                                                  Percent
     Bush, Bill Clinton, George H.W. Bush, and Ronald Reagan began their                    30
     reelection campaigns with better approval ratings, and without the
     complications of scandals. All were reelected except the senior Bush,
     who lost to Bill Clinton despite approval ratings that averaged in the
     mid-50s throughout the election year. Perhaps the closest analogy to                   20
     Trump in terms of approval ratings is Jimmy Carter, whose average
     approval rating for his term was 45%. Carter, of course, lost his
     reelection bid. Trump’s average approval rating for his first 27 months                                          10
                                                                                            10
     in office has ranged between the high 30s and the mid-40s. President
                                                                                                                                             5
     Trump will be the least popular president to run for reelection in the
     history of polling.                                                                                                          0                     0
                                                                                            0
                                                                                                  Trump   Democrat Undecided   Will Not   3rd Party DK/Refused
                                                                                                                                Vote

Data from Wason Center for Public Policy National Survey of 2020 Likely Voters.
Includes Independent “leaners.”
                                                                                                                                                            8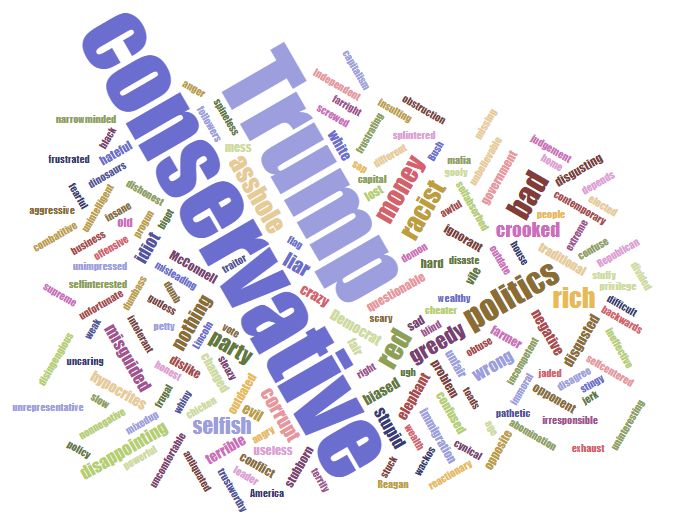
If the 2020 presidential election were held
                                                                                                   today would you vote for the incumbent
                                                                                                 president, Republican Donald Trump, or for
      The 2020 Vote Choice, by Party                                                                  the Democrat running against him?
                                                                                      100
                                                                                                                         91
                                                                                            90
                                                                                                 80
           Driving the 11-point advantage for the Democrats                                 80                                                                     Trump
           on the two-candidate ballot is the nearly                                                                                                               Democrat
                                                                                            70
           universal support for the party’s nominee from
           Democrats as well as a sizable advantage among                                   60                                                                     Undecided
           pure Independents. While Trump is drawing in

                                                                                  Percent
                                                                                                                                                                   Will Not
           just 79% of Republicans (with Independent                                        50
                                                                                                                                                                   Vote
                                                                                                                                                          43
           leaners included), the generic Democrat is                                                                                           39                 3rd Party
                                                                                            40
           receiving 91% of the votes from Democrats (with
           Independent leaners included) as well as 39% of                                  30
           the vote from pure Independents. Interestingly,
           there is robust support for a 3rd party option                                   20
           among pure Independents, suggesting that a                                                     12                                         12
                                                                                            10        7
           significant portion of this voting bloc does not                                                          2
                                                                                                                              5
                                                                                                                                  2
                                                                                                                                            5
                                                                                                               1 0                    0                        1
           support Trump, but isn’t keen on supporting the                                  0
           Democratic Party’s nominee, either.                                                        Repblicans         Democrats        Pure Independents

Data from Wason Center for Public Policy National Survey of 2020 Likely Voters.
Includes Independent “leaners.”
                                                                                                                                                                               9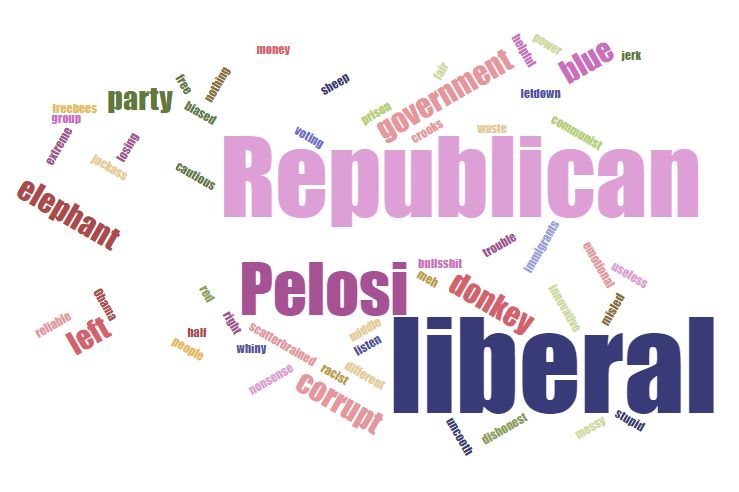
If the 2020 presidential election were held
                                                                                                    today would you vote for the incumbent
                                                                                                  president, Republican Donald Trump, or for
  The 2020 Vote Choice, by Ideology                                                                    the Democrat running against him?
                                                                                                                                                        Trump

                                                                                                                                                        Democrat

           The future Democratic Party nominee enjoys                                                                                                   Undecided
           uniform support among the party’s most                                                                                                       Will Not
           ardent ideological supporters, but President                                                                                                 Vote
           Trump has a small faction of strong                                                     100                                                  3rd Party
                                                                                            100                                              90
           conservatives planning mutiny. 12% of voters                                                  88        88               85
                                                                                             90
           who describe their ideology as strongly                                           80
           conservative intend to vote for the                                               70

                                                                                  Percent
                                                                                             60
           Democratic Party’s nominee in what one can                                        50                            43
           only assume is a protest vote. There are also                                     40
           signs of unrest within the Republican’s                                           30                              26
                                                                                                                            19
           ideological coalition in the moderate, lean                                       20             12
                                                                                                                     6 4
                                                                                                                                  11 12       9
           conservative camp. Although a plurality of                                        10   0 0 0 0        0 1                   2 0        1 0
                                                                                              0
           these voters (42%) intend to vote for Trump,
           19% say they will vote for the Democrat and
           another 26% report being undecided. 12% of
           liberals also report being undecided.

Data from Wason Center for Public Policy National Survey of 2020 Likely Voters.
Includes Independent “leaners.”
                                                                                                                                                                10
And if instead the choices were the
The 2020 General Election with an incumbent president, Republican Donald
Trump, the Democratic Party’s nominee, or a
Independent candidate running on an Independent ticket
for whom would you vote?
60
Although the Democratic Party’s nominee 50
holds a large advantage over President Trump
in a two-person contest, the introduction of an
Independent candidate completely reshapes 40
the race, making it far more competitive for 34
33
President Trump. This is a product of two
Percent
things. First, for every one voter that moves 30
their vote choice away from Trump to the
Independent candidate, five move their vote
away from the Democratic Party’s nominee to 20
16 16
the Independent. Overall, the Independent
candidate earns support from 16% of voters,
and increases the number of undecided voters 10
considerably, from 10% on the two-candidate
ballot to 16% with an Independent in the race. 0 1
0
Trump Democrat Independent Undecided 3rd Party DK/Refused
Data from Wason Center for Public Policy National Survey of 2020 Likely Voters.
Includes Independent “leaners.”
11And if instead the choices were an
Defection to the Independent, by incumbent president, Republican Donald
Trump, the Democratic Party’s nominee, or a
Party candidate running on an Independent ticket
for whom would you vote?
100
90
Defection to the Independent candidate comes
Trump
primarily from Democrats and pure Independents. 80
74
On the two-person ballot question, 39% of pure Democrat
Independents broke for the Democratic Party’s 70 65 Independent
candidate compared to just 5% for President
Trump. 12% of voters were undecided and 44% of 60 Undecided
Percent
voters chose the “third party” option. The Will Not Vote
50
introduction of an Independent candidate reveals 42 3rd Party
that almost all of the robust support for the third 40
party preference on the first ballot question is DK/Refused
actually for an Independent third party. With an 30 27
25
Independent candidate as a distinct option, 42% of 21
pure Independents choose the Independent 20 16
candidate and the third party option drops to 0%. 11
The introduction of an Independent candidate 10 7
5
option also increases the number of pure 1 11 2 21
01
Independents who are undecided (27%). 0
Republicans Democrats Pure
Independents
Data from Wason Center for Public Policy National Survey of 2020 Likely Voters.
Includes Independent “leaners.”
12And if instead the choices were an
Defection to the Independent, by incumbent president, Republican Donald
Trump, the Democratic party’s nominee, or a
Ideology candidate running on an Independent ticket
for whom would you vote?
100
Although moderates are the most likely voter group to support an 88
Independent candidate, the Independent candidate draws support 90
from across the spectrum, which may reflect the undefined nature of 80 75
78 Trump
the question’s phrasing. The modal category for support for the
Independent is moderates who lean conservative. 28% of these voters 70 65 Democrat
62
chose the Independent and an equal percentage report being 60 Independent
undecided in this scenario. Interestingly, an Independent candidate
Percent
receives significant support across all three liberal categories, 50 Undecided
including strong liberals. This illustrates why the electoral picture for 37
40 Will Not
Democrats changes significantly when an Independent candidate is
added to the ballot. 15% of strong liberals report they would support 28
28 Vote
30 3rd Party
the Independent, compared to 22% of liberals and 19% of moderate, 22
19
17
lean liberal voters. These numbers suggest the Democrats may be 20 16
13
9 10
vulnerable at both ends of their ideological spectrum. Choose a 10 7 6
nominee who is too far to the left, and moderates and liberals may be 11 35 4 24 00
0 00 0 00 0 00 0
susceptible to an Independent candidate; but choose a candidate that 0
is too centrist, and progressive Democrats may find themselves
looking for an alternative. Conversely, ideological conservatives are
far less receptive to an Independent candidate. Conservative is the
modal ideological category for Republican voters.
Data from Wason Center for Public Policy National Survey of 2020 Likely Voters.
Includes Independent “leaners.”
13What Word?
Voters were asked for the first word that popped into their heads for Democrats, Republicans, and Congress.
The Congress word cloud clearly reflects the
frustration Americans have been expressing with
Congress in surveys over the polarized era. Voters use
a variety of different descriptors: dysfunctional,
ineffective, useless, corrupt, lazy, incompetent, to
describe the same thing, a broken Congress.
The most common word used is dysfunctional,
appearing 33 times. All told, 61% of the words used
by voters about Congress are negative.
CONGRESS
Data from Wason Center for Public Policy National Survey of 2020 Likely Voters.
Includes Independent “leaners.” 14What Word?
Voters were asked for the first word that popped into their heads for Democrats, Republicans, and Congress.
Voters clearly associate Democrats with liberalism.
The word liberal is by far the most dominant word in
their word cloud. Voters also associate the word
Democrat with Obama and Clinton in nearly equal
measure. Socialism, which is typically an attack word
in American politics, is the most frequently
mentioned negative term.
2020 VOTERS ON
DEMOCRATS
Data from Wason Center for Public Policy National Survey of 2020 Likely Voters.
Includes Independent “leaners.” 15What Word?
Voters were asked for the first word that popped into their heads for Democrats, Republicans, and Congress.
The word cloud created with words Democrats use to describe themselves is clearly distinguishable from the word cloud made with words from
Republican voters, although “liberal” is prominent in both. Unlike the word cloud from Republicans describing themselves, Democrats use a
variety of words to describe themselves including two different terms to describe ideology: liberal and progressive. Clinton, socialism, liar, and
liberal are dominant in the word cloud made from Republicans describing Democrats.
DEMOCRATS ON
DEMOCRATS REPUBLICANS ON
Data from Wason Center for Public Policy National Survey of 2020 Likely Voters. Includes Independent “leaners.”
DEMOCRATS 16What Word?
Voters were asked for the first word that popped into their heads for Democrats, Republicans, and Congress.
Pure Independents use a vocabulary all their own to
describe Democrats. Yes, liberal makes an
appearance, but it is not the dominant word. Instead,
pure Independents rely on the opposite term,
Republican, when prompted with the word
Democrat. Pure Independents are also more likely to
associate Democrats with their Speaker of the House,
Nancy Pelosi, than with Clinton or Obama.
PURE INDEPENDENTS ON
DEMOCRATS
Data from Wason Center for Public Policy National Survey of 2020 Likely Voters.
Includes Independent “leaners.” 17What Word?
Voters were asked for the first word that popped into their heads for Democrats, Republicans, and Congress.
The Republican word cloud shows that voters
identify the word Republican both with the party’s
ideology, conservatism, and with Donald Trump.
Combined, these two responses make up more than a
third of all responses.
2020 VOTERS ON
REPUBLICANS
Data from Wason Center for Public Policy National Survey of 2020 Likely Voters.
Includes Independent “leaners.” 18What Word?
Voters were asked for the first word that popped into their heads for Democrats, Republicans, and Congress.
Although Trump is a popular response among
Republicans, Republicans clearly associate
conservative ideology most closely with their party.
REPUBLICANS ON
REPUBLICANS
Data from Wason Center for Public Policy National Survey of 2020 Likely Voters.
Includes Independent “leaners.” 19What Word?
Voters were asked for the first word that popped into their heads for Democrats, Republicans, and Congress.
Although Trump and conservative are the most
common words associated with the word Republican
by Democrats, Democrats rely on a variety of
negative words such as racist, bad, and greedy.
Others are merely descriptive such as “red,” the
party’s electoral map color, or politics.
DEMOCRATS ON
REPUBLICANS
Data from Wason Center for Public Policy National Survey of 2020 Likely Voters.
Includes Independent “leaners.” 20What Word?
Voters were asked for the first word that popped into their heads for Democrats, Republicans, and Congress.
Like their Republican and Democratic counterparts,
pure Independents strongly associate Republicans
with conservatism and with Donald Trump. Again,
pure Independents rely on the opposite when
prompted with the word Republican, returning with
Democrat. The word racist is the most frequently
used negative word.
PURE INDEPENDENTS ON
REPUBLICANS
Data from Wason Center for Public Policy National Survey of 2020 Likely Voters.
Includes Independent “leaners.” 21What Word?
Voters were asked for the first word that popped into their heads for Democrats, Republicans, and Congress.
The most frequently used word to describe the
Supreme Court describes the Court’s position as the
judicial branch in the separation of powers system.
236 voters responded with this word for the Supreme
Court prompt, about a fourth of the voters. Law and
judge were also common.
Because of the proximity of the survey to the
Kavanaugh confirmation hearing the previous fall,
Justice Kavanaugh was used 24 times and Justice
Ginsburg was mentioned by 29 voters. Ginsburg has
been featured in both a Hollywood movie based on
her life and a popular Netflix documentary this year.
2020 VOTERS ON THE
SUPREME COURT
Data from Wason Center for Public Policy National Survey of 2020 Likely Voters.
Includes Independent “leaners.” 22Our nation’s major news organizations
publish fake news stories for political
purposes
“The Enemy of the People” 100
President Trump’s rhetoric regarding the media appears to be having a
80
massive impact on voter confidence in the media. Here we ask voters to agree
or disagree with the following statement :“Our nation’s major news
organizations publish fake news stories for political purposes.” We were quite
intentional about the wording. We wanted to be sure respondents understood 60 57
we were talking about large, traditional media sources like our nation’s major
Percent
newspapers and not blogs or “fringe” sources. And we wanted to test the belief
44
that the publication of “fake news” was done for a reason, specifically for a
political reason. Our belief was that other survey research on this topic may 40
have been worded too ambiguously. Although it is common for presidents to
have contentious, even combative relationships with the press, President
Trump’s treatment of the press and his criticisms of the press go far beyond
20
the types of complaints leveled by his predecessors. Our analysis reveals that
President Trump’s “war on the press” appears to be working. 57% of
respondents “agree” that our nation’s major news outlets are publishing fake
news stories for political purposes. Although confidence in media has been 0
declining for the past few decades, this represents a sharp decline in trust, Disagree Agree
which carries serious implications.
Using the 0-10 scale where 0 means you strongly disagree and 10 means you strongly agree
please indicate how much you agree or disagree with the following statement: Our nation’s
major news organizations publish fake news stories for political purposes
0-5 coded as “Disagree”, 6-10 coded as “Agree”
Data from Wason Center for Public Policy National Survey of 2020 Likely Voters.
Includes Independent “leaners.”
23Our nation’s major news organizations
publish fake news stories for political
“A Crisis of Confidence” 100
purposes
80
Our media question was structured to
also measure the strength at which voters
agreed or disagreed with the statement.
This graph reflects the distribution of 60
Percent
answers. All told, 27% of voters rated the
statement, “Our nation’s major news
organizations publish fake news stories 40
for political purposes” with a 10 out of 10
28
(indicating the strongest possible
agreement). Just 11% rated it 0 out of 10
20
(the strongest possible disagreement), 11
13
11
just more than a third of voters at the 9
5 6 6
4 4
other end of the spectrum. 3
0
0 1 2 3 4 5 6 7 8 9 10
Distribution of Responses: 0 indicates voter strongly disagrees with the statement and 10
means voter strongly agrees with the statement
Data from Wason Center for Public Policy National Survey of 2020 Likely Voters.
Includes Independent “leaners.”
24“A Crisis of Confidence”
The crisis of confidence in the media is largely being driven by Republicans, the voting group specifically targeted by President Trump’s
anti-press messaging. An astounding 86% of Republicans fall into the “agree” category, with 45% of Republicans rating the statement with a
10 out of 10. However, pure Independents also seem to be affected by Trump’s “fake news” attacks. 63% of pure Independents believe major
American news organizations publish fake news stories for political purposes. And although nearly 70% of Democrats disagree with the
statement, even 31% of Democrats believe the nation’s major news organizations publish fake news stories for political purposes.
Our nation’s major news organizations publish fake news stories for political purposes
Republicans Democrats Pure Independents
14% 31% 37%
69% 63%
86%
Disagree Agree Disagree Agree Disagree Agree
Using the 0-10 scale where 0 means you strongly disagree and 10 means you strongly agree please indicate how much you agree
or disagree with the following statement: Our nation’s major news organizations publish fake news stories for political purposes
0-5 coded as “Disagree”, 6-10 coded as “Agree”
Data from Wason Center for Public Policy National Survey of 2020 Likely Voters. Includes Independent “leaners.”
257 out of 10
Republicans believe Democrats threaten the well-being of America
President Trump’s inflammatory rhetoric about the media is not his only rhetoric that presents a sharp departure from the behavior of his predecessors. Trump’s criticisms of
Democrats, the FBI, the Justice Department, and others are unprecedented and are amplified both in terms of scope and legitimacy by his role as president of the United States.
Our analysis finds this is having a major impact on partisan animosity, particularly among Republican voters. Pew Research Center’s Political Polarization in the American Public
report found that in 2014, 27% of Democrats and 36% of Republicans believed their political counterparts presented a threat to the well-being of the country. Just 5 years later, in
our survey, these numbers have doubled for both parties, reaching catastrophic levels among Republican voters. Heading into the 2020 election, 7 out of 10 Republican voters
believe that the views of Democrats threaten the well-being of the country, up 35 points since Pew’s study.
Percent of Republicans Who Agree Percent of Democrats Who Agree Views of
Views of Democrats Threaten the Well- Republicans Threaten the Well-Being of the
Being of the Country Country
29%
45%
55%
71%
Views of Democrats Are Not Dangerous Views of Republicans Are Not Dangerous
Views of Democrats Are Dangerous Views of Republicans Are Dangerous
26
Data from Wason Center for Public Policy National Survey of 2020 Likely Voters.
Includes Independent “leaners.”Views of Democrats Threaten the Well-Being
Views of Democrats Threaten the of the Country, by Party
Well-Being of the Country, by Party 35
31
33
30
28
27
25
31% of Republicans chose the response
category 10, indicating the strongest level
of agreement with the statement that the 20
views of Democrats threaten the well- 18 18
Percent
being of the country. Also notable is how 16
Republicans score on the “no threat” end 15
13 13
of the scale. Just 2% of Republicans 12
chose 0, to indicate that they strongly 10
11 11
10
disagreed that the views of Democrats 10
threatened the well-being of the country; 7 7
6
cumulatively, just 29% of Republicans
5 4 4
score a 5 or below. Another interesting 3 3 3 3
2 2 2 2
finding is how self-critical Democrats are. 1 1 1 1
0.3
Just 29% score themselves as 0. 0
0
Independents are more generous, with Republican Democrat Independent
32% scoring Democrats with a 0.
0 1 2 3 4 5 6 7 8 9 10
Where 0 indicates voter strongly disagrees with the statement and 10 means voter strongly
agrees with the statement
Data from Wason Center for Public Policy National Survey of 2020 Likely Voters.
Includes Independent “leaners.”
27Views of Republicans Threaten the Well-
Views of Republicans Threaten the Being of the Country, by Party
Well-Being of the Country, by Party 35
33
30
27
26
25
34% of Republicans chose 0 to indicate
the strongest disagreement with the 21 21
statement that “views of Republicans 20 19
threaten the well-being of the country.” 18
Percent
Few strongly agree with the statement.
Just 2% choose 10. There are 15 14
13
significantly fewer Democrats who 12
strongly agree that Republicans’ views 11
10
are a threat (21%) than there are 10 9
8
Republicans who strongly agree that 6
Democrats’ views are a threat (31%). 5
5 4 4 44
Again, the modal category for 3 3 3 3 3
2 2 2 2
Independents is 0 but while low, 8% of 1 11
0.2
Independents chose 10 for Republicans 0
compared to 4% who chose 10 for Republican Democrat Independent
Democrats.
0 1 2 3 4 5 6 7 8 9 10
Where 0 indicates voter strongly disagrees with the statement and 10 means voter strongly
agrees with the statement
Data from Wason Center for Public Policy National Survey of 2020 Likely Voters.
Includes Independent “leaners.”
28The blame for America’s dysfunctional
politics falls as much on my own political
Not In My Party! party, or party I most often vote for or agree
with, as the other political party
35
30 29
The good news is that a plurality of voters
are willing to accept shared blame for 25
America’s political dysfunction on behalf
of their own political party, and
20
combined, a clear majority of voters are
Percent
17
at least willing to entertain that their own
party bears some responsibility. In fact, 15
70% of voters fall between a 5 and 10 on
the scale. Considering a choice of 0-3 to 10
8 8
9
indicate a belief that one’s own party is 6
7
“blameless” for our political dysfunction, 5 4
5
4
5
the partisan breakdown of the voters who
hold their party “blameless” is 18%
0
Republican, 12% Democrat, and 21%
0 1 2 3 4 5 6 7 8 9 10
pure Independent.
Where 0 indicates voter strongly disagrees with the statement and 10 means voter strongly
agrees with the statement
Data from Wason Center for Public Policy National Survey of 2020 Likely Voters.
Includes Independent “leaners.”
29When I vote, I am very concerned with
keeping the other party’s candidate from
Negative Voting
winning
50
45
40
Negative voting refers to the concept that in
the polarized era, voters will ignore policy, 35
ideology, or even personal shortcomings in
their own party’s nominee in order to keep 30
the seat in question out of the hands of the
Percent
opposition party. For example, in the 2017 25
U.S. Senate election in Alabama, Republican
20 19
nominee Roy Moore received 90% of the 18
votes of Republican voters despite credible 14
15
allegations that he had molested young
11
women. We wanted to get a sense of how
10 8
self-aware voters are about negative voting, 6
7
with the expectation that many voters would 5
5 5
4
3
most likely not think of their vote decisions
in this way (despite what recent electoral 0
data might tell us). 0 1 2 3 4 5 6 7 8 9 10
Where 0 indicates voter strongly disagrees with the statement and 10 means voter strongly
agrees with the statement
Data from Wason Center for Public Policy National Survey of 2020 Likely Voters.
Includes Independent “leaners.”
30When I vote, I am very concerned with
keeping the other party’s candidate from
winning
Negative Voting, by Party 100
89
90
80
Finally, something Republicans and Democrats
agree on! Both Republican and Democratic 70
voters agree it’s important to keep the other
party’s candidate from winning. 55% of 60 55
53
Republicans and 53% of Democrats fall into the
Percent
47
“yes” category, compared to 45% of Republicans 50 45
and 47% of Democrats in the ‘no” category.
These differences are statistically 40
indistinguishable. The voting behavior of pure
30
Independents especially stands out here. 89% of
pure Independents fall into the “no” category.
20
This suggests that for this distinct category of
voters, election campaigns may remain a contest 11
10
of principles and ideas. For everyone else,
elections are as much about keeping the other
0
side from winning power as they are about Republicans Democrats Independents
anything else.
0-5 are coded as “No”, 6-10 are coded as “Yes”
Data from Wason Center for Public Policy National Survey of 2020 Likely Voters.
Includes Independent “leaners.”
31It’s Not the Message,
It’s the Messenger
A major tenet of democratic theory is that elected officials are responsive to the views of
constituents. That is supposed to come from the bottom-up; the public pressures politicians to be
responsive to their policy preferences in order to earn their votes. Polarization has changed this
equation, making voter responses to policy a referendum on the person or party proposing the
policy, not on the merits of the policy itself. Polarization is causing voters to respond not to
policies being proposed, but instead to the politicians proposing the policies. This graph reflects
the results of an experimental survey used to measure the power of partisan cues on public
opinion preferences among partisans. The idea for the project comes from watching the 2016
Republican National Convention, in which Ivanka Trump proposed paid family leave during her
convention speech, a proposal long opposed by the Republican Party. Rather than drawing boos
from the deeply ideologically conservative crowd, Ms. Trump’s proposal was met with
enthusiastic applause. We wanted to see if we could move partisans completely away from party
positions on issues simply by ascribing the policy proposal to their own party. We wanted to use
a blunt measurement. Rather than testing changes in the degree of support for a policy, we
wanted to see if we could actually flip support.
The policy proposal of a CO2 emissions trading system (“Cap and Trade”) was proposed by
Democrats in Congress after they took control of both chambers in the 2006 midterms.
Republican backlash to the proposal partially led to the emergence of climate denialism and later
to the Tea Party. When told that a CO2 emissions trading system is proposed by “Some People,”
which serves as the baseline or the control category, 50% of Republican respondents support the
policy. However, when the proposal is ascribed to Democrats in Congress, support among
Republicans declines by 9 points. When Republican voters are told that Republicans in Congress
propose a CO2 emissions trading system , support jumps by 16 points to 66%. And when told
President Trump proposes the policy, support among Republican voters skyrockets to o 88% -- a
38-point increase from the baseline.
Data from Wason Center for Public Policy National Survey of 2020 Likely Voters.
Includes Independent “leaners.” 32It’s Not the Message,
It’s the Messenger
Although less responsive to partisan cues than their Republican
counterparts, Democrats also shift their support when partisan
cues change. All told, we tested 7 policies for evidence that partisan
cues significantly shift preferences on policies among partisans. The
topics included in our test are carbon dioxide emissions trading, the
elimination of the alternative minimum tax, paid family leave,
equal pay for equal work legislation, education vouchers, a vague
statement about support of expansionary fiscal policy, and one non-
partisan issue, making Grandparents Day a federal holiday.
Support for a CO2 emissions trading system among Democrats
increases dramatically when Democrats are told that their
Democratic Party allies in Congress propose the policy, increasing
20 points from the baseline percent of 69% to 89%.
Data from Wason Center for Public Policy National Survey of 2020 Likely Voters.
Includes Independent “leaners.”
33It’s Not the Message,
It’s the Messenger
Education vouchers have long been a
popular reform among Republicans but
when Republican voters are told that
Republicans in Congress propose them,
support increases by 8 points over the
baseline level of support. When
Republicans are told President Trump
proposes them, support increases by 18
points over the baseline. On every issue
tested, Republicans respond more
favorably to the President Trump prompt
than to the Republicans in Congress
prompt, suggesting that Republicans
trust their party’s president more than
their party’s congressional leaders.
Data from Wason Center for Public Policy National Survey of 2020 Likely Voters.
Includes Independent “leaners.”
34_____ proposes state-funded scholarships,
It’s Not the Message, also known as education vouchers, to give
children attending public schools the option
It’s the Messenger to attend private schools. Do you support or
oppose this proposal?
Some People 61
For Democrats, vouchers have always been a
lightning rod issue. The teachers’ unions
oppose them, and Democratic politicians are
often opposed to them, arguing that they
weaken public schools. Despite this, 61% of Democrats 69
Democrats in the control group support
vouchers, and when Democrats in Congress
are said to support them, support increases
by 8 points to 69%. But Democrats increase Republicans 67
their support almost as much when the
voucher proposal is ascribed to Republicans
in Congress (a 7 point increase, to 67%).
Attribution to President Trump causes a 9 Trump 52
point drop in support among Democrats,
moving to 52%.
0 10 20 30 40 50 60 70 80 90 100
% Democrats who support the proposal
Data from Wason Center for Public Policy National Survey of 2020 Likely Voters.
Includes Independent “leaners.”
35It’s Not the Message,
It’s the Messenger
One might think that “equal pay for equal
work” is recognizable Democratic Party
rhetoric. But it resonates well with
Republicans. Regardless of the prompt --
Republicans, Democrats, or Some People
-- on average 80% of Republicans
support this policy. However, when the
policy proposal is ascribed to President
Trump, support among Republicans is
nearly universal, coming in at 98%.
Data from Wason Center for Public Policy National Survey of 2020 Likely Voters.
Includes Independent “leaners.”
36It’s Not the Message,
It’s the Messenger
Democrats support an “equal pay for equal
work” policy, and they’ll take it from anyone,
even from President Trump. There is a slight
decline in support for the policy when it is
offered by Republicans in Congress (4 points
lower than the baseline category), but the
difference is not statistically significant.
Data from Wason Center for Public Policy National Survey of 2020 Likely Voters.
Includes Independent “leaners.”
37It’s Not the Message,
It’s the Messenger
The Republican Party’s history with federal
family leave policy has been rocky. The
Family and Medical Leave Act of 1993
passed during the Clinton Administration
was modest, securing 12 weeks of unpaid
leave and making it illegal for employers to
fire women for having a baby. Most
Republicans voted against the bill. The
baseline among Republican voters in this
survey for paid family leave is just 47%. The
2-point drop when the policy is ascribed to
Democrats is statistically insignificant.
However, attributing the proposal to
Republicans in Congress or to President
Trump results in about a 14-point increase
in support from Republican voters, moving
to about 61% from the baseline of 47%.
Data from Wason Center for Public Policy National Survey of 2020 Likely Voters.
Includes Independent “leaners.”
38It’s Not the Message,
It’s the Messenger
It is interesting that the baseline support for
paid family leave is only 47%, and support
skyrockets to 79%, a 32 point increase, when
the policy proposal is attributed to Democrats
in Congress. And although support increases
over the baseline when the policy is attributed
to both Republicans and to President Trump, it
is about 18 points lower than it is when
Democrats believe their own party is proposing
the policy.
Data from Wason Center for Public Policy National Survey of 2020 Likely Voters.
Includes Independent “leaners.”
39It’s Not the Message,
It’s the Messenger
Public opinion data consistently shows that
Americans are conservative in principle and
more liberal in terms of policy specifics. This
question is meant to touch on a broader,
more philosophical policy. As we suspected,
the less-concrete question produced strong
effects. The baseline, Some People, shows
support from 60% of Republicans. Support
drops by 20 points among Republicans when
the proposal comes from Democrats in
Congress. It increases by 14 points to 74%
when ascribed to Republicans in Congress
and by 22 points to 82% when it comes from
President Trump. When the same idea
comes from Democrats in Congress versus
President Trump, the spread is more than 40
points.
Data from Wason Center for Public Policy National Survey of 2020 Likely Voters.
Includes Independent “leaners.”
40It’s Not the Message,
It’s the Messenger
Democrats also show a strong response to
partisan cues on the philosophical question
about fiscal policy. The baseline support
from Democratic voters is 56% and increases
by 9 points to 64% when they are told that
Democrats in Congress propose the policy.
Support among Democrats declines
considerably when the proposal is attributed
to Republicans in Congress (47%) and to
President Trump (41%), declines of 9 and 15
points, respectively.
Data from Wason Center for Public Policy National Survey of 2020 Likely Voters.
Includes Independent “leaners.”
41It’s Not the Message,
It’s the Messenger
Voters are more likely to rely on cues, such as
partisan cues, when they are faced with a
complex policy choice. Eliminating the
alternative minimum tax is an obscure income
tax proposal long championed by Republicans,
which most Americans are not likely to know
much about, even Republican voters. Despite
the use of the phrase “tax reform,” Republican
voters were deeply skeptical when told
eliminating the alternative minimum tax was
proposed by Democrats in Congress. Support
declines by 32 points among Republicans when
they are told that Democrats propose the
policy.
Data from Wason Center for Public Policy National Survey of 2020 Likely Voters.
Includes Independent “leaners.”
42It’s Not the Message,
It’s the Messenger
Democratic voters appear generally wary
of the proposal to repeal the alternative
minimum tax, whether the proposal is
from their own party, from Republicans
or from “Some People.” But even
lukewarm support for the proposal turns
cold when it comes from President
Trump. The baseline for Democratic
voters is 33%, and their support stays
relatively flat when the proposal is
ascribed to either Democrats or
Republicans in Congress. However,
support collapses to just 12% when
Democratic voters are told it’s President
Trump’s proposal.
Data from Wason Center for Public Policy National Survey of 2020 Likely Voters.
Includes Independent “leaners.”
43It’s Not the Message,
It’s the Messenger
No matter how obscure, eliminating the alternative
minimum tax is still a political issue, which carries with
it embedded political baggage and partisan associations.
In order to determine whether partisan cues impact
policy preferences even for non-political issues, we
polled respondents about something we hoped would be
truly non-partisan: making Grandparents Day a federal
holiday. We find that no issue, no matter how far
removed from the political arena, is safe from the power
of partisan cues. First, Republican voters are generally
unreceptive to making Grandparents Day a federal
holiday; just 36% support this proposal at the baseline.
Ascribing the proposal to Democrats makes little
difference. However, when Republican voters are told
Republicans in Congress wish to make it a holiday,
support increases to 47%, an 11-point jump. And when
President Trump proposes it? Republican support soars,
increasing to 59% (+23 points).
Data from Wason Center for Public Policy National Survey of 2020 Likely Voters.
Includes Independent “leaners.”
44It’s Not the Message,
It’s the Messenger
Overall, Democratic voters are more
receptive to making Grandparents Day a
federal holiday than their Republican
counterparts. As were Republicans, they
are much more supportive when the
policy is proposed by their own party.
Support among Democrats increases to
61% from the baseline of 49%, a 12-point
increase. Support from the baseline is
largely unchanged when the policy is
proposed by Republicans in Congress or
by President Trump.
Data from Wason Center for Public Policy National Survey of 2020 Likely Voters.
Includes Independent “leaners.”
45Wason Center 2020 Likely Voter Survey
Demographics
Education Party Lean Ideology Income Party ID
College 41 Republican 41 Republican 31
Strong Liberal 7 Under $25,000 8
Non-College 59 Democrat 34
Democratic 46 $25-$49,999 11
Hispanic
Liberal 9 Independent 28
Yes 5 Pure 13
$50-$74,999 13
Independent No Preference 5
No 95 Moderate, 25 (vol)
Religion leaning liberal
Race $75-$99,999 15
Other Party 1
White 72 (vol)
Christian 70 $100,000- 19
Black or African 12 Moderate, 24 $149,999
American leaning DK/Ref 1
Jewish 5
conservative Over $150,000 22 Region
Other 16
Muslim 1
Age DK/Ref (vol) 12 NorthEast 17
Other 2 Conservative 21
18-24 10
South 32
25-34 11 Strong 9 Sex (interviewer coded)
Conservative
No Preference 21 Midwest 21
35-44 15 Male 48
45-54 25 DK/Ref 5 West 30
DK/Ref 1 Female 52
55 & Older 39
46Wason Center 2020 Likely Voter Survey
Methodology
The results of this poll are based on 1,001 interviews of likely voters randomly selected from the national voter
file via a registered sampling vendor, including 331 on landline and 670 on cell phone, conducted February 3-
17, 2019. Percentages may not equal 100 due to rounding. The margin of error for the whole survey is +/- 3.2
at the 95% level of confidence. This means that if 50% of respondents indicate a topline view on an
issue, we can be 95% confident that the population’s view on that issue is somewhere between
46.8% and 53.2%. The margin of error is higher for subgroups. All error margins have been adjusted to
account for the survey’s design effect, which is 1.1 in this survey. The design effect is a factor representing the
survey’s deviation from a simple random sample, and takes into account decreases in precision due to sample
design and weighting procedures. Subsamples have a higher margin of error. In addition to sampling error,
the other potential sources of error include non-response, question wording, and interviewer error. The
response rate (AAPOR RRI Standard Definition) for the survey was 17%. Five callbacks were employed in the
fielding process. Live calling was conducted by trained interviewers at the Wason Center for Public Policy
Survey Research Lab at Christopher Newport University. The data reported here are weighted using an
iterative weighting process on age, race, sex, education, region, and population density to reflect as closely as
possible the population of registered voters in the United States as anticipated for the 2020 election.
47Wason Center Political Attitudes
Experimental Survey Demographics
Education Party Lean Ideology Income Party ID
College 29 Republican 30 Republican 23
Strong Liberal 7 Under $25,000 16
Non-College 71 Democratic 37 Democrat 30
$25-$49,999 21
Hispanic
Pure 26 Liberal 13 Independent 41
Yes 18 Independent $50-$74,999 17
Moderate, 21 No Preference 3
No 82 DK/Ref 7
leaning liberal (vol)
Race $75-$99,999 14
Religion Other Party 1
White 64
(vol)
$100,000- 13
Black or African 13 Moderate, 20
$149,999
American Christian 68 leaning DK/Ref 2
conservative Over $150,000 10
Other 23 Jewish 6 Region
Age Muslim 1 Conservative 19 DK/Ref (vol) 9 NorthEast 17
18-24 13 Other 1 Strong 11 South 32
25-34 18 Conservative Sex (interviewer coded)
Midwest 21
35-44 36 No Preference 22 Male 48
DK/Ref 9
45-54 16 West 30
DK/Ref 1 Female 52
55 & Older 17
48Wason Center Political Attitudes
Experimental Survey Methodology
The results of this poll are based on 1,280 interviews of Americans over the age of 18 randomly selected via
random digit dialing (RDD) from a sample file purchased from a registered sampling vendor. 896 of the
respondents were contacted on a phone number from a cell phone list and 384 on a landline. The interviews were
conducted in March of 2017. Percentages may not equal 100 due to rounding. The margin of error for the whole
survey is +/- 3 at the 95% level of confidence. This means that if 50% of respondents indicate a topline view
on an issue, we can be 95% confident that the population’s view on that issue is somewhere between 47%
and 53%. The margin of error is higher for subgroups. All error margins have been adjusted to account for the
survey’s design effect, which is 1 in this survey. The design effect is a factor representing the survey’s deviation
from a simple random sample, and takes into account decreases in precision due to sample design and weighting
procedures. Subsamples have a higher margin of error. In addition to sampling error, the other potential sources of
error include non-response, question wording, and interviewer error. The response rate (AAPOR RRI Standard
Definition) for the survey was 19%. Five callbacks were employed in the fielding process. Live calling was
conducted by trained interviewers at the Wason Center for Public Policy Survey Research Lab at Christopher
Newport University. The data reported here are weighted using an iterative weighting process on age, race, sex,
region, and population density to reflect as closely as possible the population of adults in the United States.
49Dr. Rachel Bitecofer assistant director o: 757-594-8997, c: 541-729-9824 rachel.bitecofer@cnu.edu Dr. Quentin Kidd director o: 757-594-8499, c: 757-775-6932 qkidd@cnu.edu
You can also read