BIG DATA ANALYTICS-APPLICATION OF ARTIFICIAL NEURAL NETWORK IN FORECASTING STOCK PRICE TRENDS IN INDIA
←
→
Page content transcription
If your browser does not render page correctly, please read the page content below
Academy of Accounting and Financial Studies Journal                        Volume 22, Issue 3, 2018

      BIG DATA ANALYTICS-APPLICATION OF
  ARTIFICIAL NEURAL NETWORK IN FORECASTING
          STOCK PRICE TRENDS IN INDIA
                        Marxia Oli. Sigo, Bharathidasan University
                      Murugesan Selvam, Bharathidasan University
                   Balasundram Maniam, Sam Houston State University
                         Desti Kannaiah, James Cook University
                    Chinnadurai Kathiravan, Bharathidasan University
                    Thanikachalam Vadivel, Bharathidasan University
                                                      ABSTRACT

        The world has become data driven, which highly accentuated the utilization of
information technology. The movements of stock markets are influenced, by both the micro as
well as macro economic variables including the legal framework and taxation policies of the
respective economies. The crux of the issue lies in exactly forecasting the future stock price
movements of individual firms and stock indices, based on historical past prices. The accuracy,
in forecasting the market trend, has become difficult due to the prevalence of stochastic
behaviour and volatility in the stock prices and index movements. This paper analyses the non-
linear movement pattern of the most volatile, top three stocks in terms of market capitalization,
listed in the Bombay Stock Exchange (BSE) in India, namely Reliance Industries Limited (RIL),
Tata Consultancy Services (TCS) Limited and HDFC Bank Limited, using the Artificial Neural
Network (ANN) for the study period from 2008 to 2017. The findings of the study would help the
investors, to make rational, well informed investment decisions, to optimize the stock returns by
investing in the most valuable stocks.

Keywords: Artificial Neural Network, Behavioural Finance, Big Data, Machine Learning,
Predictive Analytics, Stochastic, Stock Markets and Volatility.

JEL Code: C45, C53, E27, E44, G1

                                                 INTRODUCTION

        Big Data becomes the buzzword in the field of technology for some time now (Tayal et
al., 2018). Siegel (2016) emphasized that a little prediction goes a long way. Forecasting the
movement of stock price of a company and stock index is a classic problem, to all those who are
connected to the stock markets. The Efficient Market Hypothesis (EMH) clearly asserts that it is
not possible to exactly forecast the stock prices of companies, due to the existence of random
walk behaviour, in the stock markets (Fama, 1970). The movements of stock prices and stock
indices are influenced by many macro-economic variables, such as political events, business
policies of the corporate enterprises, general economic conditions, commodity price index, bank
rate and loan rates and changes in foreign exchange rates, investors’ expectations, investors’
choices, investors’ perception and the human psychology of stock market investors (Miao et al.,
2007). Neural networks are a class of generalized, non-linear and non-parametric models,

                                                          1                        1528-2635-22-3-225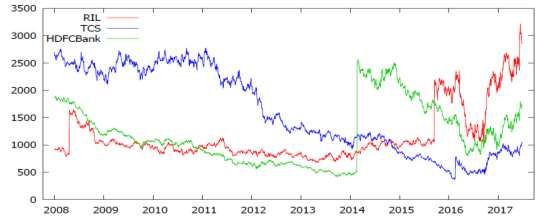
Academy of Accounting and Financial Studies Journal                           Volume 22, Issue 3, 2018

developed from the studies of human brain. It is one of the data mining tools, which performs
better than the conventional statistical tools of financial forecasting. The construction of an
intelligent data mining system, mainly involves a selection of better forecasting models and
trading strategies. The feed-forward networks are the most widely used architecture since such
networks offer good generalization abilities, for forecasting the future movements (Ou and
Wang, 2009). The stock market transactions, across the globe, are voluminous and volatile.
Prediction of stock price movements, being big data, is increasingly difficult due to the
prevalence of an element of uncertainties involved with the probable future outcomes (Siegel,
2016). To get accurate response, we use big data analytic concept (Mishra et al., 2018). If and
only if the information obtained relating to the stock prices is pre-processed efficiently, the
forecasting would become more accurate and reliable. Since the stock price movement is
stochastic, non-stationary and non-linear in nature, the volatility widely persists in the stock
prices and index movements. Big data tools are used to process unstructured data sets to get the
meaningful visualizations (Sankaranarayanan and Thind, 2017). Every industry and business is
digitizing their data ushering in the dawn of an era of big data in India (Panicker and Srivastava,
2017). Big Data processes huge volumes of transactional information in real time (Gupta and
Tripathi, 2016). At a particular point of time, there could be trends, cycles and random walk or a
combination of these three cases/events, in respect of stock market movements (Snigaroff and
Wroblewski, 2011). The closing value of the stock index has been used, as one of the important
statistical data, to derive useful information about the current and probable future movement
pattern of stock markets (Zhang et al., 2005). Based on the neural network forecasting model, an
intelligent mining system has been developed. Artificial Neural Network (ANN) approach could
forecast the future trend of stock market and it provides stock information signs, for taking better
investment decision of buying and selling of stocks, by the investors (Patel et al., 2015). High
frequency data has great potential for new insights (Balaji, 2017). ANN, one of the applications
of neural network (machine learning) method, is used in this study, to analyze current price
trends and probable future prices of company stocks (Maas, 2017).

                                          REVIEW OF LITERATURE

         An extensive review of literature, in the area of forecasting of stock prices, has been done
to find the research gap and to get an idea of predictive analytics of financial markets. Etzioni
(1976) forecasted the movements of stock indices and individual stock prices and explained the
difficulties in making specific forecasting of financial markets. It was emphasized that buying a
stock, exactly when the price was at the lowest ebb and making a sale when the market price of
the share was at the highest ebb, would help the investors to make more profitable choices. A
study undertaken by Kohzadi et al. (1996) described the methodology, advantages and demerits
of artificial neural network and used time series models to forecast the highly volatile commodity
markets. The mean squared error, absolute error, and mean absolute percentage error were all
lower, on an average, for the neural network approach than for the time series models like Auto
Regressive Integrated Moving Average (ARIMA). Wang and Leu (1996) forecasted stock price
trend for six weeks, based on past four years stock price movements of Taiwan stock market, by
using recurrent neural network. Vladimir (1998) has developed Support Vector Machine (SVM)
algorithm and applied the same in forecasting the financial markets. Walczak (1999) forecasted
the fluctuations in financial markets, vary across the time periods and the rate of financial
literacy was considered as one of the crucial factors, which influence the investment decisions of
the investors. Abraham et al. (2001) applied neuro-fuzzy system for forecasting the stock prices

                                                      2                               1528-2635-22-3-225
Academy of Accounting and Financial Studies Journal Volume 22, Issue 3, 2018
of next day and the stock index movements of Nasdaq-100 of United States of America. It was
found that the probabilistic neural network based investment strategies performed better than the
other predictive models. Kim (2003) used twelve technical indicators, to make forecasting of
daily stock price changes and stock index values of Korea Composite Stock Price Index
(KOSPI). Simulation results of Shanghai Composite Index showed that neural networks could be
applied to maximize the returns of stock market investment (Zhang et al., 2005). Besides, Huang
et al. (2005) investigated the forecasting capability of the weekly movement pattern of Nikkei-
225, one of the premier stock indices of Japan. Kuo (2006) classified the networks into linear,
passive, reciprocal, causal and time invariant and each one of the network approaches has
different characteristic properties accordingly. Jasic and Wood (2006) calculated the profitability
of stock indices, based on daily trades, by applying neural network for the highly volatile stock
index movements of S&P 500 (U.S.A), the DAX (Germany), the TOPIX (Japan) and the FTSE
(U.K). According to Hassan et al., (2007), a fusion model, by combining Hidden Markov Model,
Artificial Neural Network and Genetic Algorithms, was used to forecast the stochastic financial
market behaviour. Kwon and Moon (2007) observed that the prediction of financial objects, a
challenging task and the profits, were quite sensitive to transaction costs. Carvalhal and Mendes
(2008) analyzed the forecasting performance of stock returns of emerging market stocks. Zhu et
al. (2008) explained the technicalities of forecasting the stock index movements, by using
different neural networks, the role and influence of trading volume, under different time horizons
of various stock market indices like Dow Jones Industrial Average (DJIA) and Strait Times
Index (STI). Ou and Wang (2009) used ten different data mining techniques, in order to forecast
the stock price movements of Hang Seng index of Hong Kong stock market. According to
Hanson and Oprea (2009), the novelty, complexity and anonymity influenced the forecasting of
the stock markets. Boyacioglu and Avci (2010) forecasted the returns on stock index value of the
Istanbul Stock Exchange (ISE), with the help of Adaptive Network-Based Fuzzy Inference
System (ANFIS). The experimental results revealed that the model successfully forecasted the
monthly return of ISE National 100 Index, with an accuracy rate of 98.3%. Nair et al. (2011)
forecasted the closing value of next day for five international stock indices, using an adaptive
artificial neural network system. Chakravarty and Dash (2012) found that the volatility persisted
in the financial time series, due to both economic and non-economic factors. Simon and Raoot
(2012) applied Artificial Neural Network to forecast the stock price movements. The selection of
appropriate number of hidden layers, number of neurons in each layer, size of the training set,
initial values for weights, inputs to be included, activation function, are the key issues in
designing a network model. Sureshkumar and Elango (2012) applied artificial neural network, to
predict the stock prices, and the accuracy rate was 20% of the output. Patel et al. (2015)
predicted the movements of BSE-Sensex, NSE-Nifty, Reliance Industries and Infosys Limited,
using four predictive models, namely artificial neural network, support vector machine, random
forest and naïve-bayes and the respective values were compared in a group. Sigo et al. (2017)
found that the forecasting accuracy was higher in the case of k-nn algorithm model than that of
logistic regression method. Marxia Oli. Sigo et al. (2018) applied the technical indicators and
forecasted the stock index trends of BSE-Sensex and NSE-Nifty of India, in pre and post-global
crisis (2008) time zones. Based on the above reviews, the researchers of this study have applied
Artificial Neural Network in this study, to forecast the highly volatile stocks, Reliance Industries
Limited, Tata Consultancy Services Limited and HDFC Bank Limited, listed in BSE of India
(Wu & Lee, 2015).
3 1528-2635-22-3-225Academy of Accounting and Financial Studies Journal Volume 22, Issue 3, 2018
STATEMENT OF THE PROBLEM
Forecasting the movements of financial market is one of the classic issues for the market
participants i.e., the investors and other stakeholders. Generally, the investors find it difficult to
forecast the movements of stock price, since it is highly stochastic and volatile in nature. If an
investor closely observes and analyzes the stock price movements, rationally and consistently,
such investors could have earned more returns by way of capital appreciation. It is normal that
the investors buy a stock, at a low market price and sell it at high market prices, thereby earning
the returns hugely in the stock market. Only such intelligent investors would become wealthy.
On the flip side, the investors, who do not practice it, would probably lose their fortunes or miss
the earning opportunities. Hence the forecasting of stock indices is a herculean task, in highly
growing economies like India, since only a few research studies exist. It is important that market
intelligence and financial literacy are the two essential inputs to be considered, by the investors,
for investment decision making. Lack of these attributes, among the financial investors, would
lead to inconsistency and inaccuracy of market forecasting, which would eventually lead to the
loss of their stock market investments (Boyacioglu and Avci, 2010). Besides, the financial
system develops and suggests some proven techniques, for the investors, to forecast the price.
But, there is no proven technique, available for the investors. The absence of proven forecasting
techniques, to exactly forecast the probable futuristic price movements of stock price, increases
the magnitude and severity of this issue (Lopez et al., 2014).
NEED OF THE STUDY
Different kinds of uncertainties exist, in forecasting the stock market trends, especially
stock price movements. It is highly imperative to ensure a high degree of predictive ability and
accuracy, for both short term and long term view. To maximize the returns for the investments in
stocks, trade-off between risk and return as well as the sensitivity to the stock price movements,
is essential. This study would help a spectrum of investors (including the retail investors,
financial institutions, mutual funds, investment banks and the foreign institutional investors), to
take timely and well-informed investment decisions, based on scientific thinking and rational
approach (Etzioni, 1976). The absence of prudent forecasting methods, lower level of financial
literacy and alternate investment options, reiterate the need for this kind of study, for the present
context, in India.
OBJECTIVE
The objective of this study is to find out the existing trend and to forecast the future
direction of the stock price movements of Reliance Industries Limited, Tata Consultancy
Services Limited and HDFC Bank Limited, using artificial neural network.
HYPOTHESES
H1: There is no stochastic movement between the stock prices of Reliance Industries Limited, Tata
Consultancy Services Limited and HDFC Bank Limited during the study period.
H2: There exists no price trend variation between the stock prices of Reliance Industries Limited, Tata
Consultancy Services Limited and HDFC Bank Limited during the study period.
4 1528-2635-22-3-225Academy of Accounting and Financial Studies Journal Volume 22, Issue 3, 2018
H3: There exists no variation between actual and predicted stock prices of Reliance Industries Limited, Tata
Consultancy Services Limited and HDFC Bank Limited during the study period.
RESEARCH METHODOLOGY
Sampling Design of the Study
The stock of three top companies, namely Reliance Industries Limited (Rs. 5,91,580
crores), Tata Consultancy Services Limited (Rs. 5,60,072 crores) and HDFC Bank Limite (Rs.
4,88,604 crores) were selected, based on the top value in its free-float market capitalization, as
on 15-02-2017. Hence, these three companies stocks were taken, as sample units, for this study.
Sources of Data
The secondary data of the four types of daily prices (opening price, high price, low price,
and closing price) of sample companies, Reliance Industries Limited, Tata Consultancy Services
Limited and HDFC Bank Limited, were collected from the websites of Bombay Stock Exchange
Limited and the sample firms.
Study Period
A period of ten years (from 01st January 2008 to 31st December 2017) was considered for
the study.
Statistical Tools Used
In order to forecast the stock price trends of Reliance Industries Limited, Tata
Consultancy Services Limited and HDFC Bank Limited, the statistical tools, SPSS (version 20.0)
and Neural Works Predict (version. 3.24), were used in the study.
DESCRIPTIVE ANALYTICS OF RIL, TCS AND HDFC BANK
Table 1 depicts the descriptive statistics of the stock prices of Reliance Industries
Limited, Tata Consultancy Services and HDFC Bank, for the time period 2008-2017. The equity
shares of these three companies are listed in Bombay Stock Exchange (S&P BSE Sensex). These
three stocks are the prime movers in the Indian stock market and they have top market
capitalization values. Volatility generally persists in stock prices of the listed companies in India.
One of the measures of central tendency, namely the average mean value for TCS was
maximum at Rs. 2570.51, followed by HDFC Bank at Rs. 1910.45, but for RIL, the value was
minimum at Rs. 1883.92, during the study period. Another measure of central tendency,
considered for this study, was the Median and the average median value was at Rs. 1722.45,
followed by RIL, and was at minimum of Rs. 1579.26 during the period 2008-2017.
The analysis of average value of Minimum shows that RIL was at Rs. 1081.98, TCS was
at Rs. 583.38 and HDFC Bank was at Rs. 650.44, whereas the average value of Maximum, for
RIL was at Rs. 5127.84, followed by TCS, with the value of Rs. 4449.80 and HDFC Bank with
the value of Rs. 4105.42, during the study period. The average value of Standard Deviation, for
RIL was at 754.943, followed by HDFC Bank (869.288) and TCS (1214.01), during the period.
5 1528-2635-22-3-225Academy of Accounting and Financial Studies Journal Volume 22, Issue 3, 2018
The two major measures of dispersion, in the descriptive statistics, are Skewness and
Kurtosis. It was found that the Skewness value (average) for RIL was at 2.97564, followed by
HDFC Bank (0.98025) and TCS (0.10447). Kurtosis value (average) for RIL was at 4.15644,
followed by HDFC Bank (-0.92863) and TCS (-2.54764), during the study period.
The total value at 95% level, for TCS was at 10477.5, followed by HDFC Bank
(9143.02) and RIL (9018.59). The total value of Inter-quartile range, for HDFC Bank was at
3537.37, TCS was at 6042.58 and RIL was at 958.18. The average value of the HDFC Bank was
at 1414.95, TCS was at 2417.03 and RIL was at 383.272, during the period of 2008 to 2017.
The analysis clearly indicates that the stock prices of all the three sample stocks (RIL,
TCS and HDFC Bank), varied widely, in tune with price variants, namely opening price, high
price, low price and closing price during intra-day transactions, during the study period, on all
parameters of descriptive statistics, used in this study. Hence the hypothesis H1 (There is no
stochastic movement between the stock prices of Reliance Industries Limited, Tata Consultancy
Services Limited and HDFC Bank Limited during the study period), is not accepted.
The stock market data are a kind of big data. For each trading day, four strata values were
considered. The total observations, used in the study, were 29718 for the 2476 trading days
(9904 observations for each stock), which is voluminous in nature and they require machines and
human intelligence to process and to draw meaningful inferences (Kohzadi et al., 1996).
Table 1
DESCRIPTIVE ANALYTICS FOR RIL, TCS AND HDFC BANK STOCK PRICES DURING THE
PERIOD FROM 2008 TO 2017
Factor Company Opening Price High Price Low Price Closing Price Total Average
Mean RIL 1146.68 1163.10 1129.42 1145.61 4584.81 1833.92
(Rs.) TCS 1606.80 1625.40 1587.75 1606.32 6426.27 2570.51
HDFC Bank 1194.87 1208.41 1178.78 1194.06 4776.12 1910.45
RIL 988.00 996.60 977.15 986.40 3948.15 1579.26
Median (Rs.) TCS 1336.03 1348.67 1323.12 1336.05 5343.87 2137.55
HDFC Bank 1078.00 1090.00 1062.10 1076.03 4306.13 1722.45
RIL 675.00 682.75 671.00 676.20 2704.95 1081.98
Minimum
TCS 360.000 377.000 355.250 366.200 1458.45 583.38
(Rs.)
HDFC Bank 405.900 413.700 400.450 406.050 1626.1 650.44
RIL 3216.00 3252.10 3135.20 3216.30 12819.6 5127.84
Maximum
TCS 2775.00 2834.00 2739.80 2775.70 11124.5 4449.8
(Rs.)
HDFC Bank 2564.00 2582.50 2552.35 2564.95 10263.8 4105.52
RIL 471.998 483.841 459.683 471.835 1887.36 754.943
Std. dev. TCS 759.369 763.182 754.135 758.349 3035.04 1214.01
HDFC Bank 543.309 548.913 537.509 543.490 2173.22 869.288
RIL 1.8618 1.8582 1.8608 1.8583 7.4391 2.97564
Skewness TCS 0.0650885 0.0669944 0.0638776 0.0652188 0.26118 0.10447
HDFC Bank 0.611918 0.606260 0.619980 0.612466 2.45062 0.98025
RIL 2.6065 2.5705 2.6256 2.5885 10.3911 4.15644
Kurtosis TCS -1.59124 -1.59446 -1.58997 -1.59342 -6.3691 -2.54764
HDFC Bank -0.579665 -0.586630 -0.573415 -0.581858 -2.3216 -0.92863
RIL 2260 2300.15 2207.20 2251.24 9018.59 3607.44
95% perc. TCS 2620.00 2644.87 2594.81 2617.78 10477.5 4190.98
HDFC Bank 2292.15 2314.32 2253.34 2283.21 9143.02 3657.21
RIL 238.25 248.49 233.34 238.10 958.18 383.272
IQ range TCS 1506.62 1512.41 1511.34 1512.21 6042.58 2417.03
HDFC Bank 885.000 903.212 869.075 880.087 3537.37 1414.95
6 1528-2635-22-3-225Academy of Accounting and Financial Studies Journal Volume 22, Issue 3, 2018
Source: Data retrieved from www.bseindia.com, using SPSS (version 20.0)
STOCK PRICE TRENDS OF RIL, TCS AND HDFC BANK DURING 2008-2017
The holistic view of the stock price trends of Reliance Industries Limited, Tata
Consultancy Services and HDFC Bank, is illustrated in Table 2. The total number of trading days
considered, in this study, was 2476 days. The four strata values (opening price, high price, low
price and closing price), on every trading day, envisaged the stochastic behaviour of stock
markets trends. The trends were calculated, from 1st January 2008 to 31st December 2017.
According to Table 2, the R-value was recorded, at maximum, for Reliance Industries
Limited (0.9977), followed by HDFC Bank (0.9974) and Tata Consultancy Services (0.9972),
whereas the Net-R value computed was ranging between 0.9955 to 0.9951 (RIL: 0.9955; HDFC
Bank: 0.9954 and TCS: 0.9951), during the study period.
The Average Absolute Error (AAE) denotes the average absolute difference between the
values of price (four strata values) trends. The average absolute error was recorded at 10.1857
(maximum) for RIL while it was recorded at 9.8523 (minimum) for TCS and at 9.8649 for
HDFC Bank. Similarly, the Maximum Absolute Error (MAE) refers to the maximum absolute
difference between the daily prices (four strata values) of the stock. Such values were recorded at
42.4135 (maximum) for RIL, 39.1059 for TCS and at 38.9736 (minimum) for HDFC Bank.
The Root Mean Square Error (RMSE) emphasizes the mean difference between two days
stock price values. The values of RMSE were recorded at 12.6871 (maximum), for RIL, at
12.6241, for TCS and at 11.8912 (minimum) for HDFC Bank. At the 95% confidence intervals,
the stock price trend value, for RIL, was recorded as 24.8154 (maximum) whereas it was
recorded at 24.7182, for TCS and at 22.4873 (minimum), for HDFC Bank, during the study
period. The stochastic nature of price movements i.e., price increase and decrease in a wide
manner, were evidenced from the market statistics of RIL, TCS and HDFC Bank.
TABLE 2
STOCK PRICE TRENDS FOR RIL, TCS AND HDFC BANK DURING THE PERIOD 2008 TO 2017
Name of the R Net-R Average Absolute Maximum Root Mean Confidence Trading
Company Error Absolute Error Square Error Interval (95%) Days
RIL 0.9977 0.9955 10.1857 42.4135 12.6871 24.8154 2476
TCS 0.9972 0.9951 9.8523 39.1059 12.6241 24.7182 2476
HDFC Bank 0.9974 0.9954 9.8649 38.9736 11.8912 22.4873 2476
Source: Data retrieved from www.bseindia.com, using SPSS (version 20.0)
Figure 1 evidences the daily stock price trends, in terms of four strata values of RIL, TCS
and HDFC Bank, during the period and the trend also supports the statistical values, depicted in
Table 2. Hence the hypothesis H2 (There exist no variations in the price trends among the stock
prices of Reliance Industries Limited, Tata Consultancy Services Limited and HDFC Bank
Limited), is not accepted, in the study.
The stock prices normally tend to vary, due to buying and selling of stocks and a host of
macro as well as micro economic variables. ANN is a class of generalized, non-linear and non-
parametric model, which is used to derive inferences in the analysis of big data domains like
stock market analytics. The stock price trends of RIL, TCS and HDFC Bank varied widely,
during the intra-day transactions, since the volume of transactions and the price quotes for
buying and selling were different for each of the stocks. Neural networks would be helpful for
the investors, to arrive at right price discovery of the stocks, in both the short term point of view
7 1528-2635-22-3-225Academy of Accounting and Financial Studies Journal Volume 22, Issue 3, 2018
and the long term perspective, so as to make investment strategies accordingly, to maximize the
returns (Boyacioglu and Avci, 2010).
Source: Data using SPSS (version 20.0)
FIGURE 1
STOCK PRICE TRENDS FOR RIL, TCS AND HDFC BANK DURING 2008-2017
PREDICTION PERFORMANCE OF RIL, TCS AND HDFC BANK
The main objective of this study was to predict the stock prices of Reliance Industries
Limited, Tata Consultancy Services and HDFC Bank, using the past prices/historical values of
the company stock. In this study, Neural Works Predict (version 3.24) package was used to
predict the future stock prices. The performance of the neural network largely depends on the
architecture of the neural network. The critical issues of neural network modeling include
selection of input variables, data pre-processing technique, network architecture design and
performance measuring statistics, in designing the right predictive models.
Table 3 exemplifies the results of prediction performance statistics, for three sample
stocks, namely Reliance Industries Limited (RIL), Tata Consultancy Services (TCS) and HDFC
Bank, during the study period from 2008 to 2017. The total number of trading days considered in
this study was 2476 days. The four variants of statistics of stock values (opening value, high
value, low value and closing value) were considered. Both the actual values recorded and the
predicted values calculated, were compared, to analyze the prediction performance. The R-value
for RIL was 0.9971 (actual) and 0.9968 (predicted) whereas the values for TCS were 0.9971
(actual) and 0.9971 (predicted) and the values for HDFC Bank were at 0.9965 (actual) and
0.9963 (predicted). Similarly, the Net-R values, computed for RIL, were 0.9952 (actual) and
0.9961 (predicted) whereas the values, for TCS, were 0.9950 (actual) and 0.9955 (predicted) and
the values for HDFC Bank were 0.9953 (actual) and 0.9949 (predicted).
The Average Absolute Error (AAE) denotes the average absolute difference between
predicted output values and target output values. The values of AAE were recorded as 9.8723
(actual) and 10.8716 (predicted) for Reliance Industries Limited, whereas the AAE values were
at 9.8169 (actual) and 10.1857 (predicted) for Tata Consultancy Services and the values were
9.8169 (actual) and 8.1857 (predicted) for HDFC Bank. This shows that the variations persisted
between actual and predicted values of stock prices of sample firms. The Maximum Absolute
Error (MAE) is the maximum absolute difference, between a predicted output value and a target
output value. Such values were 49.1059 (actual) and 47.9437 (predicted) for RIL whereas the
values of MAE were 48.1047 (actual) and 41.4135 (predicted), for TCS and the values were
8 1528-2635-22-3-225Academy of Accounting and Financial Studies Journal Volume 22, Issue 3, 2018
43.1047 (actual) and 37.4135 (predicted), for HDFC Bank. The values of Root Mean Square
Error (RMSE) were 12.6841 (actual) and 11.1759 (predicted), for RIL, whereas the values were
at 11.6872 (actual) and 10.3571 (predicted), for TCS and the values of RMSE were at 10.6872
(actual) and 9.6571 (predicted) for HDFC Bank. The accuracy is measured in terms of either
significance level or confidence intervals. At 95% confidence intervals, the model predictions
were within the range, around the target values. The values of accuracy were 24.7182 (actual)
and 23.8237 (predicted), for RIL, the values were at 22.8154 (actual) and 22.8154 (predicted),
for TCS and 21.7509 (actual) and 20.8154 (predicted), for HDFC Bank.
The close correlation between the market value predicted, using the neural network and
the actual value, suggests that such networks are powerful tools in stock price prediction and
helps the investors to take intelligent investment decisions, to earn capital appreciation, in
addition to dividends (Sigo and Selvam, 2015) for their stock market investments. The real
output was compared with predicted values.
Table 3
PREDICTION PERFORMANCE FOR RIL, TCS AND HDFC BANK STOCK PRICES DURING THE
PERIOD 2008 TO 2017
Name of the Trend R Net-R Average Absolute Maximum Root Mean Confidence
Company Error Absolute Error Square Error Interval (95%)
RIL Actual 0.9971 0.9952 9.8723 49.1059 12.6841 24.7182
Predicted 0.9968 0.9961 10.8716 47.9473 11.1759 23.8237
TCS Actual 0.9970 0.9950 9.8169 48.1047 11.6872 23.7509
Predicted 0.9971 0.9955 10.1857 41.4135 10.3571 22.8154
HDFC Bank Actual 0.9965 0.9953 9.8169 43.1047 10.6872 21.7509
Predicted 0.9963 0.9949 8.1857 37.4135 9.6571 20.8154
Source: Data retrieved from www.bseindia.com, using Neural Works Predict (version 3.24)
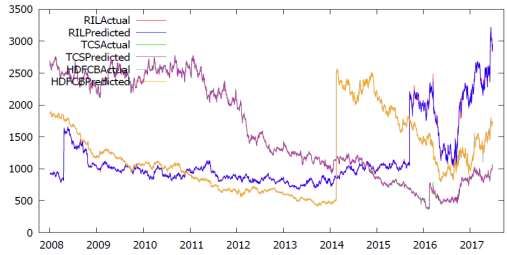
Source: Data using NeuralWorks Predict (version 3.24)
FIGURE 2
PREDICTION PERFORMANCE OF STOCK PRICE TRENDS FOR RIL, TCS AND HDFC
BANK DURING 2008-2017
9 1528-2635-22-3-225Academy of Accounting and Financial Studies Journal Volume 22, Issue 3, 2018
Figure 2 evidences the actual and predicted values of daily stock price trends of RIL,
TCS and HDFC Bank, during the period from 2008 to 2017 and it also supports the values
depicted in Table 3. Hence the hypothesis H3 (There exist no price variation between actual and
predicted stock prices of Reliance Industries Limited, Tata Consultancy Services Limited and
HDFC Bank Limited during the study period), is rejected, in the study.
The information of historical prices would be helpful for the investors, to forecast the
possible future prices of individual stocks. The fundamental and technical analysis of a stock
would help the investors in this aspect. Artificial Neural Network, being one of the neural
network methods, is a non-linear and non-parametric model, used to derive inferences, in big
data domains like stock market analytics.
The analysis of Tables 1-3 and Figures 1 & 2, there was volatility and stock prices of
Reliance Industries Limited (RIL), Tata Consultancy Services (TCS) and HDFC Bank recorded
stochastic nature in price trends, as well as the price variations between the actual and predicted
values of all these three sample stocks, during the study period (Zhu, 2008).
DISCUSSIONS AND FUTURE RESEARCH ORIENTATIONS
The market value of every stock is changing every bit of a second, based on the demand
and supply forces, namely the buyers and sellers of stocks. The stock prices of the three sample
stocks ranged between Rs. 355.25 to Rs. 3252.10 (for RIL: Rs. 671.00 to Rs. 3252.10, for TCS:
Rs. 355.25 to Rs. 2834.00 and HDFC Bank: Rs. 400.45 to Rs. 2582.50), during the study period
(Table 1). This phenomenon happens due to various macro and micro economic factors. There
are micro economic factors i.e., bearish and bullish trends and the investors’ sentiments in the
stock market, which are directly related to the stock performance and some other factors, which
may be of macroeconomic in nature, which do not directly impact the price movement of the
specific stock. In this study, the stock prices were forecasted, using artificial neural network,
since the stock price data of the three sample stocks (RIL, TCS and HDFC Bank) was volatile
and voluminous, i.e., big data. The stock price data were collected and processed, to find out the
current price trends and the future price trend of these three stocks were predicted by applying
the Neural Works Predict (version 3.24). This machine learning model was found better than the
time series models, in processing the volatile stock information and big data and to give valuable
inferences (Wanga and Shangb, 2014).
Stock markets are mostly dynamic in nature. A high degree of financial literacy,
alertness, and rationality is required, for investors, before taking any investment decisions, (i.e.,
buy, sell and hold). The investments in blue chip stocks like RIL, TCS and HDFC bank would
make the investors to get more benefit, if they could invest rationally in those stocks, since these
stocks are the top three market capitalization stocks and the market leaders in the respective
sectors of business. The applications and the use of machine learning oriented artificial neural
networks would probably enhance the predictive accuracy of stock price prediction. The fusion
of two or more neural networks could be applied, to increase the predictive accuracy of stock
prices and stock market trends (Snigaroff and Wroblewski, 2011). The experience gained by the
investors, using neural network approaches, would help the investors, in rationalizing the
decisions and optimizing the stock returns.
Attempts could be made, to forecast stocks listed in BSE, NSE and other regional stock
exchanges of India, using other neural network methods. Efforts could be made, to study the
movements of the developed stock markets like U.S.A, U.K and Japan. A comparative analytics
10 1528-2635-22-3-225Academy of Accounting and Financial Studies Journal Volume 22, Issue 3, 2018
of global stock indices could be made, by applying different neural network methods (Jasic and
Wood, 2006).
CONCLUSION
This study analyzed the stock price trends and predicted values of three top market
capitalization stocks, namely RIL, TCS and HDFC Bank, which are listed in the Bombay Stock
Exchange in India. Forecasting of stock market movements become difficult, due to the
uncertainties involved, with the future stock prices (Hassan et al., 2007). The investment
behaviour also varied for different kinds of investors (traders, arbitrageurs and investors). If and
only if the information obtained, relating to the stock prices, were pre-processed efficiently,
using the machine learning method like the artificial neural network, the forecasting would
become more accurate and the investors could ensure earning capital appreciation, for their stock
investments, which would ensure maximization of wealth in the long run.
REFERENCE
Abraham, A., Nath, B., & Mahanti, P.K. (2001). Hybrid intelligent systems for stock market analysis.
Computational Science-ICCS 2001, Springer, 337-345.
Annual Convention of Computer Society of India: Big Data Analytics (2018). Advances in Intelligent Systems and
Computing, 654, 1-766.
Balaji, S., Patil, M., & McGregor, C. (2017). A Cloud Based Big Data Based Online Health Analytics for Rural
NICUs and PICUs in India: Opportunities and Challenges. Proceedings - IEEE Symposium on Computer-
Based Medical Systems.
Boyacioglu, M.A. & Avci, D. (2010). An adaptive network-based fuzzy inference system (ANFIS) for the prediction
of stock market return: The case of the Istanbul Stock Exchange. Expert Systems with Applications, 37,
7908-7912.
Carvalhal, A., & De Melo Mendes, B.V. (2008). Evaluating the forecast accuracy of emerging market stock returns.
Emerging Markets Finance and Trade, 44(1), 21-40.
Chakravarty, S., & Dash, P.K. (2012). A PSO based integrated functional link net and interval type-2 fuzzy logic
system for predicting stock market indices. Applied Soft Computing, 12, 931-941.
Etzioni, A. (1976). Future Analysis. Analysen and Prognosen, Springer.
Fama, E.F. (1970). Efficient Capital Markets: A review of theory and empirical work. Journal of Finance, 25(2),
383-417.
Ghosh, M.M. (2017). Significance of big data in E-commerce: The case of amazon India. Media Watch, 8(2), 60-65.
Gill, S.S., Buyya, R., & Chana, I. (2017). IoT based agriculture as a cloud and big data service: The beginning of
digital India. Journal of Organizational and End User Computing, 29(4), 1-23.
Gupta, S., & Tripathi, P. (2016). An emerging trend of big data analytics with health insurance in India. 1st
International Conference on Innovation and Challenges in Cyber Security (ICICCS), 64-69.
Gupta, S., & Tripathi, P. (2016). Big data lakes can support better population health for rural India-Swastha Bharat.
1st International Conference on Innovation, Challenges in Cyber Security (ICICCS),145-150.
Hanson, R., & Oprea, R. (2009). A manipulator can aid prediction market accuracy. Economica, 76(302), 304-314.
Hassan, M.R., Nath, B., & Kirley, M. (2007). A fusion model of hmm, ANN and GA for stock market forecasting.
Expert Systems with Applications, 33(1), 171-180.
Jasic, T., & Wood, D. (2006). The profitability of daily stock market indices trades based on neural network
predictions: case study for the S&P 500, the DAX, the TOPIX and the FTSE in the period 1965-1999.
Applied Financial Economics, 14(4), 285-297.
Sigo, M.O. Kathiravan, C., Selvam, M., Venkateswar, S., & Lingaraja, K. (2018). An empirical investigation of the
interlinkages of stock returns and the weather at the Indian stock exchange. Academy of Strategic
Management Journal, 17(1), 1-14.
Kim, K.J. (2003). Financial time series forecasting using support vector machines. Neurocomputing, 55(1-2), 307-
319.
11 1528-2635-22-3-225Academy of Accounting and Financial Studies Journal Volume 22, Issue 3, 2018
Kohzadi, N., Boyd, M.S., Kermanshahi, B., & Kaastra, I. (1996). A comparison of artificial neural network and time
series models for forecasting commodity prices. Neurocomputing, 10(2), 169-181.
Kuo, F.F. (2006). Network Analysis and Synthesis. Wiley India Pvt. Ltd, New Delhi.
Kwon, Y.K., & Moon, B.R. (2007). A hybrid neurogenetic approach for stock forecasting. IEEE Transactions on
Neural Networks, 18(3), 851-864.
Lopez, D., Gunasekaran, M., Murugan, B.S., Kaur, H., & Abbas, K.M. (2014). Spatial big data analytics of
influenza epidemic in Vellore, India. Proceedings - IEEE International Conference on Big Data, IEEE
Big Data, art. no. 7004422, 19-24.
Maas, A.I.R. (2017). Traumatic brain injury in India: A big problem in need of data. Neurology India, 65(2), 257-
258.
Miao, K., Chen, F., & Zhi-gang, Z. (2007). Stock price forecast based on bacterial colony RBF neural network.
Journal of Qingdao University (Natural Science Edition), 2, 50-54.
Mishra B.K., Sahoo A.K., & Misra R. (2018). Recommendation for selecting smart village in india through opinion
mining using big data analytics. In: Saini A., Nayak A., Vyas R. (eds) ICT Based Innovations. Advances
in Intelligent Systems and Computing, 653. Springer, Singapore
Nair, B.B., Sai, S.G., Naveen, A., Lakshmi, A., Venktesh, G., & Mohandas, V., (2011). A ga-artificial neural
network hybrid system for financial time series forecasting. Information Technology and Mobile
Communication, Springer.
Ou, P., & Wang, H., (2009). Prediction of stock market index movements by ten data mining techniques. Modern
Applied Science, 3(12), 28.
Panicker, S., & Srivastava, R. (2017). Emerging role of data analytics in combating financial frauds: The era of big
data in India. ACM International Conference Proceeding Series, Part F128003, 167-173.
Patel, J., Shah, S., Thakkar, P., & Kotecha, K. (2015). Predicting stock and stock price index movement using trend
deterministic data preparation and machine learning techniques. Expert Systems with Applications, 42(1),
259-268.
Patel, J., Shah, S., Thakkar, P., & Kotecha, K. (2015). Predicting stock market index using fusion of machine
learning techniques. Expert Systems with Applications, 42(4), 2162-2172.
Sankaranarayanan, H.B., & Thind, R.S. (2017). Multi-modal travel in India: A big data approach for policy
analytics. Proceedings of the 7th International Conference Confluence 2017 on Cloud Computing, Data
Science and Engineering, art. no. 7943157, 243-248.
Selvam, M., Gayathri, J., Vasanth, V., Lingaraja, K., & Sigo, M.O. (2016). Determinants of firm performance: A
Subjective Model. International Journal of Social Science Studies, 4(7), 90-100.
Selvam, M., Sankarkumar, A.V., Maniam, B., & Sigo, M.O. (2017). Long memory features and relationship
stability of Asia-pacific currencies against USD. Business and Economic Horizons, 13(1), 97-109.
Siegel, E. (2016). Predictive Analytics: The power to predict who will click, buy, lie or die. Wiley India Pvt. Ltd.,
New Delhi. ISBN: 978-81-265-5977-0.
Simon, S., & Raoot, A. (2012). Accuracy driven Artificial Neural Networks in Stock Market Prediction.
International Journal of Soft Computing, 3(2), 35-44.
Sigo, M.O. & Selvam, M. (2013). Corporate Governance and the Determinants of Dividend Policies of Information
Technology Companies in India. Available at SSRN: https://ssrn.com/abstract=2339030 or
http://dx.doi.org/10.2139/ssrn.2339030
Sigo, M.O. & Murugesan Selvam (2015). Corporate Governance and Dividend Payout of Information Technology
Companies in India, Lambert Academic Publishing. ISBN: 978-3-659-71030-8.
Sigo, M.O., Selvam, M., Lingaraja, K., & Vasanth, V. (2017). Forecasting the Stock Index Movements of India:
Application of Neural Networks. International Journal of Soft Computing, 12(2), 120-131.
Sigo, M.O., Selvam, M., Lingaraja, K., Sankarkumar, A., & Kathiravan, C. (2018). Predicting Stock Market
Movements of India using Data Deterministic Approach. Academy of Strategic Management Journal,
17(2), 1-14.
Snigaroff, R., & Wroblewski, D. (2011). A network value theory of a market and puzzles. Financial Analysts
Journal, 67(5), 69-85.
Sureshkumar, K.K., & Elango, N.M. (2012). Performance analysis of stock price prediction using artificial neural
network. Global Journal of Computer Science and Technology, 12(1), 18-25.
Tayal, S., Nagwal, N., & Sharma, K. (2018). Role of big data in make in India. Advances in Intelligent Systems and
Computing, 564, 431-437.
Vladimir, V. (1998). The support vector method of function estimation. Nonlinear Modeling, Springer US. Doi:
10.1007/978-1-4615-5703-6_3
12 1528-2635-22-3-225Academy of Accounting and Financial Studies Journal Volume 22, Issue 3, 2018
Walczak, S. (1999). Gaining competitive advantage for trading in emerging capital markets with neural networks.
Journal of Management Information Systems, 16(2), 177-192.
Wang, J.H., & Leu, J.Y. (1996). Stock market trend prediction using ARIMA based neural networks. IEEE
International Conference of Neural Networks, 4, 2160-2165.
Wanga, S. & Shangb, W. (2014). Forecasting direction of china security index 300 movement with least squares
support vector machine. Procedia Computer Science, 31, 869-874.
Wu, S.F. & Lee, S.J. (2015). Employing local modeling in machine learning based methods for time-series
prediction. Expert Systems with Applications, 42(1), 341-354.
Zhang, D., Jiang, Q., & Li, X. (2005). Application of neural networks in financial data mining. World Academy of
Science, Engineering and Technology, 1(1), 136-139.
Zhu, X., Wang, H., Xu, L., & Li, H. (2008). Predicting stock index movements by neural networks: The role of
trading volume under different horizons. Expert Systems with Applications, 34(4), 3043-3054.
13 1528-2635-22-3-225You can also read