SALLIE MAE INVESTOR PRESENTATION - Second Quarter 2019
←
→
Page content transcription
If your browser does not render page correctly, please read the page content below
SALLIE MAE
    INVESTOR PRESENTATION

Second Quarter 2019
Forward-Looking Statements and Disclaimer
Cautionary Note Regarding Forward-Looking Statements
The following information is current as of April 17, 2019 (unless otherwise noted) and should be read in connection with the press release of SLM Corporation (the
“Company”) announcing its financial results for the quarter ended March 31, 2019, the Form 10-Q for the quarter ended March 31, 2019 (filed with the Securities and
Exchange Commission (“SEC”) on April 17, 2019), and subsequent reports filed with the SEC.
This Presentation contains “forward-looking” statements and information based on management’s current expectations as of the date of this Presentation. Statements that
are not historical facts, including statements about the Company’s beliefs, opinions or expectations and statements that assume or are dependent upon future events, are
forward-looking statements. This includes, but is not limited to, the Company’s expectation and ability to pay a quarterly cash dividend on its common stock in the future,
subject to the determination by the Company’s Board of Directors, and based on an evaluation of the Company’s earnings, financial condition and requirements, business
conditions, capital allocation determinations, and other factors, risks and uncertainties. Forward-looking statements are subject to risks, uncertainties, assumptions and other
factors that may cause actual results to be materially different from those reflected in such forward-looking statements. These factors include, among others, the risks and
uncertainties set forth in Item 1A. “Risk Factors” and elsewhere in the Company’s Annual Report on Form 10-K for the year ended Dec. 31, 2018 (filed with the SEC on Feb. 28,
2019) and subsequent filings with the SEC; increases in financing costs; limits on liquidity; increases in costs associated with compliance with laws and regulations; failure to
comply with consumer protection, banking and other laws; changes in accounting standards and the impact of related changes in significant accounting estimates; any
adverse outcomes in any significant litigation to which the Company or any subsidiary is a party; credit risk associated with the Company’s (or any subsidiary's) exposure to
third parties, including counterparties to the Company’s (or any subsidiary's) derivative transactions; and changes in the terms of education loans and the educational credit
marketplace (including changes resulting from new laws and the implementation of existing laws). The Company could also be affected by, among other things: changes in its
funding costs and availability; reductions to its credit ratings; cybersecurity incidents and cyberattacks and other failures or breaches of its operating systems or infrastructure,
including those of third-party vendors; damage to its reputation; risks associated with restructuring initiatives, including failures to successfully implement cost-cutting
programs and the adverse effects of such initiatives on the Company’s business; changes in the demand for educational financing or in financing preferences of lenders,
educational institutions, students and their families; changes in law and regulations with respect to the student lending business and financial institutions generally; changes
in banking rules and regulations, including increased capital requirements; increased competition from banks and other consumer lenders; the creditworthiness of customers;
changes in the general interest rate environment, including the rate relationships among relevant money-market instruments and those of earning assets versus funding
arrangements; rates of prepayments on the loans made or acquired by the Company and its subsidiaries; changes in general economic conditions and the Company’s ability to
successfully effectuate any acquisitions; and other strategic initiatives. The preparation of the Company’s consolidated financial statements also requires management to
make certain estimates and assumptions, including estimates and assumptions about future events. These estimates or assumptions may prove to be incorrect. All forward-
looking statements contained in this Presentation are qualified by these cautionary statements and are made only as of the date of this Presentation. The Company does not
undertake any obligation to update or revise these forward-looking statements to conform such statements to actual results or changes in its expectations.
The Company reports financial results on a GAAP basis and also provides certain non-GAAP “Core Earnings” performance measures. The difference between the Company’s
“Core Earnings” and GAAP results for the periods presented were the unrealized, mark-to-market gains/losses on derivative contracts (excluding current period accruals on
the derivative instruments), net of tax. These are recognized in GAAP, but not in “Core Earnings” results. The Company provides “Core Earnings” measures because this is
what management uses when making management decisions regarding the Company’s performance and the allocation of corporate resources. The Company’s “Core
Earnings” are not defined terms within GAAP and may not be comparable to similarly titled measures reported by other companies.
For additional information, see “Management’s Discussion and Analysis of Financial Condition and Results of Operations –’Core Earnings’” in the Company’s Quarterly Report
on Form 10-Q for the quarter ended March 31, 2019 for a further discussion and the “’Core Earnings’ to GAAP Reconciliation” table in this Presentation for a complete
reconciliation between GAAP net income and “Core Earnings”.

                                                                                                                                                                                        2
Sallie Mae Opportunity:
Creating shareholder value by growing a unique and
sustainable financial franchise

                                                     3
Putting the pieces together

               Market          Competitive
               Leading           Product
                Brand            Offering

                              Quality Growth
               Strong
                                 Through
              Financial
                                 Rigorous
              Returns
                               Underwriting

                                               4
Market leading brand, products and best-in-class service
drive our success

                               •   40 years of leadership in the education
   Market      Conservative        lending market
   Leading     Funding and
    Brand      Underwriting    •   Top ranked brand

                               •   Industry leading 55% market share1

                               •   Over 2,400 actively managed university
    Strong      Consistent         relationships across the U.S.
   Financial      Credit
   Returns     Performance     •   Appear on 98% of preferred lender lists

                               •   Largest salesforce in the industry

                                                                             5
Private Student Loan Industry
• Private education loans represent
Other
2% of the overall spend in higher
$18
education annually
Federal Loans Private • Total spend on higher education
$94 Education Loans grows 2-3% annually primarily due
Grants $11 to increases in cost of attendance
$129
$441 Billion • Attainment of a four-year college
Annually degree or more is up 11%
between 2012 and 20172
Family
Contribution
$189
6Higher Education Value Proposition
Unemployment rates and earnings by educational attainment, 2017 2
Unemployment rate Median usual weekly earnings
Doctoral Degree 1.5% $1,743
Professional Degree 1.5% $1,836
Master's Degree 2.2% $1,401
Bachelor's Degree 2.5% $1,173
Associate's degree 3.4% $836
Some college, no degree 4.0% $774
High School diploma 4.6% $712
Less than a high school diploma 6.5% $520
Total: 3.6% All workers: $907
• The unemployment rate for individuals age 25-34 with four-year college degrees was
2.3%, compared to 5.8% for high school graduates4
• 60% of students graduated with student loans in AY 2015-20165
• Of the 60% of bachelor’s degree recipients who graduated with student loans, the
average debt amount was $39,4005
7Product suite tailored to meet the needs of undergraduate
and graduate students
Market Conservative • Smart Option Student Loan
Leading Funding and
Brand Underwriting • Introduced in 2009
• Flexible repayment options while in school
• Fixed and Variable rates
Strong Consistent
Financial Credit • Differentiated products for
Returns Performance undergraduates and graduate students
8Product Overview
Undergraduate Medical Law
Parent Dental Health Professions
MBA General Studies
Undergraduate Graduate Parent
Rate Type Variable & Fixed Variable & Fixed Variable & Fixed
Variable: LIBOR + 2.00% - LIBOR + 9.88% Variable: LIBOR + 2.25% - LIBOR + 7.88% Variable: LIBOR + 3.50% - LIBOR + 9.88%
Interest Rate Ranges
Fixed: 5.75% - 12.88% Fixed: 6.25% - 10.50% Fixed: 5.75% - 12.88%
Deferred, Interest Only & Fixed Deferred, Interest Only & Fixed
Repayment Option Interest Only, Full P&I
Repayment Repayment
20 years for Medical and Dental
Repayment Term 5-15 years 10 years
15 years for Remaining Disciplines
Grace Period 6 months 6-36 months None
Internship/Residency
Up to 60 months Up to 48 months None
Deferment
ACH discount | FICO® Score | Cosigner ACH discount | FICO® Score | Cosigner ACH discount | FICO® Score | Study
Features Release | GRP | Study StarterSM | Student Release | GRP | Student Death & StarterSM | Student Death & Disability
Death & Disability Release Disability Release Release
9Consistent underwriting has contributed to better than
model credit performance
• Proprietary Scorecard built with Experian
Market Conservative Decision Analytics
Leading Funding and
Brand Underwriting • Initial credit screen removes applicants
with low FICO scores or prior derogatory
trades on file
• Manually review ~8% of applications
Strong Consistent
Financial Credit • Through-the-cycle data was used to
Returns Performance develop our conservative underwriting
models.
10Consistent high quality originations growth6
$6,000
$5,700
7%
$5,500 $5,315
11%
$5,000 $4,800
$4,666 3%
8%
$4,500 $4,330
$4,000
Originations ($MM)
$3,500
$3,000
$2,500
8% $2,131
$2,000 $1,972
$1,500
$1,000
$500
$0
2015 2016 2017 2018 2019
Private Education Loan Originations
11High Quality, Predictable Credit Program8,9,10
Smart Option Cumulative Gross Defaults by P&I Repayment Vintage and Years Since First P&I Repayment Period
10%
Disbursed Principal Entering P & I Repayment
9%
Cumulative Defaults as a % of
8%
7%
6%
5%
4%
4.9%
3%
3.4%
2% 2.0%
1%
0.3%
0%
0 1 2 3 4 5 6 7 8 9
Years Since First P&I Repayment Period
2010 2011 2012 2013 2014 2015 2016 2017 2018
12High Quality Portfolio Growth
Projected Balance Sheet Growth 2018-2021
$35
$30
$25
$20
$15
$10
$5
$0
2018 2021
Private FFELP Other (Personal and Credit Card)
As of 3/31/19:
• 78% of Private Education Loans have FICO score at approval > 7007
• 52% of Private Education Loan Borrowers make payments while in school
• 63% of Private Education Loans are variable-rate, 37% fixed-rate
13Conservative funding optimizes net interest margin
Secured Debt
Retail
18%
MMDA & CD
23%
Brokered $10.6b
Retail $9.1b
Secured Debt $4.3b
Retail
Brokered
H.S.A. & 529
Variable
15%
27%
Brokered
Fixed
17%
As of 3/31/19
14Strong financial results translate to predictable returns
to shareholders
Market Conservative
Leading Funding and
• Consistent earnings per share growth
Brand Underwriting
• High return on equity
• Stable net interest margin
Strong Consistent
• Introducing capital return programs
Financial Credit
Returns Performance
15Clear Capital Priorities
Invest in High ROE Growth
Continue to focus on high-quality Private
Education Loan originations, including deeper
penetration of the graduate school market
Testing Personal Loan market
Quarterly
Dividend Offer credit cards to our high-quality customer
base
Invest in
Share
High ROE
Repurchases Quarterly Dividend
Growth
Established a quarterly dividend on common
stock in 2019
Increased
Shareholder $0.03 per share dividend paid on 3/15/19
Return
Share Repurchase
Stock buyback authorization of $200 million
$60 million of share authorization was
repurchased in Q1 2019
16CECL Update
• The Financial Accounting Standards Board’s (FASB) Current Expected Credit Loss impairment
standard will require “life of loan” estimates of losses to be recorded at origination and is set to
take effect in January 2020.
• There will be an initial build of the loan loss allowance that will be booked through retained
earnings on a tax adjusted basis.
• After the initial build, additional reserves will be built as loans are originated.
• Regulators have indicated there will be no capital relief or changes to what capital levels are
classified “Well Capitalized”
Initial estimates of fully phased-in CECL (includes impact of expected common dividends and share
repurchases):
December 31, 2020 Current Estimate
Without CECL With CECL
Total Reserve 1.9% 7.2%
Tier 1 Risk Based Capital 12.4% 11.4%
(GAAP Equity + Total Reserve)/Risk Weighted Assets 14.1% 15.3%
• Regulators have proposed that CECL reserves will be phased in over a three-year period.
• Sallie Mae capital ratios will exceed “Well Capitalized” after implementation of CECL.
17Guidance
2019 Targets
Diluted “Core Earnings” Per Share: $1.23 - $1.26
Private Education Loan Originations: $5.7 billion
Non-GAAP Efficiency Ratio: 35-36%11
Long-Term Targets
Prudently grow balance sheet without sacrificing quality
Continue to leverage operating platform and limit operating expense growth
Create long-term value to shareholders with predictable shareholder returns
18Sallie Mae Opportunity: Creating Value while Growing
Market Conservative
Leading Funding and
Brand Underwriting
Strong Consistent
Financial Credit
Returns Performance
19ABS SUPPLEMENT
20Sallie Mae’s Smart Option Loan Product Overview
• The Smart Option loan product was introduced by Sallie Mae in 2009
• The Smart Option loan program consists of:
– Smart Option Interest Only loans - require full interest payments during in-school, grace,
and deferment periods
– Smart Option Fixed Pay loans - require $25 fixed payments during in-school, grace, and
deferment periods
– Smart Option Deferred loans – do not require payments during in-school and grace
periods
• Smart Option payment option may not be changed after selected at origination
• Variable-rate loans indexed to LIBOR, or fixed-rate
• Consumer credit underwriting, with minimum FICO, custom credit score model and
judgmental underwriting
• Marketed primarily through the school channel and also directly to consumers, with all loans
certified by and disbursed directly to schools
• Private education loans are typically non-dischargeable in bankruptcy, unless a borrower can
prove that repayment of the loan would impose an "undue hardship“
21Sallie Mae Bank ABS Summary
14-A 15-A 15-B 15-C 16-A 16-B 16-C 17-A 17-B 18-A 18-B 18-C 19-A
Issuance Date 8/7/2014 4/23/2015 7/30/2015 10/27/2015 5/26/2016 7/21/2016 10/12/2016 2/8/2017 11/8/2017 3/21/2018 6/20/2018 9/19/2018 3/13/2019
Total Bond Amount ($mil) $382 $704 $714 $701 $551 $657 $674 $772 $676 $670 $687 $544 $453
Initial AAA Enhancement (%) 21% 23% 22% 23% 20% 19% 16% 17% 17% 18% 17% 16% 17%
Initial Class B Enhancement (%) 11% 13% 12% 14% 12% 12% 10% 11% 11% 11% 10% 10% 11%
Wtd Avg Spread over Benchmarks
'AAA' Rated A Classes (%) +1.17% +1.01% +1.27% +1.49% +1.38% +1.36% +1.00% +0.82% +0.70% +0.71% +0.66% +0.67% +0.82%
A and B Classes Combined (%) +1.39% +1.28% +1.50% +1.74% +1.60% +1.55% +1.15% +0.93% +0.80% +0.78% +0.76% +0.77% +0.92%
Loan Program (%)
Smart Option 100% 100% 100% 100% 100% 100% 100% 100% 100% 100% 100% 100% 100%
Loan Status (%) 12
School, Grace, Deferment 90% 79% 78% 73% 75% 74% 70% 65% 73% 69% 70% 69% 61%
P&I Repayment 9% 20% 21% 24% 23% 24% 28% 33% 26% 29% 27% 30% 36%
Forbearance 0% 2% 1% 2% 2% 2% 2% 2% 2% 2% 2% 2% 3%
Wtd Avg Term to Maturity (Mo.) 140 133 130 127 135 133 131 131 135 139 139 138 136
% Loans with CoSigner 93% 92% 92% 92% 92% 92% 92% 92% 92% 92% 92% 92% 92%
Not For Profit (%) 89% 86% 87% 87% 87% 87% 89% 90% 91% 91% 91% 91% 91%
Wtd Avg FICO at Origination 13 747 747 746 747 747 747 748 746 747 747 746 746 746
Wtd Avg Recent FICO at Issuance 13 745 744 741 747 743 745 745 744 745 744 742 744 744
Wtd Avg FICO at Origination (Cosigner) 13 750 750 749 750 750 750 750 748 749 748 748 748 748
Wtd Avg Recent FICO at Issuance (Cosigner) 13 748 748 745 750 747 749 748 748 748 747 745 747 748
Wtd Avg FICO at Origination (Borrower) 708 714 715 714 719 719 721 720 723 724 724 724 724
Wtd Avg Recent FICO at Issuance (Borrower) 701 702 699 701 704 708 708 705 707 708 706 709 708
Variable Rate Loans (%) 85% 82% 82% 82% 82% 82% 80% 81% 80% 75% 72% 70% 67%
Wtd Avg Annual Borrower Interest Rate 7.82% 8.21% 8.21% 8.27% 8.22% 8.24% 8.26% 8.39% 8.94% 9.29% 9.58% 9.69% 10.05%
22Sallie Mae Bank ABS Structures
SMB 2019-A SMB 2018-C SMB 2018-B
Size $453.0MM $544.0MM $686.5MM
Pricing Date March 5, 2019 September 12, 2018 June 13, 2018
Smart Option Smart Option Smart Option
Collateral
Private Education Loans Private Education Loans Private Education Loans
Servicer Sallie Mae Bank Sallie Mae Bank Sallie Mae Bank
Overcollateralization 14 10% 10% 10%
Pricing Prepayment Speed 15 8% 8% 8%
Tranche Structure at Issuance
Amt Amt Amt
Class ($mm) Mdy's WAL Pricing Class ($mm) Mdy's WAL Pricing Class ($mm) Mdy's WAL Pricing
A-1 151.00 Aaa 0.99 1mL +35 A-1 177.00 Aaa 0.99 1mL +30 A-1 214.00 Aaa 0.99 1mL +32
A-2A 217.00 Aaa 5.41 IntS +87 A-2A 219.00 Aaa 5.46 IntS +68 A-2A 283.00 Aaa 5.49 IntS +67
A-2B 50.00 Aaa 5.41 1mL +87 A-2B 108.00 Aaa 5.46 1mL +75 A-2B 139.00 Aaa 5.49 1mL +72
B 35.00 Aa3 9.52 IntS +140 B 40.00 Aa2 9.68 IntS +130 B 50.50 Aa2 9.77 IntS +130
WA Borrower Interest Rate 10.05% 9.69% 9.58%
WA FICO at Origination13 746 746 746
% Loans with Cosigner 92% 92% 92%
Variable Rate Loans 67% 70% 72%
23Sallie Mae Bank Servicing Policies
Policy Pre-Spin, Legacy SLM Serviced Post-Spin, Sallie Mae Bank Serviced
Delinquencies All loans serviced by an affiliate of legacy SLM; loan Sallie Mae Bank collects delinquent loans thru charge-off, placing
owned by Sallie Mae Bank sold to legacy SLM after emphasis on returning loans to current status during early
becoming 90+ days past due. delinquency.
Charge-offs Loans serviced by legacy SLM charge off at 212+ Loans serviced by Sallie Mae Bank charge off at 120+ days past
days past due. due.
Recoveries Post-charge off collections managed by legacy SLM; Charged-off loans either collected internally or sold to third
recoveries realized over 10+ years. parties. Recoveries recognized immediately if charged-off loans
sold to third parties.
Forbearance Granted for 3 mo. intervals with a 12 month Granted for 3 mo. intervals with a 12 month maximum, no fee.
maximum, with fee.
Sallie Mae Bank Forbearance Policy -
• First choice is always to collect a payment from the borrower or co-signer
• If payment is not possible, forbearance temporarily provides borrowers limited time to improve their ability to repay
during temporary economic hardship
• The vast majority of loans do not use forbearance; those that do, typically remain in forbearance for less than 12
months
24Sallie Mae Bank Collections
Each customer is approached individually, and the account manager is educated and empowered to identify optimal resolution
• Co-borrowers are contacted and collected with similar efforts as the primary borrower
Sallie Mae Bank employs a front-loaded, stage based collections approach:
• Early Stage Loan Collections (1 – 29 days delinquent as of the first of the month)
– Calling activity begins as early as 1 cycle day behind (5 days past their due date in most instances)
– Dialer based calling and automated messaging are leveraged for early delinquency
– E-mail and letter campaigns complement calling efforts
• Mid-Stage Loan Collections (30 – 59 days delinquent as of the first of the month)
– Continue early stage activities
– Account is assigned to a collector’s queue based on the delinquency and the type of loan. Collection campaign includes
telephone attempts and manual skip tracing
• Late Stage Loan Collections (60+ days delinquent as of the first of the month)
– Continue both early and mid-stage activities
– Tenured route management collectors and customized letter campaigns
Cash collection is the primary focus, but a variety of tools are also available to collectors to aid in resolving delinquency:
– Auto pay – Monthly payment made automatically, prior delinquency cleared with forbearance
– Three Pay – After three scheduled monthly payments are made, prior delinquency cleared with forbearance
– Rate Reduction – Reduce rate for monthly payment relief, enrolled after three qualifying payments
– Rate Reduction with Term Extension – Reduced rate and extended term
– Additional programs are available when all other methods are not adequate
Bankruptcy Collections Policy – Collection activity stops if both parties on the loan file bankruptcy (borrower and cosigner) or on a non-
cosigned loan; otherwise, collections can continue on the non-filing party
25APPENDIX
26Quarterly Financial Highlights
1Q 2019 4Q 2018 1Q 2018
Income Statement ($ millions)
Total interest income $566 $538 $437
Total interest expense 164 155 104
Net interest income 402 383 333
Less: provisions for credit losses 64 58 54
Total non-interest income 16 13 13
Total non-interest expenses 140 146 125
Income tax expense 56 45 41
Net income 158 147 126
Preferred stock dividends 4 4 3
Net income attributable to common stock 154 143 123
“Core Earnings” adjustments to GAAP(18) (3) (5) (3)
Non-GAAP “Core Earnings” net income
attributable to common stock (18) 151 138 120
Ending Balances ($ millions)
Private Education Loans, net $21,577 $20,295 $18,601
FFELP Loans, net 829 848 909
Personal Loans, net 1,093 1,128 657
Deposits 19,664 18,943 16,499
-Brokered 10,576 10,295 8,571
-Retail and other 9,088 8,648 7,928
Key Performance Metrics
Net interest margin 6.28% 6.11% 6.17%
Yield - Total interest-earning assets 8.85% 8.59% 8.11%
-Private Education Loans 9.50% 9.34% 8.84%
-Personal Loans 11.81% 11.60% 10.64%
Cost of Funds 2.81% 2.71% 2.14%
Non-GAAP Operating Efficiency Ratio (11) 33.8% 37.6% 36.5%
Return on Assets (“ROA”) 2.4% 2.2% 2.2%
Non-GAAP “Core Earnings” ROA(20) 2.3% 2.2% 2.2%
Return on Common Equity (“ROCE”) 23.9% 22.6% 23.2%
Non-GAAP “Core Earnings” ROCE(21) 23.4% 21.8% 22.7%
Per Common Share
GAAP diluted earnings per common share $0.35 $0.33 $0.28
Non-GAAP “Core Earnings” diluted
earnings per common share(18) $0.34 $0.31 $0.27
Average common and common equivalent
shares outstanding (millions) 438 440 439
27Enhancing franchise value through a deeper relationship
with clients
Distribution of Sallie Mae Borrowers by Product and Age
100%
93% 95%
91%
90% 87%
83%
80% 79%
73%
70%
64%
% of Borrowers
60% % with a Credit Card
54%
50% % with a Personal Loan
42%
40%
30% 29% 30%
30% 27%
25%
21% 22%
20% 18%
15%
11%
10% 8%
5%
1% 2%
0%
18 19 20 21 22 23 24 25 26 27 28 29
Age of Borrowers
As of 4/30/18
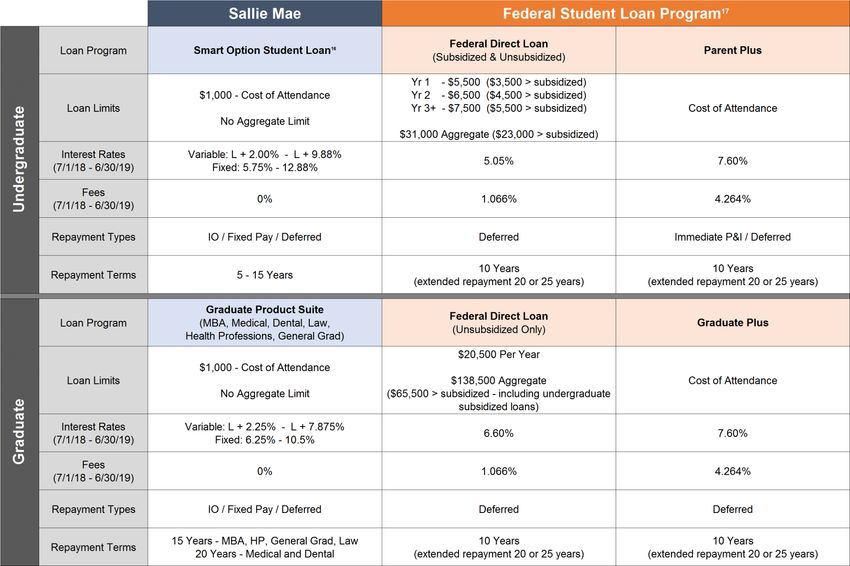
28High Quality Private Education Portfolio
Customer FICO at Original Approval7 Smart Option Payment TypeSallie Mae vs Federal Student Loans
30“Core Earnings” to GAAP Reconciliation
31Important Information Regarding Historical Loan Performance Data
On April 30, 2014 (the “Spin-Off Date”), the former SLM Corporation legally separated (the “Spin-Off”) into two distinct publicly-traded entities: an education loan management, servicing and asset recovery business called Navient
Corporation (“Navient”), and a consumer banking business called SLM Corporation. SLM Corporation’s primary operating subsidiary is Sallie Mae Bank. We sometimes refer to SLM Corporation, together with its subsidiaries and its
affiliates, during the period prior to the Spin-Off as “legacy SLM.”
In connection with the Spin-Off, all private education loans owned by legacy SLM, other than those owned by its Sallie Mae Bank subsidiary as of the date of the Spin-Off, and all private education loan asset-backed securities (“ABS”)
trusts previously sponsored and administered by legacy SLM were transferred to Navient. As of the Spin-Off Date, Navient and its sponsored ABS trusts owned $30.8 billion of legacy SLM’s private education loan portfolio originated both
prior to and since 2009. As of the Spin-Off Date, Sallie Mae Bank owned $7.2 billion of private education loans, the vast majority of which were unencumbered Smart Option Student Loans originated since 2009.
Legacy SLM’s Private Education Loan and ABS Programs Prior to the Spin-Off
In 1989, legacy SLM began making private education loans to graduate students. In 1996, legacy SLM expanded its private education loan offerings to undergraduate students. Between 2002 and 2007, legacy SLM issued $18.6 billion of
private education loan-backed ABS in 12 separate transactions.
In 2008, in response to the financial downturn, legacy SLM revised its private education loan underwriting criteria, tightened its forbearance and collections policies, ended direct-to-consumer disbursements, and ceased lending to
students attending certain for-profit schools. Legacy SLM issued no private education loan ABS in 2008.
In 2009, legacy SLM introduced its Smart Option Student Loan product and began underwriting private education loans with a proprietary custom credit score. The custom credit score included income-based factors, which led to a
significant increase in the percentage of loans requiring a co-signer, typically a parent. The initial loans originated under the Smart Option Student Loan program (the “Interest Only SOSLs”) were variable rate loans and required interest
payments by borrowers while in school, which reduced the amounts payable over the loans’ lives and helped establish repayment habits among borrowers. In 2010, legacy SLM introduced a second option for its Smart Option Student
Loan customers, which required a $25 fixed monthly payment while borrowers were in school (the “Fixed Pay SOSLs”). In 2011, l egacy SLM introduced another option for its Smart Option Student Loan customers, which allowed
borrowers to defer interest and principal payments until after a student graduates or separates from school (the “Deferred SOSLs”). In 2012, legacy SLM introduced a fixed rate loan option for its Interest Only, Fixed Pay and Deferred
SOSLs. Borrowers must select which of these options they prefer at the time of loan origination and are not permitted to change those options once selected.
In 2011, legacy SLM included private education loans originated under the Smart Option Student Loan program in its ABS pools for the first time. Between 2011 and 2014, the mix of Smart Option Student Loans included in legacy SLM’s
private education loan ABS steadily increased as a percentage of the collateral pools, from 10% initially to 64% in later transactions.
Sallie Mae Bank’s Private Education Loan and ABS Programs Post-Spin-Off
Originations. Following the Spin-Off, Sallie Mae Bank continued to originate loans under the Smart Option Student Loan program. As of December 31, 2018, it owned $20.5 billion of private education loans (gross), the vast majority of
which were Smart Option Student Loans originated since 2009, and over 90% of which were originated between 2013 and 2018.
Servicing. Immediately prior to the Spin-Off, Sallie Mae Bank assumed responsibility for collections of delinquent loans on the vast majority of its Smart Option Student Loan portfolio. Following the Spin-Off Date, Navient continued to
service all private education loans owned by the two companies on its servicing platform until October 2014, when servicing for the vast majority of Sallie Mae Bank’s private education loan portfolio was transitioned to Sallie Mae Bank.
Sallie Mae Bank now services and is responsible for collecting the vast majority of the Smart Option Student Loans it owns.
Securitization and Sales. In August 2014, Sallie Mae Bank sponsored its first private education loan ABS, SMB Private Education Loan Trust 2014-A (the “SMB 2014-A transaction”). Because this transaction occurred prior to the transfer
of loan servicing from Navient to Sallie Mae Bank, Sallie Mae Bank acted as master servicer for the transaction and Navient as subservicer, and the loan pool is serviced pursuant to Navient servicing policies. In April 2015 and October
2015, Sallie Mae Bank sponsored securitizations and residual sales, SMB Private Education Loan Trust 2015-A and SMB Private Education Loan Trust 2015-C, respectively. Sallie Mae Bank also sponsored on-balance sheet term
securitizations as follows:
Date Transaction Date Transaction Date Transaction
July 2015 SMB Private Education Loan Trust 2015-B May 2016 SMB Private Education Loan Trust 2016-A February 2017 SMB Private Education Loan Trust 2017-A
July 2016 SMB Private Education Loan Trust 2016-B October 2016 SMB Private Education Loan Trust 2016-C November 2017 SMB Private Education Loan Trust 2017-B
March 2018 SMB Private Education Loan Trust 2018-A June 2018 SMB Private Education Loan Trust 2018-B September 2018 SMB Private Education Loan Trust 2018-C
March 2019 SMB Private Education Loan Trust 2019-A
Sallie Mae Bank services the loans in all of the securitizations it has sponsored following the SMB 2014-A transaction.
Additional Information. Prior to the Spin-Off, all Smart Option Student Loans were originated and initially held by Sallie Mae Bank, as a subsidiary of legacy SLM. Sallie Mae Bank typically then sold certain of the performing Smart Option
Student Loans to an affiliate of legacy SLM for securitization. Additionally, on a monthly basis Sallie Mae Bank sold all loans that were over 90 days past due, in forbearance, restructured or involved in a bankruptcy to an affiliate of legacy
SLM. As a result of this second practice, prior to the occurrence of the Spin-Off, historical performance data for Sallie Mae Bank’s Smart Option Student Loan portfolio reflected minimal later stage delinquencies, forbearance or charge-
offs.
Legacy SLM collected Smart Option Student Loans pursuant to policies that required loans be charged off after 212 days of del inquency. In April 2014, Sallie Mae Bank began collecting the vast majority of its Smart Option Student Loans
pursuant to policies that required loans be charged off after 120 days of delinquency, in accordance with bank regulatory gui dance. For the reasons described above, a portion of Sallie Mae Bank’s historical performance data does not
reflect current collections and charge off practices and may not be indicative of the future performance of the Bank’s Smart Option Student Loans.
32Important Information Regarding Historical Loan Performance Data
(cont.)
Types of Smart Option Student Loan Portfolio Data
The portfolio data we used in this report comes from two separate sources of information:
(1) Combined Smart Option Student Loan Portfolio Data for Legacy SLM, Navient and Sallie Mae Bank. Information in this category is presented on a combined basis for loans originated under the Smart Option Student Loan program,
whether originated by Sallie Mae Bank when it was part of legacy SLM or by Sallie Mae Bank post Spin-Off, and regardless of whether the loan is currently held by an ABS trust, or held or serviced by Navient or Sallie Mae Bank. Data in this
category is used in the tables below under the following headings:
• “Cumulative Defaults by P&I Repayment Vintage and Years Since First P&I Repayment Period” – Only for 2010-2014 P&I Repayment Vintages
This combined Smart Option Student Loan portfolio data provides insight into gross defaults of the covered vintages of Smart Option Student Loans since 2010, regardless of ownership or servicing standard. Data available for earlier
periods includes a limited number of Smart Option Student Loan product types.
Loans contained in the combined Smart Option Student Loan portfolio category were serviced by legacy SLM prior to the Spin-Off, and by either Navient or Sallie Mae Bank after the Spin-Off. As noted above, loans serviced by legacy SLM
and Navient were serviced pursuant to different policies than those loans serviced by Sallie Mae Bank after the Spin-Off. Specifically, legacy SLM charged off loans after 212 days of delinquency, and Navient has continued this policy.
Sallie Mae Bank currently charges off loans after 120 days of delinquency. All loans included in the combined Smart Option Student Loan portfolio that were serviced by legacy SLM prior to the Spin-Off were serviced pursuant to a 212-day
charge off policy. Following the Spin-Off, a portion of the loans included in the combined Smart Option Student Loan portfolio data have been serviced by Navient pursuant to a 212-day charge off policy, and a portion have been serviced by
Sallie Mae Bank pursuant to a 120-day charge off policy. As a result, future performance of loans serviced by Sallie Mae Bank may differ from the historical performance of loans reflected in this combined Smart Option Student Loan
portfolio data.
(2) Smart Option Student Loan Portfolio Data for Sallie Mae Bank Serviced Loans. Information in this category is presented for loans originated under the Smart Option Student Loan program, whether originated by Sallie Mae Bank when it
was part of legacy SLM or by Sallie Mae Bank post Spin-Off, and regardless of whether the loan is currently held by an ABS trust. All loans in this category are serviced by Sallie Mae Bank. Data in this category is used in the tables below
under the following headings:
• “Cumulative Defaults by P&I Repayment Vintage and Years Since First P&I Repayment Period” – Only for 2015-2018 P&I Repayment Vintages
In relation to cumulative defaults, the Sallie Mae Bank Serviced portfolio data provides insight into gross defaults of the Smart Option Student Loans covered and serviced by Sallie Mae Bank since 2015, regardless of ownership. We believe
historical loan performance data since 2015 is more representative of the expected performance of Smart Option Student Loans to be included in new Sallie Mae Bank trusts than data available for earlier periods.
Loans contained in the Smart Option Student Loan Portfolio Data for Sallie Mae Bank Serviced Loans category were serviced by legacy SLM prior to the Spin-Off, and by Sallie Mae Bank after the Spin-Off. Sallie Mae Bank currently
charges off loans after 120 days of delinquency.
Any data or other information presented in the following charts is for comparative purposes only, and is not to be deemed a part of any offering of securities.
A significant portion of the Smart Option Student Loan performance data described above is provided to Sallie Mae Bank by Navient under a data sharing agreement executed in connection with the Spin-Off. This data
sharing agreement expires on April 29, 2019 and, as a result, cumulative gross default data for pre-2015 P&I Repayment Vintages is held static as of December 31, 2018. Under the data sharing agreement, Navient makes no
representations or warranties to Sallie Mae Bank concerning the accuracy and completeness of information that it provided. Sallie Mae Bank has not independently verified, and is not able to verify, the accuracy or
completeness of the data provided under the agreement.
33Smart Option Loan Program Cohort Default Curves
Terms and calculations used in the cohort default curves are defined below:
First P&I Repayment Period – The month during which a borrower is first required to make a full principal and interest payment on a loan.
P&I Repayment Vintage – The calendar year of a loan’s First P&I Repayment Period.
Disbursed Principal Entering P&I Repayment – The total amount of disbursed loan principal in a P&I Repayment Vintage, excluding any interest
capitalization.
Reported Default Data –
o For loans that default after their First P&I Repayment Period: Loans enter a particular annual P&I Repayment Vintage at different times during the
P&I Repayment Vintage year. Default data is not reported for loans in a particular annual P&I Repayment Vintage until the First P&I Repayment Period
has occurred for all loans in that annual P&I Repayment Vintage. Once reporting starts, data reflects defaults that occurred in a particular period
through the number of months since December 31 of that annual P&I Repayment Vintage year. For example, in the relevant charts and tables included
in this presentation as of March 31, 2019: (i) default data reported for loans in the 2018 P&I Repayment Vintage represents defaults occurring during
the first 3 months after a loan’s First P&I Repayment Period regardless of the month in 2018 during which the first full principal and interest payment for
that loan became due; and (ii) default data for loans in the 2017 P&I Repayment Vintage represents defaults occurring during the first 15 months after a
loan’s First P&I Repayment Period regardless of the month in 2017 during which the first full principal and interest payment for that loan became due.
o For loans that default prior to their First P&I Repayment Period: Loans defaulting prior to their First P&I Repayment Period are included in the P&I
Repayment Vintage corresponding to the calendar year in which the default occurs, and are aggregated and reported in Year 0 of that P&I Repayment
Vintage in the relevant charts and tables. For example: (a) if a loan’s First P&I Repayment Period was scheduled for 2018, but the loan defaulted in
2017, the default amount is reflected in Year 0 of the 2017 P&I Repayment Vintage; and (b) if a loan’s First P&I Repayment Period occurred in 2018,
but the loan defaulted in 2018 before that First P&I Repayment Period, the default amount is reflected in Year 0 of the 2018 P&I Repayment Vintage.
o For loans that pay off prior to their First P&I Repayment Period: Loans paid off prior to their First P&I Repayment Period are included in the
Disbursed Principal Entering P&I Repayment of the P&I Repayment Vintage corresponding to the calendar year in which the payoff occurs.
Periodic Defaults – For any loan in a particular P&I Repayment Vintage, the defaulted principal and interest is reflected in the year corresponding to the
number of years since the First P&I Repayment Period for that loan.
Cumulative Defaults – At any time for a particular P&I Repayment Vintage, the cumulative sum of Periodic Defaults for that vintage.
o Defaulted principal includes any interest capitalization that occurred prior to default
o Defaulted principal is not reduced by any amounts recovered after the loan defaulted
o Because the numerator includes capitalized interest while the denominator (i.e., Disbursed Principal Entering P&I Repayment) does not, default rates
are higher than they would be if the numerator and denominator both included capitalized interest
Note: Cumulative gross default data for pre-2015 P&I Repayment Vintages is held static as of December 31, 2018. Historical trends suggested by the cohort default triangles may not be indicative of future
performance. Legacy SLM and Navient serviced loans were serviced pursuant to a 212 day charge-off policy. Sallie Mae Bank serviced loans were serviced pursuant to a 120 day charge-off policy.
34Footnotes:
1. Source: MeasureOne CBA Report as of December 2017
2. U.S. Bureau of Labor Statistics, Current Population Survey
3. Source: Trends in Student Aid,© 2017 The College Board, www.collegeboard.org, U.S. Department of Education 2017
4. Source: U.S. Bureau of Labor Statistics- “More education: Lower unemployment, higher earnings” as of March 2019
5. Source: Trends in Student Aid,© 2017 The College Board, www.collegeboard.org, U.S. Department of Education 2017
6. Originations represent loans that were funded or acquired during the period presented.
7. Represents the higher credit score of the cosigner or the borrower.
8. For important information regarding historical performance data and an explanation of the data and calculations underlying this chart, see pages 32-34.
9. For 2010-2014 P&I Repayment Vintages Only- Data static as of December 31, 2018 for Legacy SLM, Navient and Sallie Mae Bank serviced portfolios
combined. Certain data used in the charts above was provided by Navient under a data sharing agreement which expires on April 29, 2019 (see page 33 for
more details). Sallie Mae Bank has not independently verified, and is not able to verify, the accuracy or completeness of the data provided under the
agreement.
10. For 2015-2018 P&I Repayment Vintages Only- Data as of March 31, 2019 for Sallie Mae Bank serviced loans only – All loans covered are serviced by
Sallie Mae Bank, regardless of whether the loans were originated by Sallie Mae Bank when it was part of legacy SLM, or by Sallie Mae Bank post Spin-Off,
and regardless of whether the loans were included in an ABS trust. Note: Legacy SLM and Navient portfolio serviced pursuant to a 212 day charge-off policy.
Sallie Mae Bank portfolio serviced pursuant to a 120 day charge-off policy. Historical trends may not be indicative of future performance.
11. We calculate and report our non-GAAP operating efficiency ratio as the ratio of (a) the total non-interest expense numerator to (b) the net revenue
denominator (which consists of the sum of net interest income, before provision for credit losses, and non-interest income, excluding any gains and losses on
sales of loans and securities, net and the net impact of derivative accounting as defined in the "‘Core Earnings’ to GAAP Reconciliation" table on page 31).
We believe doing so provides useful information to investors because it is a measure used by our management team to monitor our effectiveness in
managing operating expenses. Other companies may use similarly titled non-GAAP financial measures that are calculated differently from the way we
calculate our ratio. Accordingly, our non-GAAP operating efficiency ratio may not be comparable to similar measures used by other companies.
12. Smart Option loans considered in ‘P&I Repayment’ only if borrowers are subject to full principal and interest payments on the loan.
13. Represents the higher credit score of the cosigner or the borrower. Note: Pool characteristics as of the Statistical Cutoff Date for the respective transaction
14. Overcollateralization for Class A & B bonds
15. Estimated based on a variety of assumptions concerning loan repayment behavior. Actual prepayment rate may vary significantly from estimates.
16. Private education loans are typically non-dischargeable in bankruptcy, unless a borrower can prove that repayment of the loan imposes an "undue hardship“.
17. Source: U.S. Department of Education, Office of Federal Student Aid, https://studentaid.ed.gov/sa/types/loans
18. The difference between “Core Earnings” and GAAP net income is driven by mark-to-market unrealized gains and losses on derivative contracts recognized in
GAAP, but not in “Core Earnings” results. See page 31 for a reconciliation of GAAP and “Core Earnings”. Derivative Accounting: “Core Earnings” exclude
periodic unrealized gains and losses caused by the mark-to-market valuations on derivatives that do not qualify for hedge accounting treatment under GAAP,
but include current period accruals on the derivative instruments. For periods prior to July 1, 2018, “Core Earnings” also exclude the periodic unrealized gains
and losses that are a result of ineffectiveness recognized related to effective hedges under GAAP, net of tax. Under GAAP, for our derivatives held to
maturity, the cumulative net unrealized gain or loss over the life of the contract will equal $0.
19. “Core Earnings” tax rate is based on the effective tax rate at the Bank where the derivative instruments are held.
20. We calculate and report our non-GAAP “Core Earnings” Return on Assets (“ROA”) as the ratio of (a) “Core Earnings” net income numerator (annualized) to
(b) the GAAP total average assets denominator.
21. We calculate and report our non-GAAP “Core Earnings” Return on Common Equity (“ROCE”) as the ratio of (a) “Core Earnings” net income attributable to
common stock numerator (annualized) to (b) the net denominator, which consists of GAAP total average equity less total average preferred stock.
35You can also read