Rheological Characterization of Yield-Stress Fluids with Brookfield Viscometer
←
→
Page content transcription
If your browser does not render page correctly, please read the page content below
Appl. Rheol. 2021; 31:1–9

Research Article

Andrei Potanin* and Greggory Marron

Rheological Characterization of Yield-Stress Fluids
with Brookfield Viscometer
https://doi.org/10.1515/arh-2021-0001 industry. However, one must keep in mind that the inter-
Received Aug 08, 2020; accepted Feb 08, 2021 nal data processing software implemented in Brookfield
 viscometers assumes Newtonian properties of the tested
Abstract: This paper analyzes various techniques to use
 fluids. This does not prevent many researchers from ap-
viscometers equipped with vane spindles to characterize
 plying it wider in which case the viscometer works as an
rheological properties of yield stress fluids. Specifically, ap-
 indexer, i.e., the measurement has only comparative mean-
plication of Brookfield viscometers to this end is discussed.
 ing, not delivering objective, frame-invariant rheological
A wide selection of toothpastes and lotions were tested. It is
 parameters.
shown that a simple method based on apparent shear rate
 Brookfield viscometers work as any strain-controlled
and stress, commonly referred to as a representative vis-
 rheometers – since they apply angular velocity (reported
cosity method, works well for moderately non-Newtonian
 in rotation-per-minute units, RPM) and measure torque (re-
samples but may significantly underestimate viscosity for
 ported in percentage of the maximum torque specific for
samples with a more pronounced yield stress behavior. To
 the given type of the instrument). Then they convert thus
get more accurate data an integral equation relating torque
 measured torque into viscosity based on the calibration
to angular velocity needs to be solved which can be easily
 for a Newtonian standard. Mitschka [2] and Wein et al. [3]
done numerically to get a good agreement between the data
 suggested a method to modify this approach so as to make
collected on an inexpensive viscometer and the data from
 it applicable to power-law fluids. The conversion they sug-
high-end rheometers.
 gested works for disk spindles. This method (often referred
Keywords: yield stress, vane, Brookfield viscometer, tooth- to as “Mitschka method”) has gained some popularity and
paste there were examples of its successful applications in the
 food industry in particular – (see, e.g., Briggs and Steffe [4]).
 However, for the fluid which exhibits yield stress, i.e., vis-
 cosity going to infinity at a certain stress, parametrization
1 Introduction
 in terms of power laws is clearly insufficient. Besides, disk
 spindles are not optimal for testing such fluids because of
Brookfield viscometers (currently manufactured by AMTEK)
 the slippage on the surface and significant disturbance of
are ubiquitous in food and consumer product industries
 the sample caused by the disk immersion into the sample.
as well as many others. They are simple to use, inexpen-
 There are two most often used tools available for Brookfield
sive and reliable. The most widely used setup in industry
 viscometers suitable for characterization of yield stress flu-
is based on spindle immersion technique whereby viscos-
 ids: T-bar and vane. Anderson and Meeten [5] presented an
ity is measured by immersing a spindle into a cup with
 extensive analysis of how the data obtained with T-bar tools
a product. The most used spindles are disks and T-bars
 can be converted into meaningful rheological parameters
(RV and T-types in Brookfield manuals [1]). While there are
 in terms of Herschel-Bulkley equation rather than reporting
attachments which allow using these viscometers to per-
 them as some “viscosities” indexes.
form more rigorously defined rheological measurements
 Vanes stand somewhat apart because Brookfield intro-
(narrow-gap concentric cylinders or cone-plate) this im-
 duced a separate test marketed as “yield stress test” which
mersion technique remains by far the most widely used in
 is essential a step-shear test in which the stress measured at
 a certain angular velocity is interpreted as the yield stress.
 This approach has some merit as long as the tests are per-
*Corresponding Author: Andrei Potanin: Colgate-Palmolive formed at low RPMs. More generally, one would want to
Co., 909 River Rd., Piscataway, NJ 08855, United States of America; be able to obtain the full flow curve to which end RPM and
Email: andrei_potanin@colpal.com
 torque has to be converted into shear rate and shear stress.
Greggory Marron: Colgate-Palmolive Co., 909 River Rd., Pisca-
taway, NJ 08855, United States of America

 Open Access. © 2021 A. Potanin and G. Marron, published by De Gruyter. This work is licensed under the Creative Commons
Attribution 4.0 License
2 | A. Potanin and G. Marron

 Vane geometry was used to characterize yield stress plier constant” or YMC for the yield stress in the language
materials for a fairly long time – see Nguen and Boger [6] of Brookfield manuals [1]).
and references therein. It is widely used in industry to char- It should be made clear that the goal of this paper is
acterize food, cosmetics, toothpastes and many other prod- not to study in detail the accuracy of the Couette analogy
ucts [7–9]. The conversion of angular velocity and torque in general but rather to see how well it works with respect
to shear rate and stress is usually justified by an assump- to the specific example of Brookfield rheometry and what
tion that the flow pattern around the vane closely follows error one can expect to get when using single-point version
the one around an encompassing cylinders, the “Couette of it as opposed to the multiple-point one. We will show
analogy” as some researches refer to this assumption [10]. that the full use of the Couette analogy and appropriate
It was vigorously defended by some researchers [11, 12] and data processing allows getting flow curves on these inex-
disputed by others [13–15]. If one takes the Couette analogy pensive viscometers which are fairly close to what one gets
for granted, the conversion of angular velocity and torque when using high-end rheometers with standard rheometric
to shear rate and stress can be done by using one of many tools. This will be demonstrated using variety of consumer
approximations for a particular type of fluids (see any of products, toothpastes and lotions, as examples.
multiple textbooks, such as [16], or recent studies, (e.g.,
[10, 17])).
 All the criticism of vane geometry as a rheological tool
notwithstanding, there is no doubt that (1) Brookfield vis-
 2 Materials and Methods
cometry with the vane tool will continue being used in
industry as the main tool of characterization of strongly 2.1 Materials
shear-thinning fluids and that (2) Couette analogy will con-
 All tests reported in this paper were performed on commer-
tinue being used for processing the data. Accurate appli-
 cially available products, toothpaste and lotions, listed in
cation of the Couette analogy to non-Newtonian fluids, of
 Table 1. Hereafter they will be referred to by their numbers,
course, requires multiple-point measurement and the cor-
 1 through 15. The first eleven were toothpastes, the other
responding data processing in which readings at several
 four were lotions.
different angular velocities are used to determine the full
flow curve. However, in industry users often prefer to get a
single-point reading of viscosity or yield stress to which end
 2.2 Methods
a simplified conversion is used, sometimes using built-in
conversion factors of the viscometer (the so-called “spindle The products were tested on a rheometer, ARG2, by TA
multiplier constant” or SMC for viscosity and “yield multi- Instruments using Couette (concentric cylinders, the so-

Table 1: Tested products.

 Sample ID Manufacturer Brand Type of product
 #1 Colgate-Palmolive Baking Soda toothpaste
 #2 Colgate-Palmolive Clean Mint toothpaste
 #3 Colgate-Palmolive Max Fresh toothpaste
 #4 Colgate-Palmolive Triple Action toothpaste
 #5 Colgate-Palmolive Cavity Protection toothpaste
 #6 P&G Crest whitening scope toothpaste
 #7 GSK Sensodyne Repair & Protect toothpaste
 #8 GSK Sensodyne Max Strength Original toothpaste
 #9 GSK Aquafresh Extreme Clean toothpaste
 #10 Colgate-Palmolive Total Advanced toothpaste
 #11 P&G Crest 3D toothpaste
 #12 Elta MD Moisture Rich Body cream lotion
 #13 Elta MD Face and Body lotion
 #14 La Roche-Posay Daily Repair lotion
 #15 Bioelements Emollient Body Moisturizer lotion
Rheological Characterization of Yield-Stress Fluids with Brookfield Viscometer | 3

Table 2: Parameters of Brookfield viscometers and vane spindles. Also listed are various conversion constants as explained in the text.
Spindle to cup diameter ratio 0.1 is assumed.

 Instrument spring torque vane length vane diameter SS TK SRC SMC
 and spindle (mN*m) (cm) (cm)
 HB, v72 5.7496 4.333 2.167 1.799 8 0.107 9.111
 HB, v73 5.7496 2.535 1.267 8.995 8 0.107 45.554
 HB, v74 5.7496 1.176 0.589 89.718 8 0.107 454.379
 HA, v72 1.4374 4.333 2.167 0.450 2 0.107 9.111
 HA, v73 1.4374 2.535 1.267 2.249 2 0.107 45.554
 HA, v74 1.4374 1.176 0.589 22.430 2 0.107 454.379
 RV, v72 0.7187 4.333 2.167 0.225 1 0.107 9.111
 RV, v73 0.7187 2.535 1.267 1.124 1 0.107 45.554
 RV, v74 0.7187 1.176 0.589 11.215 1 0.107 454.379

called DIN standard) geometry. Serrated cup and cylinder natively, Brookfield Rheocalc software can be used to this
were used to avoid slippage. Shear rate sweeps were per- end). Conversion of RPM and torque into frame-invariant
formed starting 30 to 0.1 sec−1 , 10 logarithmic steps per rheological parameters, shear rate and stress, is discussed
decade, 20 sec per step while stress was measured by av- in the next sub-section.
eraging the last 10 sec of each step. Thus measured down- All the aforementioned rheometers and viscometers
shear flow curve may be thought of as an approximation were calibrated on Newtonian standard fluids by TA Instru-
to the true equilibrium curve although the latter may re- ments and Amtek/Brookfield specialists respectively follow-
quire much longer pre-shear for thixotropic systems. One ing standard protocols, i.e., using cone-plate geometries
of us discussed this issue in greater details in [18] where for the rheometers and disk spindles for the viscometers.
5 minutes pre-shear at 30 sec−1 was found necessary to
accurately predict flow patterns of similar systems (tooth-
pastes) pumped through long pipes. Generally, tests pro- 2.3 Data processing
tocol should be adjusted to fit a particular application. In
the context of the current work this simplified protocol For Couette geometry of concentric cylinders (or any other
was used because it fairly well represents a typical quality which fits the ‘Couette analogy” as described in the Intro-
control test in industrial environment which usually is not duction) most commercial rheometrical software use a con-
conducive to time consuming tests. Below we will briefly version of angular velocity, Ω, and torque, T, into shear rate,
illustrate thixotropic effect by showing a typical stress over- ˙ , and stress, σ, which can be written for their “apparent”
shoots in step-shear tests at 30 sec−1 to which end a differ- values as follows [19]:
ent rheometer was used (ARES-G2, also of TA Industries)
 2Ω C s 2T
because it is better suited for such transient tests. ˙ app = C s , σ app = (1)
 1 − κ2 C ee πLD2
 The flow curves measured on the rheometer were com-
pared to measurements on Brookfield DV2T viscometers. where L and D are the length and diameter of the internal
Two types of viscometers were used, HA and HB which dif- cylinder, κ is the ratio of the internal to external cylinder.
fer in the strength of their spring (see Brookfield manual). Also, there are two coefficients introduced here: Cs is the
Two types of vane spindles were used, V74 and V73. The big- so-called shift factor introduced to account for the fact that
ger one, V73, was used with HB viscometer and the smaller shear is shifted deeper into the gap and C ee is the coefficient
one, V74 – with HA viscometer. The dimensions of the spin- accounting for end effects. For the former the following
dles and other parameters of the instruments are listed in approximation is often used [20]:
Table 2 which also contains conversion coefficients defined
 C s = (1 + κ2 )/2 (2)
below. The tests on Brookfield viscometers emulated the
tests on the rheometer, i.e., RPM (rotation per minute) was Note that the above equations are identical to those imple-
swept from 200 down to 0.5 with 20 sec per point in 25 mented in the software for TA Instruments rheometers (see
logarithmic steps. Torque on the spindle shaft is recorded the definitions of the strain and stress factors in the man-
in percentage points with an in-house software (or, alter- uals [19] available for download on TA Instruments site)
4 | A. Potanin and G. Marron

except that by default C ee is set to 1 thus neglecting end equation had n=0.5, most of the actual pastes and lotions
effects which leads to somewhat overestimated stress. To we are dealing with here are better fitted with lower n val-
better estimate these coefficients we used different proce- ues because their flow curves are less “bended” as will be
dures depending on the gap width. For narrow-gap (DIN) clear below. This approach was used in [18] to compare
geometry calculations performed by Wein et al. [21] may equilibrium flow curves obtained with vane and DIN ge-
be parametrized into the following polynomial of the flow ometries confirming that both are indeed very close (except
index, N, of the fluid (assuming a power law, σ ∼ ˙ N ) that there was a misprint in Eqs. (1), but the calculations
 were correct).
 C ee = −0.0214N 3 + 0.1339N 2 − 0.2975N + 1.27. (3) The above equations are valid for both the actual con-
 centric cylinders geometry and the vane-in-cup geometry
Thus, it varies between 1.085 for a Newtonian fluid up to 1.27
 as long as the Couette analogy is valid. Thus, it will be ap-
for a yield-stress flow. For the case of an isolated cylinder
 plied here to the narrow-gap (DIN) geometry used on the
(or any other tool which can be approximated as a cylinder,
 TA Instruments rheometer as well as to the immersion vane
say, vane) Nguen and Boger [6] suggested a simple estimate
 geometry of Brookfield tests. Here, before turning to the ac-
based on an assumption that shear occurs right on the
 tual data analysis, it is worthwhile to recall basic features,
surface of that cylinder:
 notations and terminology specific to Brookfield viscome-
 C ee = 1 + 2R/3L. (4) ters. As already mentioned above, they report data in terms
 of torque in percentage points, T%, of its maximum torque,
Eqs. (1–4) represent a typical single-point data processing T m , as a function of the applied angular velocity which is
method whereby a measurement at a certain angular ve- defined in the units of RPM. Brookfield manual and its inter-
locity is used to calculate the shear rate and stress approxi- nal software relates rheological parameters to T% and RPM
mately corresponding to the condition of this test. This ap- by means of several coefficients tabulated in the manuals.
proximation becomes less accurate as the flow approaches Thus, the apparent values of the shear stress, viscosity and
the yield point in which case the shear actually occurs on shear rate are defined as follows:
the surface of the tool or very close to it. In that case a
multiple-point test is required. The most commonly used σ app (Pa) = SS * T%, (7)
ones assume a power law dependence of stress on shear T%
 η app (Pa * s) = TK * SMC ,
rate or the Bingham equation for the yield-stress materi- 10 * RPM
 −1
als (see, [e.g., 16] or some more recent works [10, 17]). Here ˙ app (sec ) = SRC * RPM
we use the most basic method which relies on the general
 Here SS may be called “stress constant”, SRC is the “shear
equation relating angular velocity to torque [16]:
 rate constant”, SMC is the “spindle multiplier constant”
 ∫︁σ w and TK is a constant which defines the type of the instru-
 ˙ (σ)
 Ω= dσ (5) ment. Note that here we use SI units for viscosity as opposed
 2σ
 max (σ y ,κ2 σ w ) to centipoise used by Brookfield (cP=0.001 Pa*s). Brook-
 field manuals do not actually list SS, but SRC and SMC are
where σ w = 2C e T/πLD2 is the stress on the wall of the tabulated along with TK. Comparing (7) to (1) one comes to
rotating cylinder and σ y is the yield stress. The simplest the following definitions:
way of using eq. (5) is to directly fit the T(Ω) data using it
in combination with an appropriate constitutive equation, C s 2T m
 SS = 0.01 , (8)
 C ee πLD2
e.g., the generalized Casson equation which may be written π
as follows: SRC = C s ,
 15(1 − κ2 )
 [︁ )︀n ]︁1/n SS
 σ = σ ny + η∞ ˙ SMC = 10
 (︀
 (6) TK * SRC

where η∞ and n are fitting parameters along with the yield Table 2 gives the calculated values of these coefficients
stress. This approach is preferred as long as the postulated for different combinations of the type of the viscometer
constitutive equation is flexible enough to cover properties and spindles as they are defined by Brookfield. Spindle-
of all fluids which are being tested. Having the exponent to-cup diameter ratio, κ, is assumed here to be 0.1 which
n as a fitting parameter provides the required flexibility. roughly corresponds to a typical measurement (although
Indeed, this exponent defines the shape of the flow curve. the correction to the “infinite sea” case of κ=0 is only 1%
While Bingham equation had n=1 and the original Casson and negligible). Note that SMC value given in Brookfield
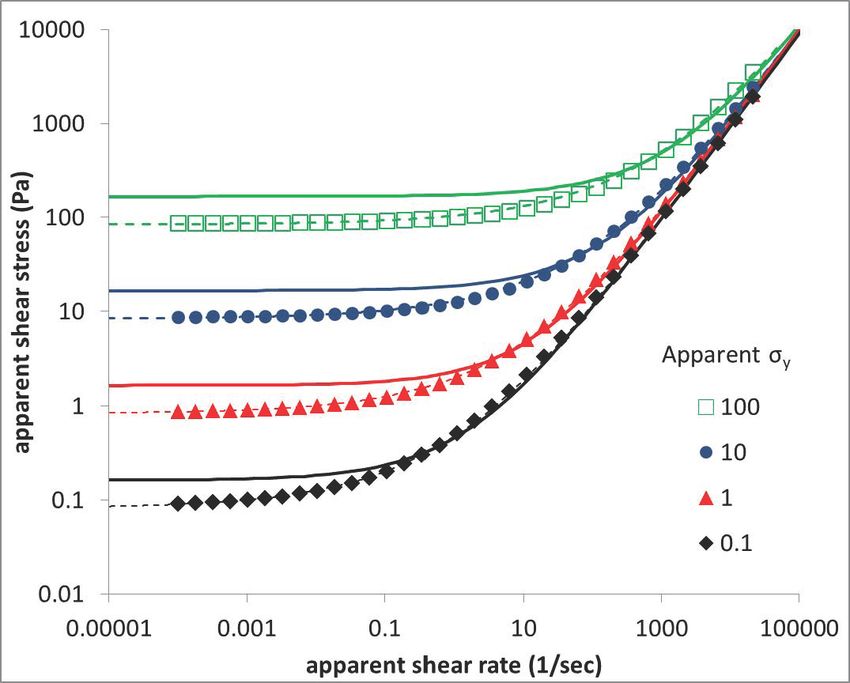
Rheological Characterization of Yield-Stress Fluids with Brookfield Viscometer | 5

manuals (Table D1) is roughly close to what one would such tests can be performed and may be important for cer-
get from eq. (8) if end effects are neglected while other tain applications, in the context of this work relatively short
constants are not defined at all (their Table D1 gives SRC=0 20-second-per-point test suffices. This allows to wipe-out
presumably implying that shear rate cannot be defined). the history of the sample loading into the narrow-gap DIN
 geometry and represents a typical condition for a quality
 control test like those performed with Brookfield viscome-
 ters. In the next sections we will show that the results of
3 Results such tests performed on a rheometer with the standard
 DIN geometry agree quite well with those performed on a
3.1 Transient step-shear tests Brookfield viscometer using immersion vane geometry.

Before comparing the flow curves obtained on different
devices and their processing, let us first take a look at the 3.2 Flow curves-measurements and
simple transient step-shear test in which a constant angular
 processing
velocity is applied from rest. ARES-G2 rheometer was used
to run this test with a vane. This strain-controlled rheometer Examples of the experimentally determined flow curves
is best suited for such tests as it reaches the pre-set angular as well as theoretical calculations are given in Figure 2
velocity (or apparent shear rate) in around 0.03 sec (ARG2 for 6 selected toothpastes and two lotions. Experimental
would take 10 times longer and Brookfied about 100 times points represent the data obtained with Brookfield (filled
longer than that). The results for the three products of our symbols) and ARG2 rheometer (empty symbols). All these
lists are shown on Figure 1. The stress overshoot represents experimental points are the apparent values calculated
a typical response of a thixotropic material to shear. As one from the angular velocity and torque according to eqs. (1)
can see, at this shear rate the overshoot is passed in less through (4). Brookfield data were obtained with HA/V74
than 1 sec and subsequently a gradual decline of stress pro- or HB/V73 viscometer/spindle combination. Tests on TA
ceeds for an extended period. In a previous work [18] one rheometer were performed using the narrow-gap Couette
of us have studied similar systems applying long pre-shear (DIN) geometry.
prior to running the down-shear sweep to get the best ap- As one can see, for weakly non-Newtonian samples
proximation to the equilibrium flow curve as was necessary (Figure 2(a)) apparent data obtained on Brookfield and
to correctly calculate pressure drop in a long pipe. While ARG2 rheometer agreed quite well. In these cases, no fur-
 ther actions would be required- apparent values work just
 fine. However, for stronger shear thinning samples Brook-
 field considerably underestimated the shear stress, if one
 uses the conversion based on apparent values as defined by
 Eqs. (1–4). In other words, one cannot rely on the apparent
 values to interpret such data. The multi-point data fitting
 procedure should be used instead. It works as follows.
 Instead of working with the apparent variables, the raw
 data, Ω and T, were used directly (the latter are, of course,
 proportional to the former according to eq. (1)). Thus, T(Ω)
 is calculated according to eq. (5) with the function (6) de-
 fined by three fitting parameters, σ y , η∞ and n. Then the
 fitting parameters are screened to minimize the standard
 deviation from the experimental data. Logarithmic vari-
 ables, Log(T) and Log(Ω), were fitted which gives closer fit
 than when using linear ones. The calculated curves with
 the best fit parameters are shown as dashed curves on Fig-
Figure 1: Transient step-shear tests for three selected samples at
30 sec−1 . The tests were performed on ARES G2 rheometer which at- ure 2. Here, for convenience, Ω and T where converted back
tains the pre-set shear rate at or before 0.03 sec. Typical thixotropic into the apparent shear rate and stress by eq. (1). Once the
stress overshoot is followed by a steady decline of stress as the sys- best fit values of the fitting parameters are determined, the
tem approaches equilibrium. As explained in the text, the reading is “true” flow curves are calculated by substituting them into
teaken by averaging the segment between 10 and 20 sec.
 Eq. (6) – those are the solid curves shown on Figure 2. They
6 | A. Potanin and G. Marron

Figure 2: Experimental and calculated flow curves for selected samples from Table 1. Data for pastes (a,b,c) were obtained with HA/V74
setup, for lotions (d) – with HB/V73. As an example of how the measurements compare, for one sample, #9, both HB/V73 (in green) and
HA/V74 are shown. HA or HB symbols here indicate the type of the viscometer spring, while V74 or V73 – the type of the vane as defined in
Table 2. Empty symbols on the plots are ARG2 rheometer data, filled symbols – Brookfield viscometers data. Dashed curves fit the latter to
predict the former- solid curves are the predictions.

indeed very well approximate the actual measurements on values calculated with eq. (6) at the same shear rates with
ARG2 rheometer. the best-fit parameters σ y , η∞ and n, and σ aver is the av-
 One can see that for the 6 examples on Figure 2 the erage of all σ exp . For all the tested samples, the best-fit
agreement between the predicted “true” flow curves calcu- parameters are listed in Table 3 along with R2. For most of
lated from Brookfield data and the actual curves obtained these samples the agreement is good. Also listed are the
on ARG2 rheometer is quite good. Prediction quality can be percentage of points “in spec”, i.e., those which correspond
quantified in terms of the coefficient of determination, R2 , to torque of 10% of T m or higher. For some pastes and most
defined as of the lotions when measured on HA viscometer this num-
 ber gets rather low, but, curiously enough, the fit often
 R2 = 1 − (σ exp − σ th )2 / (σ exp − σ aver )2
 ∑︁ ∑︁
 remains good. This is the case with sample #9 for which
where summation is performed over all experimental σ exp both HA/V74 and HB/V73 data are shown on Figure 2(c).
points measured with ARG2 rheometer, σ th are predicted
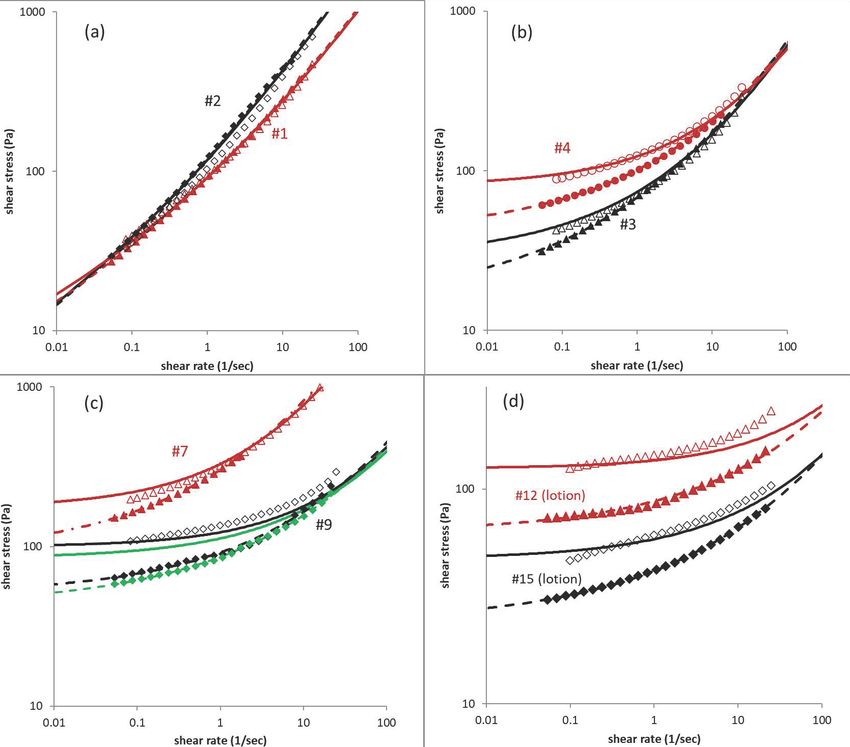
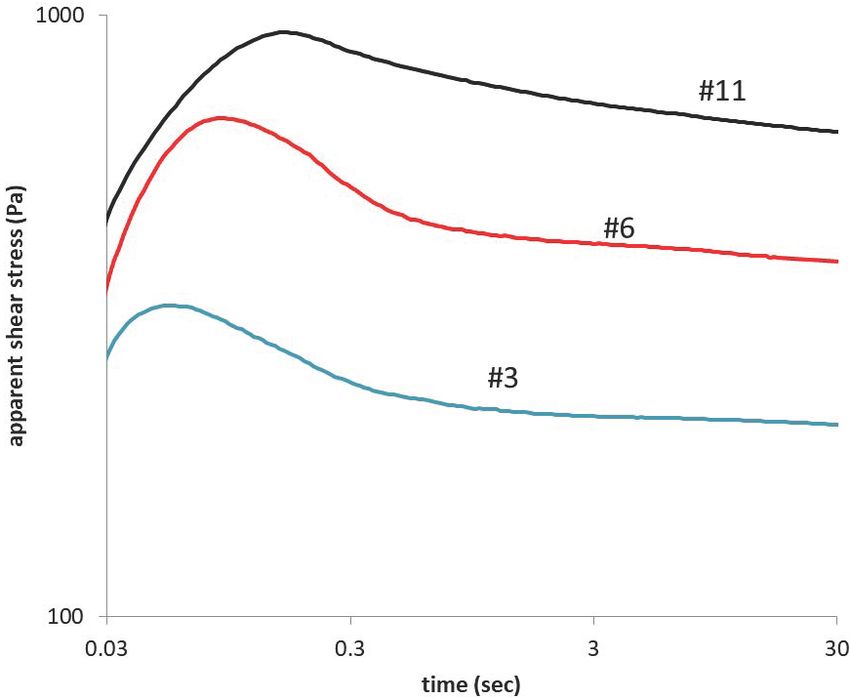
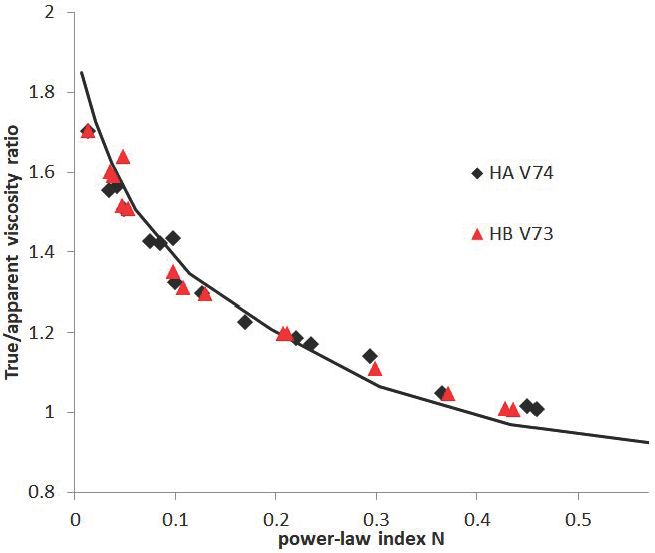
Rheological Characterization of Yield-Stress Fluids with Brookfield Viscometer | 7

 3.4 Apparent viscosity against the true
 viscosity

 One can compare apparent viscosity measured on Brook-
 field (or any viscometer which uses the same data process-
 ing method) to the “true” viscosity calculated from the same
 data. In the case of Brookfield, the apparent viscosity is de-
 fined from torque reading at a pre-defined RPM following
 eqs. (7) and (8). Again, this is essentially a single-point
 method, i.e., no data at other RPMs are needed. To estimate
 the true viscosity the whole torque-RPM set of data needs to
 be fitted as explained above to get the best-fit parameters of
 the Casson equation (6). The true viscosity is estimated at
 the same apparent shear rate which is calculated from the
 given RPM. The comparison is shown on Figure 4. The data
Figure 3: Simulated data points with yield stress values (see Ta- are summarized in terms the ratio of the true to apparent
ble 4), their best fit (dashed lines) and the “true” flow curves calcu- viscosity and the flow index (flow curve slope in logarith-
lated from them (solid curves).
 mic coordinates) which for Casson equation is estimated
 as follows:
The difference between the two predictions is not that big (︂ )︂n
 d(log (σ)) η∞ ˙
but the one obtained with HA/V74 with only 44% of data N= =
 d(log ( ˙ )) σ ( ˙ )
points above 10% of torque provided better agreement with
the rheometer data. Both actual data for the 15 samples tested with two
 different viscometers and the simulated data are shown.
 There is a general dependence which predicts the two val-
3.3 Data simulation ues being close for more Newtonian samples (high flow
 index N). However, apparent viscosity significantly under-
To explain better the data processing procedure outlined estimates the true viscosity as the behavior becomes more
above an imaginary experiment was performed, i.e., the yield-stress-like (hence, low N).
one in which apparent flow curves were simulated by using
Casson equation (6) with a predefined set of parameters.
Some of thus “simulated” flow curves are shown on Figure 3.
They were fitted as the actual data and the fitted curves are
also shown (dashed) on the same plot. Recall that what
was fitted was actually torque and angular velocity (which
are directly proportional to apparent values) but the curves
were plotted in terms of the apparent values so as to make
comparison to the “true” flow curves easier. The latter were
calculated with the best-fit parameters, again- the same way
as the actual data were processed above. Both apparent
and “true” parameters are shown in Table 4. From that
table one confirms (which can be concluded by visually
inspecting the plot as well) – that the true curves tend to
be more “bended” (higher n), have higher yield stress and
lower high-shear viscosity limit.

 Figure 4: True to apparent viscosity values ratio plotted against
 the curves slope (flow index) estimated as explained in the test at
 RPM=1. Points correspond to the actual experimental data, solid
 line-simulations.
8 | A. Potanin and G. Marron

Table 3: Fitting parameters for the flow curves obtained with the two configurations: HA type viscometer with V74 spindle and HB with V73
spindle for all fluids from Table 1. Also shown are coeflcients of determination estimated when using Brookfield data as a predictor for the
data obtained on ARG2 rheometer as explained in the text and the percentage of points which produced the torque above 10% (usually
considered “in-spec” by Brookfield).

instrument/spindle HA/V74 HB/V73
 used
 Sample ID σ y (Pa) η∞ n % in R2 σ y (Pa) η∞ n % in R2
 spec. spec.
 #1 1.43 0.27 0.14 46 0.995 1.03 0.17 0.13 83 0.994
 #2 0.405 0.80 0.13 52 0.988 0.781 1.34 0.15 82 0.999
 #3 24.2 1.15 0.30 36 0.990 28.6 2.04 0.39 72 0.956
 #4 80.8 1.39 0.41 56 0.988 75.0 2.53 0.53 100 0.703
 #5 10.8 0.02 0.14 64 0.951 16.7 0.15 0.19 100 0.941
 #6 54.5 1.24 0.32 56 0.993 57.3 3.12 0.43 100 0.928
 #7 206 20.10 0.48 100 0.933 174 16.60 0.46 100 0.992
 #8 2.53 0.00 0.10 76 0.885 2.13 0.01 0.11 96 0.938
 #9 91.6 0.43 0.39 44 0.842 84.7 0.74 0.43 100 0.554
 #10 0.130 0.17 0.10 64 0.983 1.04 1.42 0.15 90 0.997
 #11 16.2 0.03 0.15 68 0.959 21.5 0.17 0.19 100 0.990
 #12 150 0.14 0.46 68 0.402 125 0.17 0.48 100 0.649
 #13 16.7 0.06 0.30 0 0.902 20.6 0.14 0.40 16 0.889
 #14 36.4 0.10 0.38 0 0.938 34.4 0.08 0.39 32 0.895
 #15 30.9 0.00 0.17 8 0.212 47.2 0.11 0.40 60 0.923

Table 4: Apparent parameters used to generate curves on Figure 2 toothpastes and lotions, were tested and the data analyzed
and the best-fit parameters calculated from the simulated curves to using different techniques. The data collected on differ-
produce the “true” curves on that plot.
 ent Brookfield viscometers with vane spindles were com-
 pared to the data obtained on a high-end rheometer (ARG2
 apparent values fitted values
 by TA Instruments) using concentric narrow-gap geome-
σ y (Pa) η∞ n σ y (Pa) η∞ n
 try. Two ways to process the data were considered. Both
 100 0.1 0.4 166 0.077 0.5
 methods assume that the flow around the vane is close to
 10 0.1 0.4 16.6 0.070 0.5
 the one around its encompassing cylinder (“Couette anal-
 3 0.1 0.4 4.98 0.066 0.5
 ogy”). Firstly, the apparent viscosity method was used- the
 1 0.1 0.4 1.66 0.065 0.5
 same method commonly used in many lab rheometers. It
 0.3 0.1 0.4 0.488 0.075 0.5
 estimates apparent values of shear rate and stress from
 0.1 0.1 0.4 0.158 0.087 0.5
 torque readings assuming that shear occurs deep inside the
 0.03 0.1 0.4 0.0474 0.084 0.5
 gap between the vane and the vessel. This method works
 0.01 0.1 0.4 0.0156 0.086 0.5
 fine for moderately non-Newtonian samples. A more gen-
0.003 0.1 0.4 0.00452 0.090 0.5
 eral method is based on numerical solution of the integral
0.001 0.1 0.4 0.00148 0.089 0.5
 equation relating torque to is angular velocity. The agree-
 ment of thus processed data and the data obtained on ARG2
 rheometer for all tested products was found to be very good.
4 Conclusions This justifies this measurement technique as well as the
 suggested data processing.
Despite certain criticism of the vane method as a general
rheological tool, it remains a widely used technique in in- Conflict of interest: Authors state no conflict of interest
dustry, especially in its implementation as an immersion
technique whereby the vane is immersed into a wide vessel
filled with the product. In this paper 15 different products,
Rheological Characterization of Yield-Stress Fluids with Brookfield Viscometer | 9

 [12] Barnes, H.A., Nguen, Q.D. Rotating vane rheometry. J.non-
References Newtonian FLuid Mech., 98 (2001) 1-14.
 [13] Potanin A.A., 3D simulations of the flow of thixoropic fluids in
[1] Brookfield DV2T Viscometer Operating Instructions, Manual 13- large-gap Couette and vane-cup geometries, J non-Newtonian
 167-B0614 or any other for digital viscometer available at brook- Fluid Mech., 165, 299-312 (2010)
 fieldengineering.com. [14] Ovarlez, G., Mahaut, F., Bertrand, F., Chateau, X. Flows and het-
[2] Mitschka, P., Simple conversion of Brookfield RVT readings into erogeneities with a vane tool: magnetic resonance imaging mea-
 viscosity functions. Rheologica Acta, 21 (1982) 207-209. surements. J. Rheology 55 (1011) 197-223.
[3] Wein, O.P., Mitschka, P., Wichterle, K. Immersional rotational vis- [15] Medina-Buenuelos, E.F., Marin-Santibanez, B.M., Perez-
 cometry. A course manual, published (in Czech) in Edice MACRO Gonzales, J., Kalyon, D.M., Rheo-PIV analysis of the vane in cup
 N-1 by the Institute of Macromolecular Chemistry, Czechoslovak flow of a viscoplastic microgel, J. Rheology, 63 (2019) 905-915.
 Acd. Sci., Prague (1977) [16] Wilkinson, W.L., Non-Newtonian fluids. Pergamion press, New
[4] Briggs, J.L., and Steffe, J.F. Using Brookfield Data and the York (1960).
 Mitschka Method to Evaluate Power-law Foods. J. Texture Studies. [17] Pierre, A., Perrot, A., Histace, A., Gharsalli, S., Kadri E.-H. A study
 28 (1997) 517-522. on the limitations of a vane rheometer for mineral suspensions
[5] Anderson, V.J, and Meeten, G.H, Interpretation of T-Bar Tool Mea- using image processing. Rheol. Acta 56 (2017) 351-367.
 surements for Yield Stress Materials. Appl. Rheol. 22 (2012) [18] Ahuja, A., G. Luisi and A. Potanin, Rheological measurements for
 55370. prediction of pumping and squeezing, J. Non-Newtonian Fluid
[6] Nguyen, Q.D., and D.V. Boger, Yield stress measurement for con- Mech., 258 (2018) 1-9.
 centrated suspensions, J. Rheol. 27 (1983) 321-349. [19] TA Instruments Rheology Manuals, section ARG2/AR 2000ex/AR
[7] Daubert, C.R., Tkachuk, J.A., Truong, V.D. Quantitative measure- 1500ex Rheometer, p. 165, available at https://www.tainstrume
 ment of food spreadability using the vane method. J. Texture nts.com/support/software-downloads-support/downloads.
 Studies. 29 (1998) 427-435. [20] Giesekus, H., Langer, G., Die Bestimmung der wahren Fliesskur-
[8] Ahuja, A., Lu, J, and Potanin, A. Rheological Predictions of Sen- ven nicht-newtonischer Flüssigkeiten und plastischer Stoffe mit
 sory Attributes of Lotions, J. Texture Studies, 50 (2018) 295-305. der Methode der repräsentativen Viskosität, Rheol. Acta, 16
[9] Ahuja, A., and Potanin, A. Rheological and sensory properties of (1977) 1-22.
 toothpastes. Rheologica Acta, 57 (2018) 459-471. [21] Wein O., J. Vecer and J. Havlica, 2007, End effects in rotational
[10] Estellé, P., Lanos, C., Perrot, A., Amziane, S. Processing the vane viscometry, Rheol. Acta, 46, 765-772.
 shear flow data from Couette analogy. Appl. Rheol. 18 (2008) [22] Casson, N., A Flow Equation for Pigment Oil Suspensions of the
 34037. Printing Ink Type. Rheology of Disperse Systems, C. C. Mill, Ed.,
[11] Barnes, H.A., Carnali, J.O. The vane-on-cup as a novel rheome- pp. 84–102, Pergamon Press, London, UK. (1959)
 ter geometry for shear thinning and thixotropic materials.
 J.Rheology, 34 (1990) 841-866.
You can also read