Horizontal inequality, COVID-19, and lockdown readiness - Evidence from India WIDER Working Paper 2020/156 - unu-wider
←
→
Page content transcription
If your browser does not render page correctly, please read the page content below
WIDER Working Paper 2020/156

Horizontal inequality, COVID-19, and lockdown
readiness
Evidence from India

Rachel M. Gisselquist1 and Anustup Kundu2

November 2020
Abstract: A growing body of research shows that COVID-19 both reflects and exacerbates
existing inequalities. However, there are significant gaps in this research area with respect to
‘horizontal’ or group-based inequalities in Global South countries. Lack of group-disaggregated
data often contributes. In this paper, we use available data to explore how horizontal inequality in
India may influence COVID-19’s impact through the differential impact of lockdown policies
across caste and religious groups, as well as across states and urban–rural areas. In so doing, we
build upon Egger et al. (2020)’s lockdown readiness index. India, the second most populous
country in the world, is a relevant case for such analysis, not only because it has pronounced
horizontal inequality, but also because it adopted an especially stringent lockdown policy. Our
analysis illustrates stark differences in lockdown readiness across groups, which in turn could
exacerbate existing horizontal inequalities.
Key words: horizontal inequality, ethnic inequality, caste, India, COVID-19, coronavirus,
lockdown
JEL classification: I14, I18, J15, Z13

1   UNU-WIDER, corresponding author: rachel@wider.unu.edu; 2 UNU-WIDER and University of Helsinki, Finland
This study has been prepared within the UNU-WIDER project Addressing group-based inequalities.
Copyright © UNU-WIDER 2020
Information and requests: publications@wider.unu.edu
ISSN 1798-7237 ISBN 978-92-9256-913-6
https://doi.org/10.35188/UNU-WIDER/2020/913-6
Typescript prepared by Siméon Rapin.
United Nations University World Institute for Development Economics Research provides economic analysis and policy advice
with the aim of promoting sustainable and equitable development. The Institute began operations in 1985 in Helsinki, Finland, as
the first research and training centre of the United Nations University. Today it is a unique blend of think tank, research institute,
and UN agency—providing a range of services from policy advice to governments as well as freely available original research.
The Institute is funded through income from an endowment fund with additional contributions to its work programme from
Finland, Sweden, and the United Kingdom as well as earmarked contributions for specific projects from a variety of donors.
Katajanokanlaituri 6 B, 00160 Helsinki, Finland
The views expressed in this paper are those of the author(s), and do not necessarily reflect the views of the Institute or the United
Nations University, nor the programme/project donors.
1        Introduction

A growing body of research explores the relationship between COVID-19 and inequality; rather than
being a great equalizer as some early discussion suggested, it is now clear that the pandemic both reflects
and exacerbates existing inequalities in multiple ways, across and within countries. As one commentator
put it, ‘we may be in this together, but that doesn’t mean we are in this equally’.1 Across countries,
the socioeconomic costs of the pandemic are estimated as particularly stark for developing countries
(Valensisi 2020). Within countries, pandemic impact is shown to reflect multiple forms of inequality, in
income, assets, employment, access to health care, living situations, access to social protection, and so
on (Adams-Prassl et al. 2020; Gentilini et al. 2020). Research also has shown differential impact along
gender lines and for particular vulnerable groups, such as informal workers.

One important dimension of this relationship that has been less explored than others—especially in
Global South countries—is how ‘horizontal’ inequalities, or inequalities between social groups, partic-
ularly those defined in ethnic, racial, communal, or culturally-defined terms, come into play. In many
countries, such horizontal inequalities are economically, socially, and politically salient, and inequali-
ties in income, assets, employment, etc. are closely linked (Brown and Langer 2010; Cederman et al.
2011; Stewart 2005). Studies in selected countries—mainly in the Global North—show evidence of
the relevance of horizontal inequality to COVID-19 impact. For instance, ethnic minority populations
in the United States (US) and United Kingdom (UK) have been disproportionately affected in health
and socio-economic terms (APM Research Lab 2020; Eligon et al. 2020; Gold et al. 2020; White and
Nafilyan 2020). In the US, APM Research Lab (2020) found that the mortality rate for African Ameri-
cans and Latinos is 3.2 times higher than that for White Americans. In the UK, the Office for National
Statistics (ONS) found that males of Black ethnic background had a death rate 4.7 times higher than
those of White ethnic background. In many countries, particularly in the Global South, direct analysis
of the relationship between horizontal inequality and COVID-19 is severely hampered by the lack of
publicly available group-disaggregated data on health impacts in particular.2

In this working paper, we use available data to focus on how horizontal inequality may influence COVID-
19’s socio-economic impact through the differential impact lockdown policies may have on different
groups, in one country, India. We consider variation along several different dimensions, in particular
caste and religion, as well as across states. We also consider variation between urban and rural popula-
tions. In so doing, we build on an important framework developed in cross-country research on COVID-
19 and apply it to within-country consideration. As the emerging research literature explores, one sig-
nificant channel through which the pandemic influences poverty outcomes is via lockdown, adopted at
least for some months in 2020 by most countries in the world (Hale et al. 2020). Inequalities influence
the impact of lockdown; in countries where a large share of the population cannot work from home, do
not have sufficient savings to cushion loss of wage income, and so on, research suggests, the costs of
lockdown for welfare can be extreme (Egger et al. 2020; Brown et al. 2020). To consider likely impact
of lockdown across countries in sub-Saharan Africa (SSA), Egger et al. (2020) propose a new multidi-
mensional index of ‘lockdown readiness’ and apply it to 30 countries using data from the Afrobarometer
surveys. Their analysis suggests that, across these 30 African countries, just 6.8 per cent of households
(and 12.2 per cent in urban areas) are fully lockdown ready.

1 https://www.ifs.org.uk/inequality/expert-comment/we-may-be-in-this-together-but-that-doesnt-mean-we-are-in-this-equally
(accessed November 2020).
2 It is worth being clear that our view is not that such data should be necessarily compiled and made public in order for such
analysis to be conducted; in some contexts, there are good political reasons for caution, and the financial costs and practicalities
of compiling such data also require consideration (Canelas and Gisselquist 2019).

                                                                 1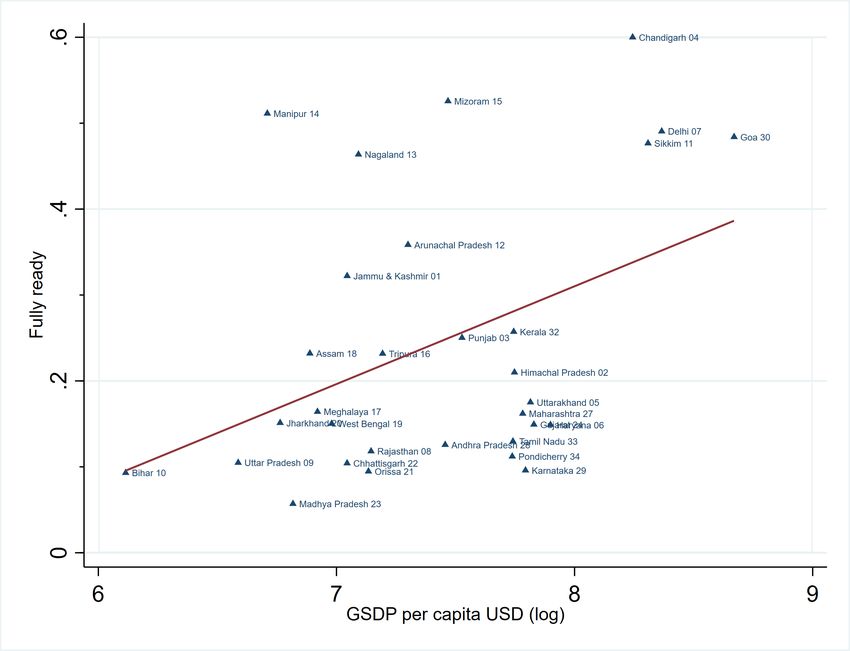
This note describes core findings from our application of a modified version of this index to India. Our
analysis is based on the most recent India Human Development Survey (2011–12), which is useful for
our purposes because it is the only publicly available source with nationally-representative caste and
sub-caste data for India. The main contribution of our analysis is to illustrate how horizontal inequalities
in multiple dimensions—across caste and religious groups, as well as across Indian states—translate
into variation in lockdown readiness, which in turn may exacerbate such horizontal inequalities. The
differences across groups are stark especially in terms of caste where those in the ’general’ category
are more than twice as likely as those in ’scheduled caste/scheduled tribe’ (SC/ST) category to be fully
or partially lockdown ready. Notable variation is also shown between urban and rural populations, and
across states and religious groups

Given the number of years that have elapsed since the IHDS was conducted, we note that care should
be taken in consideration of any specific figures, especially given substantial growth in access to water,
sanitation, electricity, and mobile phone access in India over the last decade. Nevertheless, our analysis
suggests that at the national level, only 15.4 per cent of households according to these data were lock-
down ready (6.1 per cent in rural areas and 32.9 per cent in urban areas). Looking only at the simple
numbers, this appears to suggests that, in 2020, a significantly greater share of households in India may
have been lockdown ready than in sub-Saharan Africa; however, we caution against such interpretations
given that the data used in our analysis and Egger et al. (2020)’s are not comparable, and that we employ
a modified version of their index.

India is an important case for such analysis not only because it is the second most populous country in
the world, but also because it has pronounced horizontal inequality (Borooah 2005; Deshpande 2001;
Zacharias and Vakulabharanam 2011) and because it adopted one of the most stringent lockdown policies
in the world. India’s lockdown began on 25th of March 2020 with a notice period of 3.5 hours. It limited
the movement of 1.3 billion people—including approximately 100 million migrant labourers (Jigeesh
2020)—for an initial period of 21 days, which later was extended until 30th of May. The lockdown scored
a 100 (out of 100) in the Oxford COVID-19 Government Response Tracker (OxCGRT) for lockdown
stringency (Hale et al. 2020).

Horizontal inequalities in India can be considered along multiple dimensions. The caste system is be-
lieved to be more than 3000 years old; the eighteenth-century philologist Sir William Jones assigns the
Manusmriti, the ancient legal text behind the creation of four Varnas (caste), to the period of around
1250 BC (Hunter 2013).3 Beside caste fragmentation, religion is another source of division or marginal-
ization, and Hindu-Muslim inequalities have persisted throughout the twentieth century in India (Basant
and Shariff 2010). Horizontal inequalities among Indian states are also apparent (Vanneman and Dubey
2013). Despite the importance of caste and religion, a challenge with direct analysis of this topic in
India, as in many countries, is the lack of data.

2          Lockdown readiness index and data

To estimate the level of lockdown readiness across SSA countries, Egger et al. (2020) construct a simple
multidimensional lockdown readiness index. They define lockdown readiness as the ability of house-
holds to stay at home and steer clear of public spaces without irreparable damage to their health and
welfare. They consider five minimum components to to be ready for a lockdown—namely that, within
the households, the family has access to: (1) clean drinking water; (2) basic sanitation; (3) a source of
reliable energy; (4) a means of communication or information (e.g. a cell phone); and (5) a form of
employment with sufficient income not to go out without cash on a frequent basis. When all the five

3   Readers interested in detailed evolution of the Indian caste system can turn to the work by Deshpande (2000).

                                                                2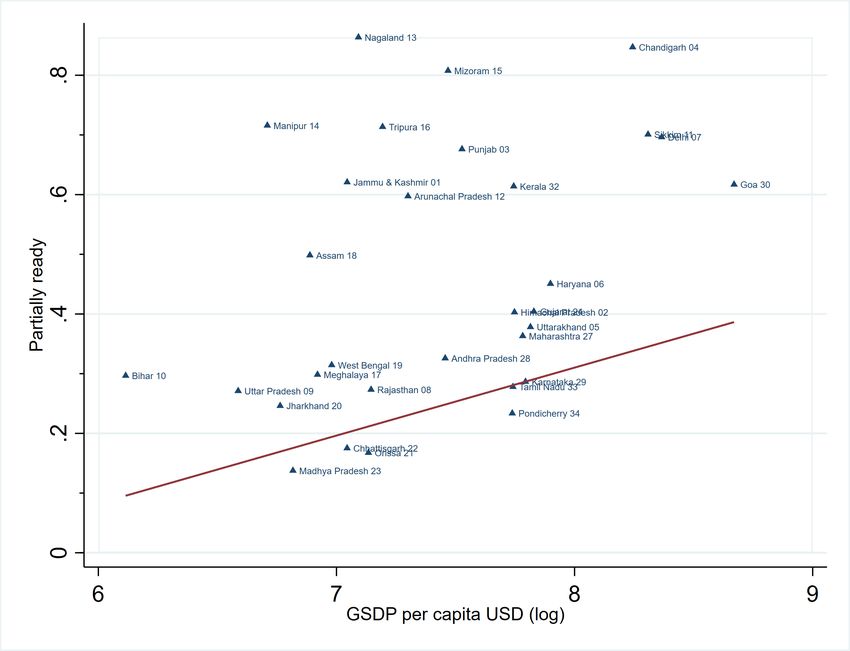
constraints are met, the household is classified as fully ready for a lockdown scenario. When at least the
first three constraints are met, the household is classified as partially ready for lockdown. To estimate
the index across African countries, Egger et al. (2020) use harmonized data from the most recent round
of the Afrobarometer surveys (Afrobarometer Data 2019), which cover 37,696 people in 30 countries.
In practice then, the index, as estimated using the Afrobarometer surveys, is based on responses on (1)
access to safe drinking water; (2) access to basic sanitation; (3) access to electricity; (4) access to a
mobile or other phone; and (5) whether the respondent has ’always’ or ’many times’ gone without cash
income, even if currently employed.

Our modified version of the lockdown readiness index employs the same basic structure, but is opera-
tionalized differently, in particular in terms of the fifth component. This is due in part to the fact that
we employ a different survey in our analysis, the India Human Development Survey (IHDS), which not
only includes different questions but also, in our view, allows for closer consideration of several of the
core components than does the Afrobarometer survey. With regard to the fifth criterion, cash income, we
aimed to more closely capture whether income might continue to be received in the event of a lockdown
than is possible with the Afrobarometer. We aimed to consider both non-employment sources of income
such as pensions or rents that would be received even without leaving the home during a lockdown, and
whether the employment situation was such that the employee could continue to earn income during a
lockdown, e.g. by working from home or being in formal employment that might offer some provisions
for temporary lay-offs. Further details are provided below.

2.1        Data

Our analysis relies on the IHDS, a nationally representative survey of households across India with
rounds in 2004–05 and 2011–12.4 The IHDS is a collaborative project from the University of Maryland,
the National Council of Applied Economic Research (NCAER), Indiana University, and the Univer-
sity of Michigan. In the first round, 41,554 households were surveyed. In the second round, 42,152
households were surveyed and 85 per cent of the households from the first round were resurveyed. The
households lost to attrition in urban and rural blocks of north-eastern states were physically verified by
NCAER monitors and replacement households were randomly selected in the same neighbourhood to
refresh the sample which led to 2,134 new households included in the second round of IHDS.

For our purposes, the core advantage of this source (Desai and Vanneman 2015) over other data sets such
as the National Sample Service (NSS) is that it is the only publicly available data set on India which has
jati (caste) and sub-jati (sub caste) information.5 It also contains detailed information on household
occupation, water, sanitation, energy, communication devices, and other areas.

In order to analyse the data for our purposes, individual and household information was merged and
dummy variables were created for relevant aggregated caste groups (’general’, OBC, and SC/ST) and
religious groups (Hindu, Muslim, other). We considered multiple questions in development of the modi-
fied lockdown readiness index following the basic approach outlined above. For instance, with regard to
the third lockdownability criterion, energy, we considered a core issue to be whether the household has
access to a source of energy, principally for cooking, that allows the members to stay at home without
going out daily or weekly into public spaces to gather fuel. For simplicity in the analysis below, we
use the following five constructed variables, which are largely similar to the original index’s five core
components: (1) is there safe water available within the home or compound, rather than outside? (based
on ’wa2a’); (2) does the household have a toilet (flush toilet, semi-flush or septic tank latrine, or tradi-

4   A third round, IHDS 3, is ongoing and is slated for release in 2023.
5The Socio Economic and Caste Census (SECC) 2011 contains detailed record of jati and sub-jati but the micro data is not
publicly available.

                                                                 3
tional pit latrine), rather than no facility (or open fields)? (based on ’sa4’); (3) does the household have
electricity? (based on ’fu1’, ’fu14a1’, ’fu14b1’, ’fu14c1’, and ’fu14d1’); (4) does anyone in the house-
hold have a mobile phone? (based on ’mm10’); (5) is the primary means of household support either a
pension or rents, or salaried employment? (based on ’id14’ [salaried and pension people]).

3          Findings

3.1        All India

To estimate the level of lockdown readiness across India, we draw on the IHDS round two, which covers
42,152 households across 34 states and union territories. Part (a) of Table 1 presents the summary
statistics, part (b) comprises of the means of five variables that encompass the lockdown readiness index,
differentiating the rural and urban level. Around 67.5 per cent of the households have electricity but
only 55.5 per cent have access to sanitation and only 52.6 per cent have access to clean water. A
significantly smaller proportion of the households have access to all the basic services simultaneously
(partial readiness). The share of households that are partially ready is just 34.8 per cent in total. The
per cent of households partially ready between the rural and the urban is quite stark, 20.5 per cent in the
rural areas in comparison to 61.7 per cent in the urban areas. Most of the households (80.1 per cent)
have access to a mobile phone or a telephone. However, only 28 per cent report to have stable source
of income and is not cash constrained. This is a major constraint which leads, on average, to only 15.4
per cent of the households fully ready for a lockdown situation. This constraint is magnified even more
at the rural level, where only 6.1 per cent are fully ready in comparison to 32.9 per cent in the urban
areas.
Table 1: Entire sample

                                           All                 Rural            Urban
                                  mean            sd      mean         sd   mean        sd

    Descriptive statistics
    Age                           29.822         20.363   29.310   20.632   30.818   19.791
    Sex                           1.501          0.500    1.503    0.500    1.498    0.500
    Years of education             5.320          4.883    4.538    4.545    6.842    5.153
    Household size                5.964          2.804    6.060    2.872    5.777    2.656

    Lockdown readiness ’inputs’
    Access to clean water         0.526          0.499    0.429    0.495    0.711    0.453
    Access to sanitation          0.555          0.497    0.408    0.491    0.833    0.373
    Access to energy              0.675          0.468    0.553    0.497    0.907    0.290
    Access to phone               0.801          0.399    0.744    0.437    0.909    0.287
    Not cash constrained          0.280          0.449    0.174    0.379    0.479    0.500

    Lockdown readiness
    Full ready                    0.154          0.361    0.061    0.239    0.329    0.470
    Partially ready               0.348          0.476    0.205    0.404    0.617    0.486

    N                             42152                   27579             14573

Source: authors’ calculations based on IHDS data (Desai and Vanneman 2015).

                                                               4
Figure 1: Lockdown readiness in India
Source: authors’ calculations based on IHDS data (Desai and Vanneman 2015).
3.2 Across caste
Figure 2: Lockdown readiness across castes
Source: authors’ calculations based on IHDS data (Desai and Vanneman 2015).
From Table 2 we see that between different castes, those households classified as ’general caste’ had
significantly better access to clean water (67.7 per cent) in comparison to those classified as ’other
backward class’ (OBC; 50.9 per cent) and ’schedule castes/schedule tribes’ (SC/ST; 40.7 per cent). In
terms of other basic services, such as access to sanitation and electricity, those in the OBC and SC/ST
categories have significantly lower access in comparison to those in the general caste category. This in
turn leads to an even lower proportion of those in the OBC and SC/ST categories to be partially ready
for a lockdown scenario, as shown in Figure 2. Only 32.5 per cent of those in the OBC category and
21 per cent in the SC/ST category are partially ready in comparison to 52.3 per cent in the general caste
category. Even significantly lower percentages of OBCs (12 per cent) and SC/STs (10.5 per cent) are
fully ready for a lockdown situation in comparison to 25.4 per cent of those in the general caste category,
due to lack of steady source of income.
5Table 2: Caste
General OBC SC/ST
mean sd mean sd mean sd
Descriptive statistics
Age 31.793 20.767 29.568 20.445 28.241 19.703
Sex 1.499 0.500 1.502 0.500 1.502 0.500
Years of education 6.660 5.150 5.082 4.745 4.365 4.524
Household size 5.941 2.887 6.121 2.977 5.783 2.454
Lockdown readiness ’inputs’
Access to clean water 0.677 0.468 0.509 0.500 0.407 0.491
Access to sanitation 0.744 0.436 0.531 0.499 0.400 0.490
Access to energy 0.810 0.392 0.690 0.463 0.524 0.499
Access to phone 0.882 0.322 0.812 0.390 0.705 0.456
Not cash constrained 0.391 0.488 0.238 0.426 0.233 0.423
Lockdown readiness
Full ready 0.254 0.435 0.120 0.325 0.105 0.306
Partially ready 0.523 0.499 0.325 0.468 0.210 0.408
N 11857 17056 12585
Source: authors’ calculations based on IHDS data (Desai and Vanneman 2015).
3.3 Across religion
From Table 3 we see that, between those of different religions, those classified as Hindu represent
a majority of the sample and have significantly lower average access to clean water (49.9 per cent) in
comparison to those classified as Muslim (60.9 per cent) or members of ’other’ religious groups (71.3 per
cent). In terms of other basic services, such as access to sanitation and access to electricity, households
classified as Muslim and other religious groups have significantly higher access in comparison to Hindu
households. Figure 3 shows that 32.2 per cent of Hindu and 40.4 per cent of Muslim households are
partially ready in comparison to 56.2 per cent of the other religious group households. Only 15 per cent
of Hindu households, 13 per cent of Muslim households, and 24.1 per cent of the other religious group
households are fully ready for a lockdown situation, in large part due to their lack of a steady source of
income.
6Table 3: Across religion
Hindu Muslim Others
mean sd mean sd mean sd
Descriptive statistics
Age 30.226 20.454 26.376 19.313 32.109 20.590
Sex 1.501 0.500 1.502 0.500 1.497 0.500
Years of education 5.407 4.909 4.295 4.508 6.419 4.970
Household size 5.841 2.726 6.908 3.228 5.497 2.341
Lockdown readiness ’inputs’
Access to clean water 0.499 0.500 0.609 0.488 0.713 0.452
Access to sanitation 0.514 0.500 0.702 0.457 0.790 0.407
Access to energy 0.663 0.473 0.697 0.460 0.787 0.410
Access to phone 0.796 0.403 0.816 0.388 0.833 0.373
Not cash constrained 0.279 0.449 0.238 0.426 0.359 0.480
Lockdown readiness
Full ready 0.150 0.357 0.130 0.336 0.241 0.428
Partially ready 0.322 0.467 0.404 0.491 0.562 0.496
N 34402 4928 2822
Source: authors’ calculations based on IHDS data (Desai and Vanneman 2015).
Figure 3: Lockdown readiness across religion
Source: authors’ calculations based on IHDS data (Desai and Vanneman 2015).
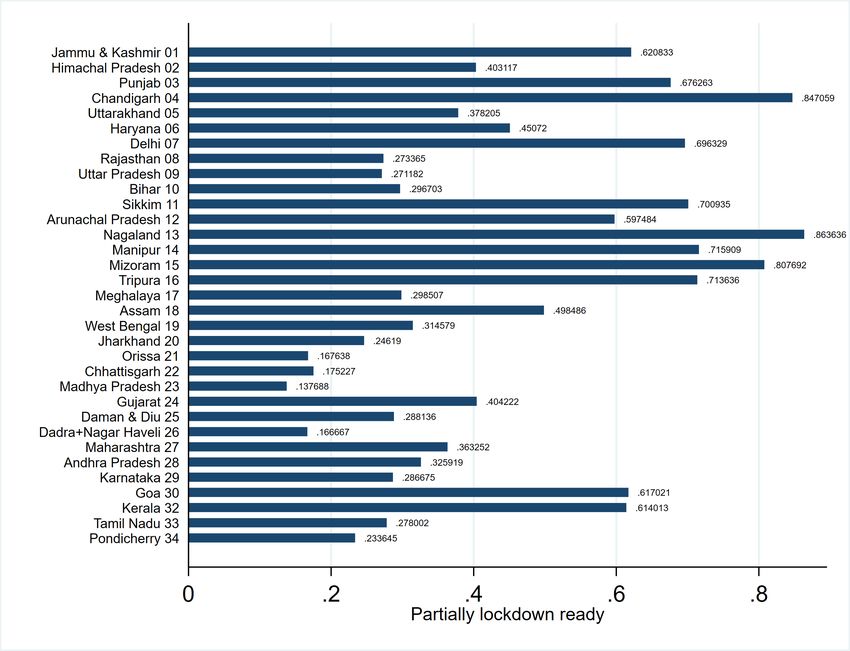
3.4 Across states
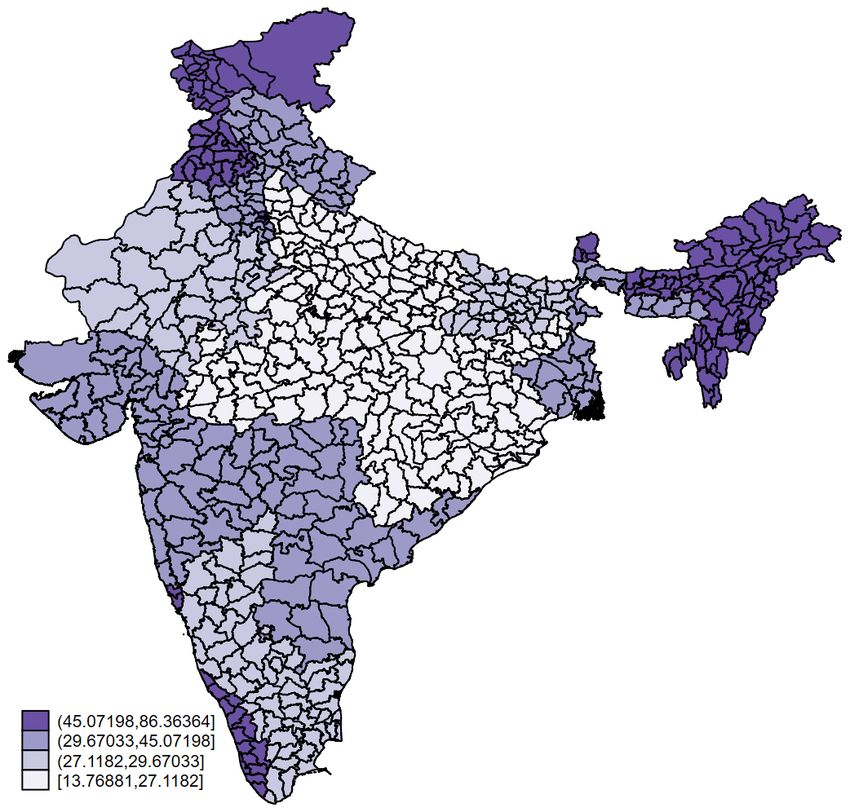
At the state level, Figure 4 shows that more than 50 per cent of the sample in 13 states and union
territories are partially ready for a lockdown scenario. In the north-eastern state of Nagaland, around
86.3 per cent of the sample is partially ready. By contrast, in the state of Madhya Pradesh, only 13.7
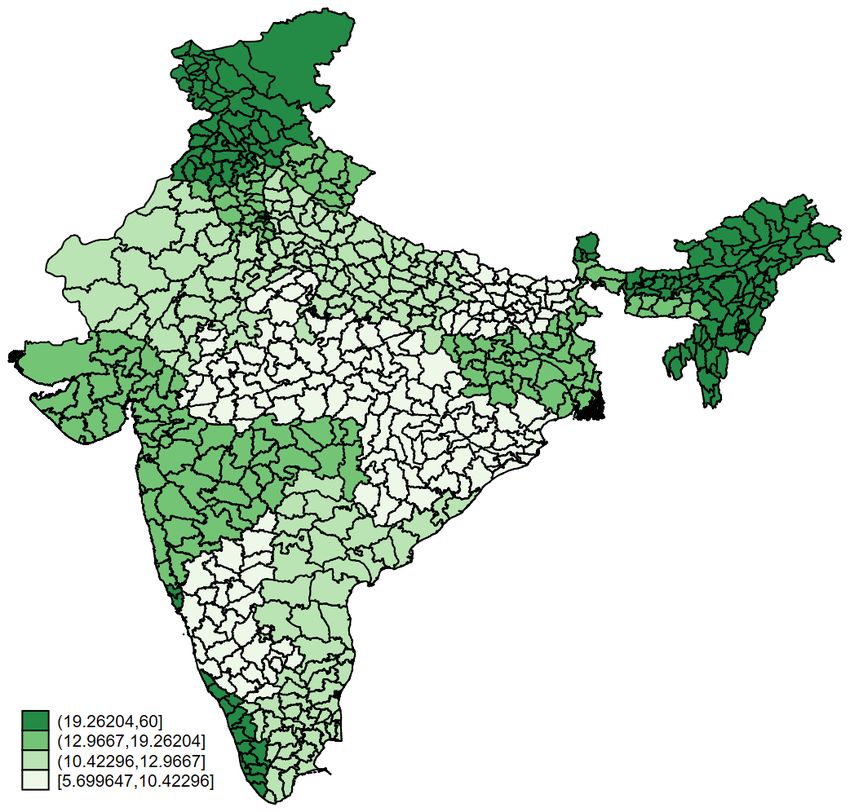
per cent of households are even partially ready for a lockdown scenario. As shown in Figure 5, these
numbers drop significantly when we consider ’fully’ ready scenarios. In the union territory Chandigarh,
60 per cent of households are fully ready for a lockdown, and it is not surprising to see that the state of
Madhya Pradesh is least ready with just 5.6 per cent of households fully ready for a lockdown scenario.
Figures A1 and A2 in the Appendix highlight the stark variation in partial readiness and full readiness
for a lockdown scenario across states.
7Figure 4: Partial lockdown readiness across states
Source: authors’ calculations based on IHDS data (Desai and Vanneman 2015).
Figure 5: Full lockdown readiness across states
Source: authors’ calculations based on IHDS data (Desai and Vanneman 2015).
8Egger et al. (2020) find a positive correlation between gross domestic product (GDP) per capita and
lockdown readiness in 30 sub-Saharan countries. We find similar positive correlation across Indian
states. Figures 6 and 7 plot the correlation between per capita gross state domestic product (GSDP)
measured in log US dollars in the horizontal axis and lockdown readiness, partial and full, respectively,
in the vertical axis. Looking first at partial lockdown readiness (Figure 6), it is not surprising that a
significant portion of richer states and union territories are partially ready for a lockdown scenario.
However, less well-off states in terms of GSDP, such as the north-eastern states of Nagaland, Manipur,
Tripura, and Mizoram, are equally or more prepared partially for a lockdown scenario. Figure 7, which
looks into the correlation between full readiness for a lockdown situation and GSDP, shows an even
steeper correlation. Some states are notable exceptions here: for instance, as the figure shows, less
well-off states in terms of GSDP, such as the north-eastern states of Nagaland, Manipur, and Mizoram,
are equally fully prepared for a lockdown scenario in comparison to more well-off states and union-
territories, such as Chandigarh, Delhi, Sikkim, and Goa.
Figure 6: Percentage of the population partially ready for lockdown and GSDP per capita (US$)
Source: authors’ calculations based on IHDS data (Desai and Vanneman 2015), MoSPI data (MoSPI 2020), and exchange
rate from the World Bank (World Bank n.d.).
9Figure 7: Percentage of the population fully ready for lockdown and GSDP per capita (US$)
Source: authors’ calculations based on IHDS data (Desai and Vanneman 2015), MoSPI data (MoSPI 2020), and exchange
rate from the World Bank (World Bank n.d.).
4 Conclusion
A growing body of research suggests that COVID-19 both reflects and exacerbates existing inequali-
ties. One important dimension of this relationship that has been less explored than others—especially
in Global South countries—relates to ‘horizontal’ inequalities, which are, in many countries, both pro-
nounced and economically, socially, and politically salient. A core challenge in doing further work in
this area, particularly in Global South countries, is the lack of data that can be used to study this relation-
ship directly. This is precisely the case in India where group-disaggregated data on COVID-19 infection
and deaths has not been made publicly available.
In this paper, we explore what can be gleaned from available data about the likely differential impact
of a core COVID-19 response policy—lockdown—on key groups in India. We focus on core caste
and religious divisions, as well as comparison across states and urban–rural populations. India is a
particularly important case for such analysis, not only because it is the second most populous country
in the world and one with pronounced horizontal inequality, but also because it adopted one of the
most stringent lockdown policies. The main contribution of our analysis is to illustrate how horizontal
inequalities in multiple dimensions—across caste and religious groups, as well as across Indian states—
translate into variation in lockdown readiness. A lack of lockdown readiness during a stringent lockdown
such as that imposed in India implies severe hardships with potentially long-running consequences for
households.
There are multiple areas for future work. One core issue that we do not consider in this analysis is
the potential impact of government COVID-relief efforts in alleviating the ’cash income’ criterion of
the lockdown readiness index. The Indian government, for instance, has aimed to provide a safety
net of 100 days of employment to rural households, channeling support through the Mahatma Gandhi
National Rural Employment Guarantee Scheme (MGNREGS), with an almost doubled budget. Our
analysis shows that a lack of ’cash income’ is a significant factor in preventing many households from
being lockdown ready, thus in general such programmes can be expected to support greater lockdown
10readiness. However, our analysis also underscores that when India’s lockdown was imposed, the rural
poor were not the only ones not lockdown ready. There were vast numbers of people—in urban as well
as rural areas—who were not in a position to respect the lockdown without severe hardship.
References
Adams-Prassl, A., Boneva, T., Golin, M., and Rauh, C. (2020). ‘Inequality in the Impact of the Coronavirus
Shock: Evidence from Real Time Surveys’. CEPR Discussion Paper 14665. London: Centre for Economic
Policy Research.
Afrobarometer Data. (2019). ‘Merged round 7 data (34 countries)’. Data set. Available at: http://www
.afrobarometer.org/
APM Research Lab (2020). ‘The Color of Coronavirus: COVID-19 Deaths by Race and Ethnicity in the US’.
Available at: https://www.apmresearchlab.org/covid/deaths-by-race (accessed November 2020)
Basant, R., and Shariff, A. (eds). (2010). Handbook of Muslims in India: Empirical and Policy Perspectives. New
Delhi: Oxford University Press.
Borooah, V. K. (2005). ‘Caste, Inequality, and Poverty in India’. Review of Development Economics, 9(3):
399–414. https://doi.org/10.1111/j.1467-9361.2005.00284.x
Brown, C. S., Ravallion, M., and Van De Walle, D. (2020). ‘Can the World’s Poor Protect Themselves from
the New Coronavirus?’. NBER Working Paper 27200. Cambridge, MA: National Bureau of Economic
Research. https://doi.org/10.3386/w27200
Brown, G. K., and Langer, A. (2010). ‘Horizontal Inequalities and Conflict: A Critical Review and Research
Agenda’. Conflict, Security & Development, 10(1): 27–55. https://doi.org/10.1080/14678800903553837
Canelas, C., and Gisselquist, R. M. (2019). ‘Correction to: Horizontal Inequality and Data Challenges’. Social
Indicators Research, 145(1): 969–84. https://doi.org/10.1007/s11205-019-02157-1
Cederman, L.-E., Weidmann, N. B., and Gleditsch, K. S. (2011). ‘Horizontal Inequalities and Ethnona-
tionalist Civil War: A Global Comparison’. American Political Science Review, 105(3): 478–95.
https://doi.org/10.1017/S0003055411000207
Desai, S., and Vanneman, R. (2015). ‘India Human Development Survey-II (IHDS-II), 2011-12’. Data
set. Ann Arbor, MI: Inter-University Consortium for Political and Social Research [distributor].
https://doi.org/10.3886/ICPSR36151.v6
Deshpande, A. (2000). ‘Does Caste still Define Disparity? A Look at Inequality in Kerala, India’. American
Economic Review, 90(2): 322–25. https:/doi.org/10.1257/aer.90.2.322
Deshpande, A. (2001). ‘Caste at Birth? Redefining Disparity in India’. Review of Development Economics, 5(1):
130–44. https://doi.org/10.1111/1467-9361.00112
Egger, E.-M., Jones, S., Justino, P., Manhique, I., and Santos, R. (2020). ‘Africa’s Lockdown
Dilemma: High Poverty and Low Trust’. WIDER Working Paper 2020/76. Helsinki: UNU-WIDER.
https://doi.org/10.35188/UNU-WIDER/2020/833-7
Eligon, J., Burch, A. D., Searcey, D., and Oppel Jr, R. A. (2020). ‘Black Americans Face Alarming Rates of
Coronavirus Infection in Some States’. The New York Times, 14 April 2020. Available at:
https://www.nytimes.com (accessed November 2020)
Gentilini, U., Almenfi, M., Orton, I., and Dale, P. (2020). ‘Social Protection and Jobs Responses to COVID-19:
A Real-Time Review of Country Measures’. Brief. Washington, DC: World Bank.
Gold, J. A., Rossen, L. M., Ahmad, F. B., Sutton, P., Li, Z., Salvatore, P. P., Coyle, J. P., DeCuir, J., Baack, B. N.,
Durant, T. M., et al. (2020). ‘Race, Ethnicity, and Age Trends in Persons Who Died from COVID-19—
United States, May–August 2020’. MMWR Morbidity and Mortality Weekly Report, 69(42): 1517–21.
https://doi.org/10.15585/mmwr.mm6942e1
Hale, T., Webster, S., Petherick, A., Phillips, T., and Kira, B. (2020). ‘Oxford COVID-19 Government Response
Tracker’. Data set. Oxford: Blavatnik School of Government.
Hunter, W. W. (2013). The Indian Empire: Its People, History and Products. Abingdon-on-Thames: Routledge.
Jigeesh, A. (2020). ‘Exodus After Lockdown: Over 10 Crore Workers Hit; Govt Has No Idea of
the Scale of Problem, say TUs, NGOs’. The Hindu BusinessLine, 30 March 2020. Avail-
able at: https://www.thehindubusinessline.com/news/exodus-after-lockdown-over-10-crore-workers-hit
-govt-has-no-idea-of-the-scale-of-problem-say-tus-ngos/article31208426.ece
MoSPI (2020). ‘State-Wise SDP’. Data set. New Delhi: Ministry of Statistics and Programme Implementation.
Stewart, F. (2005). ‘Horizontal Inequalities: A Neglected Dimension of Development’. In
Wider Perspectives on Global Development (pp. 101–35). London: Palgrave Macmillan.
11https://doi.org/10.1057/9780230501850_5
Valensisi, G. (2020). ‘COVID-19 and Global Poverty: Are LDCs Being Left Behind?’ The European Journal of
Development Research,(): 1–23. https://doi.org/10.1057/s41287-020-00314-8
Vanneman, R., and Dubey, A. (2013). ‘Horizontal and Vertical Inequalities in India’. In J. C. Gornick and M. Jäntti
(eds), Income Inequality: Economic Disparities and the Middle Class in Affluent Countries (pp. 439–58).
Palo Alto: Stanford University Press. https://doi.org/10.11126/stanford/9780804778244.003.0017
White, C., and Nafilyan, V. (2020). ‘Coronavirus (COVID-19) Related Deaths by Ethnic Group, England and
Wales: 2 March 2020 to 10 April 2020’. Article. London: Office for National Statistics.
World Bank (n.d.). ‘Official Exchange Rate - India’. Data set. Washington, DC: World Bank.
Zacharias, A., and Vakulabharanam, V. (2011). ‘Caste Stratification and Wealth Inequality in India’. World
Development, 39(10): 1820–33. https://doi.org/10.1016/j.worlddev.2011.04.026
12Appendix
Graphs
Figure A1: Partial lockdown readiness across states
Source: authors’ calculations based on IHDS data (Desai and Vanneman 2015).
13Figure A2: Full lockdown readiness across states
Source: authors’ calculations based on IHDS data (Desai and Vanneman 2015).
14Tables
Table A1: Brahmin
All Rural Urban
mean sd mean sd mean sd
Descriptive statistics
Age 29.822 20.363 31.134 21.158 32.707 20.179
Sex 1.501 0.500 1.502 0.500 1.496 0.500
Years of education 5.320 4.883 5.596 4.813 8.133 5.237
Household size 5.964 2.804 6.183 3.059 5.607 2.594
Lockdown readiness ’inputs’
Access to clean water 0.677 0.468 0.576 0.494 0.807 0.395
Access to sanitation 0.744 0.436 0.611 0.488 0.916 0.277
Access to energy 0.810 0.392 0.695 0.460 0.959 0.199
Access to phone 0.882 0.322 0.838 0.369 0.940 0.238
Not cash constrained 0.391 0.488 0.255 0.436 0.567 0.495
Lockdown readiness
Full ready 0.254 0.435 0.115 0.319 0.434 0.496
Partially ready 0.523 0.499 0.352 0.478 0.745 0.436
N 11857 6683 5174
Source: authors’ calculations based on IHDS data (Desai and Vanneman 2015).
Table A2: OBC
All Rural Urban
mean sd mean sd mean sd
Descriptive statistics
Age 29.822 20.363 29.242 20.743 30.186 19.853
Sex 1.501 0.500 1.503 0.500 1.499 0.500
Years of education 5.320 4.883 4.454 4.485 6.274 4.992
Household size 5.964 2.804 6.204 3.052 5.963 2.823
Lockdown readiness ’inputs’
Access to clean water 0.509 0.500 0.413 0.492 0.687 0.464
Access to sanitation 0.531 0.499 0.375 0.484 0.822 0.382
Access to energy 0.690 0.463 0.578 0.494 0.898 0.303
Access to phone 0.812 0.390 0.763 0.426 0.905 0.293
Not cash constrained 0.238 0.426 0.148 0.355 0.406 0.491
Lockdown readiness
Full ready 0.120 0.325 0.044 0.204 0.262 0.440
Partially ready 0.325 0.468 0.188 0.391 0.580 0.494
N 17056 11103 5953
Source: authors’ calculations based on IHDS data (Desai and Vanneman 2015).
15Table A3: SC/ST
All Rural Urban
mean sd mean sd mean sd
Descriptive statistics
Age 29.822 20.363 27.985 19.992 29.002 18.800
Sex 1.501 0.500 1.503 0.500 1.499 0.500
Years of education 5.320 4.883 3.840 4.248 5.926 4.939
Household size 5.964 2.804 5.804 2.464 5.719 2.425
Lockdown readiness ’inputs’
Access to clean water 0.407 0.491 0.341 0.474 0.604 0.489
Access to sanitation 0.400 0.490 0.296 0.456 0.712 0.453
Access to energy 0.524 0.499 0.418 0.493 0.838 0.368
Access to phone 0.705 0.456 0.651 0.477 0.868 0.339
Not cash constrained 0.233 0.423 0.149 0.356 0.486 0.500
Lockdown readiness
Full ready 0.105 0.306 0.042 0.201 0.292 0.455
Partially ready 0.210 0.408 0.119 0.324 0.482 0.500
N 12585 9427 3158
Source: authors’ calculations based on IHDS data (Desai and Vanneman 2015).
Table A4: Hindu
All Rural Urban
mean sd mean sd mean sd
Descriptive statistics
Age 29.822 20.363 29.634 20.711 31.488 19.838
Sex 1.501 0.500 1.504 0.500 1.496 0.500
Years of education 5.320 4.883 4.590 4.557 7.146 5.172
Household size 5.964 2.804 5.975 2.824 5.555 2.482
Lockdown readiness ’inputs’
Access to clean water 0.499 0.500 0.396 0.489 0.708 0.455
Access to sanitation 0.514 0.500 0.364 0.481 0.819 0.385
Access to energy 0.663 0.473 0.543 0.498 0.907 0.291
Access to phone 0.796 0.403 0.739 0.439 0.912 0.284
Not cash constrained 0.279 0.449 0.167 0.373 0.508 0.500
Lockdown readiness
Full ready 0.150 0.357 0.053 0.224 0.347 0.476
Partially ready 0.322 0.467 0.178 0.383 0.614 0.487
N 34402 23061 11341
Source: authors’ calculations based on IHDS data (Desai and Vanneman 2015).
16Table A5: Muslim
All Rural Urban
mean sd mean sd mean sd
Descriptive statistics
Age 29.822 20.363 25.680 19.571 27.189 18.975
Sex 1.501 0.500 1.503 0.500 1.502 0.500
Years of education 5.320 4.883 3.597 4.202 5.111 4.712
Household size 5.964 2.804 6.928 3.258 6.884 3.192
Lockdown readiness ’inputs’
Access to clean water 0.609 0.488 0.537 0.499 0.693 0.461
Access to sanitation 0.702 0.457 0.563 0.496 0.865 0.342
Access to energy 0.697 0.460 0.529 0.499 0.893 0.309
Access to phone 0.816 0.388 0.755 0.430 0.886 0.317
Not cash constrained 0.238 0.426 0.179 0.383 0.306 0.461
Lockdown readiness
Full ready 0.130 0.336 0.069 0.253 0.202 0.401
Partially ready 0.404 0.491 0.253 0.435 0.582 0.493
N 4928 2657 2271
Source: authors’ calculations based on IHDS data (Desai and Vanneman 2015).
17You can also read