CARBON EMISSION AVOIDANCE STUDY - 2020/2021 TEAMVIEWER - HANDELSBLATT
←
→
Page content transcription
If your browser does not render page correctly, please read the page content below

Carbon Emission Avoidance Study
    2020/2021
    TeamViewer

DFGE – Institute for Energy, Ecology and Economy
© 2021 | ISSN 1863-0553 | Version 1.0, Feb-21 | Publisher: Dr.-Ing. Thomas M. Fleissner
      Comparative
DFGE: Miriam      Emissions/Study
             Eimannsberger   Dr. Alice Beining / Dr.-Ing. Thomas Dreier

TeamViewer: Stefan Gaiser / Alexander Gührer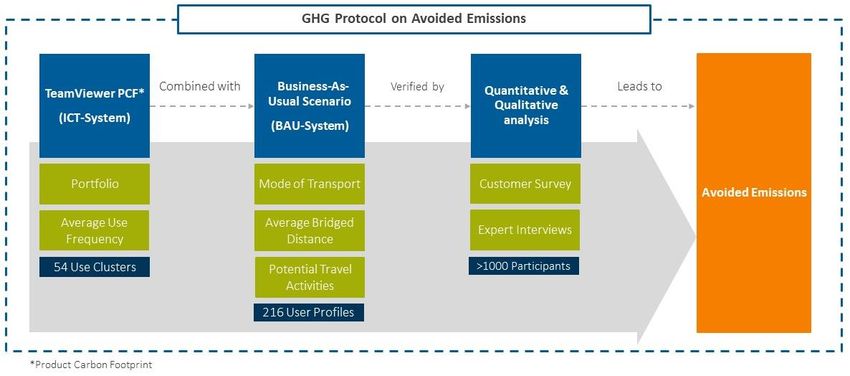
Contents

1. Introduction                                        3
2. Methodological approach                             4
   2.1. Greenhouse Gas Protocol on avoided emissions   4
   2.2. Product Carbon Footprint                       4
   2.3. Use case cluster and influencing factors       5
   2.4. Business-As-Usual scenario (BAU System)        7
   2.5. Quantitative and qualitative analysis          9
3. Study results                                       10
4. Conclusion and outlook                              12
5. Index and references                                13

                                                            2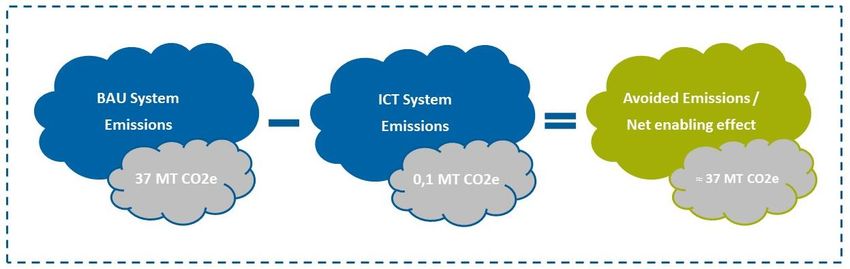
1 Introduction
With increasing use of digital services worldwide, the Information and Communication Technology
(ICT) sector became a fast-growing industry globally. Where on the one hand this can improve living
situations, work life and standards it could also lead to an increase in global greenhouse gas emissions
reliably creating an impact on climate change. In fact, the provision of digital services demands energy
for operating large data centres. Despite increasing energy demand of data centres, the question on
how digitalisation contributes to a more sustainable world has arisen. Studies show that ICT has a high
potential of enabling low-carbon solutions and could, thus, cut global “Business-as-usual” greenhouse
gas emissions by 15%1.

In order to understand the impact of its business on climate change, TeamViewer, a company
providing cloud-based software solutions to access and remotely control networked devices and to
enable online support and collaboration across the globe, appointed DFGE – Institute for Energy,
Ecology and Economy to conduct a study on the climate impact of its business. The goal was to
examine the possible enabling effect of its products towards helping customers to avoid emissions.

The objective of the study was to calculate a valid greenhouse gas emission inventory for the complete
solutions portfolio of TeamViewer. Furthermore, the goal was to determine the positive or negative
effect of its services on emissions in comparison to a Business-as-usual scenario where ICT solutions
are not available - a comparative emissions study.

Covered are all lifecycle emissions starting with the product emissions from data centres and data
traffic as well as emissions from the electricity needed for running the products on the user’s devices.
TeamViewer products allow for activities to occur remotely rather than on site. Therefore, the
underlying assumption for the comparative scenario is that the activities would occur on site rather
than remotely leading to CO2-emissions because of travel activities. The comparative scenario
covered emissions from travelling including potentially travelled distances, mode of transport and
travel frequency. The analysis and calculation were based on literature research, a customer survey
and expert interviews.

Reference year for the emissions balance is the calendar year 2019. The case studies were conducted
in 2020.

1
    GeSi and BCG, p. 6

                                                                                                      3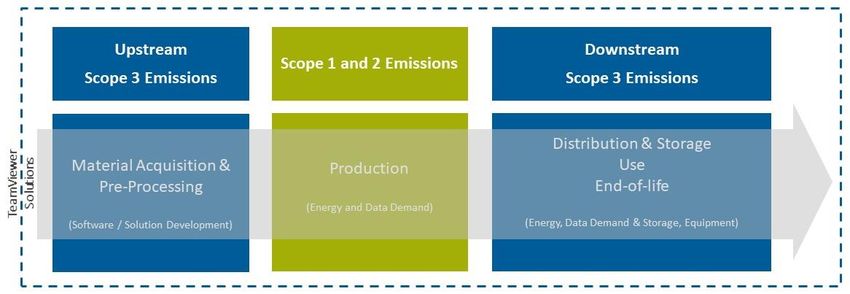
2 Methodological approach

2.1 Greenhouse Gas Protocol on avoided emissions
The figure below shows the overall structure and framework of the comparative emissions study. The
different components, the product carbon footprint, the Business-as-usual (BAU) system and the
quantitative and qualitative analysis are explained in the following sections.

Figure 2-1: PCF and comparative emissions structure and framework

The Product Carbon Footprint (PCF) builds the basis of the study, representing the overall emissions
of the TeamViewer portfolio considering use clusters and use frequencies. The Business-as-usual
Scenario or BAU-System embraces the alternative scenario in which TeamViewer solutions were not
available and user needed to travel to substitute what is gained by TeamViewer solutions. The
quantitative and qualitative analysis consists of an online customer survey and customer expert
interviews to gain valuable data and test the underlying study hypothesis.

2.2 Product Carbon Footprint
The basic element of this study was TeamViewer’s Corporate Carbon Footprint conducted in 2020,
which covers the overall amount of carbon dioxide (CO2) and six other greenhouse gas emissions2
associated with the entire activities of a company including Scope 3 emissions in the up- and
downstream value chain.

Based on this assessment, the Product Carbon Footprint was developed analysing the life-cycle
emissions of the complete TeamViewer Solutions Portfolio (Figure 2-2). The functional unit of this ICT
System was the service provision of TeamViewer services in a year, including the products

2
  The Carbon Footprint and the comparative emissions assessment include emissions of CO2 and six other
greenhouse gas types specified in the Kyoto Protocol and adopted by the GHG Protocol standard: methane
(CH4), nitrous oxide (N2O), hydrofluorocarbons (HFCs), perfluorocarbons (PFCs), sulphur hexafluoride (SF6) and
nitrogen trifluoride (NF3) - GHG Protocol 2013

                                                                                                            4
TeamViewer, TeamViewer Meeting, TeamViewer Pilot and TeamViewer IOT. To estimate emissions
on a product level the allocation approach was chosen with yearly overall emissions as basis. The
allocation was performed by using output of the analysed solution compared to the overall share
especially with the share of data traffic needed and time used for each solution.
Figure 2-2: Life cycle stages of a product in relation to Corporate Carbon Footprint scopes defined by
the Greenhouse Gas Protocol3
The Carbon Footprint calculations are oriented on the accounting and reporting framework developed
by the Greenhouse Gas Protocol, namely the “Corporate Standard”, “Scope 3 Standard”, and “Product
Life Cycle Accounting and Reporting Standard”4. For evaluating product emissions specifically for the
TeamViewer portfolio and considering sector specific requirements, the ICT Sector guidance “ICT
Sector Guidance built on the GHG Protocol Product Life Cycle Accounting and Reporting Standard”
was used as an additional methodological framework for the Carbon Footprint calculation.5
2.3 Use case cluster and influencing factors
To calculate the emissions of the ICT system model it was necessary to cluster the possible use habits
into use cases applicable for the TeamViewer product portfolio. The criteria for the use cases to be set
were driven by data availability, applicability and practicability. In order to decrease complexity the
use cases were clustered around three criteria: i) TeamViewer solution and session duration, ii)
distance bridged per connection and iii) frequency of use.
The figure below shows the three criteria applied to the ICT System resulting in 54 use cases. Each
cuboid is a specific use case within the ICT portfolio dimensions for calculating the ICT System
emissions.
3
GHG Protocol 2011
4
GHG Protocol 2011
5
ICT Sector Guidance 2017
5Figure 2-3: TeamViewer clustering criteria for 54 use cases The session duration separation was
applied to TeamViewer with dividing it
into short (less than 30 minutes) and
long sessions (more than 30 minutes).
The product use frequencies were
divided into three categories of high
frequency (product use at least once a
week), medium frequency (product is
used less than weekly but at least once a
month) and high frequency (used less
than every month). The distances
bridged for occurring connections were
divided into three ranges. It was aimed
for applying distances that consider the
modal choices and travel habits. Less than 10 km was chosen to include inter-company and inter-city
connections that potentially influence the alternative travelling habits. 10 to 200 km was chosen due
to literature findings suggesting that business and personal trips have an average travel distance of
150 km and 200 km respectively6. Furthermore, at a distance longer than 200 km airplanes can begin
to be chosen for transport7 and, thus, this modal choice with a large impact on emissions begins to
come into effect here.
Only connections lasting longer than 30 seconds were taken into account to avoid counting
misconnections. Also taken into consideration were the total use time of TeamViewer solutions in
2019. This value was used as basis for calculating emission from electricity consumption due to using
TeamViewer with an average laptop. An additional input data point was the maximum storage
capacity held up for TeamViewer at the external data centres in 2019 to approach the actual emission
impact of the data traffic caused by using Team Viewer solutions as well as an approximation of data
centre energy consumption. The emissions were calculated using the specific emission factors and
considering the regional split.
For the calculation of the Product Carbon Footprint some slight deviations were made. A screening
showed that electricity as well as data traffic for software development (including updates) are
negligible (2.4 Business-As-Usual scenario (BAU System)
For estimating the potential enabling effect of the TeamViewer portfolio, the attributional approach
following the “Estimating and Reporting the Comparative Emissions Impacts of Products” guidance
and the “Evaluating the carbon reducing impacts of ICT -An assessment methodology” was used9. The
attributional approach estimates the GHG impacts as the difference in the amount of emissions from
a scenario with the TeamViewer services in comparison to the scenario (business-as-usual i.e. BAU
scenario) where these services do not exist i.e. are not or cannot be used. A positive difference is
referred to as “avoided emissions” such that the product or service reduces emissions in comparison
to the base case10.
The BAU system in this comparative emissions study are activities related to travelling like business
travel, technical maintenance and IT support. The hypothesis is that using TeamViewer products (ICT
system) leads to less need for travelling because solutions can be found virtually. For example, if
TeamViewer did not exist, it is likely that a technician would travel to repair, update or maintain the
machine.
The determination of avoided emissions for the ICT System is subject to a wide range of influencing
variables and dependencies. It is, therefore, a multidimensional problem. This multi-dimensionality
could for example include social and regional differences in the choice of mode of transport or
structural changes initiated by hiring local IT support instead of travelling. The present study gives a
first insight into the complexity of the subject and, to reduce complexity, only focusses on distance
and use frequency as influencing factors. The possibility bundling of travel activities was accounted
for in the customer survey so that interdependencies of distances and frequency are covered.
By using TeamViewer and remote access to the machine or tool, this travel activity can potentially be
avoided (Table 2-1).
Table 2-1: ICT and BAU system scope
System Description Components of the system
TeamViewer Remote connectivity & Data centres, network connections, electricity
portfolio telecommunication need
Business-as-usual Business travel for maintenance, support Private / business vehicles, Local public
(BAU) & business meetings transport, Railway transport, Airplane travel
In order to estimate the net enabling effect of TeamViewer solutions, the primary enabling and
rebound factors were included (Table 2-2). Primary enabling effects refer to the immediate positive
impact a product or service has on reducing emissions. Direct emissions mean the immediate negative
impact of the product or service by increasing overall emissions. The rebound effect refers to a
situation where emission savings are offset by an increase of emissions in another activity.
9
GeSI and BCG 2010
10
WRI 2019
7Table 2-2: Primary and secondary enabling and rebound effects
Effect Primary
Enabling Primary enabling
Decrease emissions Potential immediate reduction of BAU system emissions occurring: decrease in
overall business travelling activities as a result of TeamViewer solution portfolio
Direct ICT emissions Primary, direct ICT emissions
Increase emissions Emissions generated by the TeamViewer products through data traffic and data
center energy need (see chapter 4.3)
Rebound Primary rebound
Increase emissions Increased energy consumption for running TeamViewer products
The underlying hypothesis is that if TeamViewer products, and similar applications, would not exist,
travelling would be the alternative. In order to account for different use case scenarios, potential
bundling of journeys and travelling behaviours, case studies were conducted. Travelling in general can
be done with 1) the private or business vehicle, 2) via train, 3) using air transport, 4) local public
transport, biking or walking in close proximities.
Each of the 54 identified use case, i.e. TeamViewer solution application, could potentially be
substituted with travelling using one of the above-mentioned modes of transport. This leads to 216
different user profiles in the BAU scenario that were looked at for estimating the avoided emissions
(54 dimensions and four different modal choices). For example, a very frequent TeamViewer use case
is a session lasting less than 30 minutes, occurring at least once a week with a partner or device within
a short proximity. The TeamViewer use case, if TeamViewer (or similar solutions) were not available,
would substitute approximately every tenth session with travelling a short domestic distance by car.
In comparison, a less frequent TeamViewer use case is a session lasting more than 30 minutes,
occurring at least once a year bridging a long distance. The TeamViewer use case, if TeamViewer (or
similar solutions) were not available, would substitute approximately every fourth session (see survey
results, chapter 4.3) with travelling a long distance by plane.
Besides taking into account the modal choice it is also necessary to understand the potentially
travelled distances in the BAU scenario. With regard to emissions, it can generally be said that the
longer the distance the more emissions are produced even though the amount of emissions per
kilometre might reduce, especially with airplane emissions where starting and landing have a relatively
higher impact the shorter the distance11. Thus, the distances for airplane travelling were taken into
account with great care. For the emission impact calculation, the distances for airplane travelling were
divided into three ranges of short-, medium- and long-haul. For short-haul an average flight distance
of 500km was assumed as domestic flight with a split of 16% of all flights (based on EU air travel
behaviour). The medium-haul is set at an average bridged distance of 1.500 km as an average between
short- and long-haul with a share of 34% of airplane travelling. It was assumed that an average long
distance business travel by plane bridged a distance of 2.500 km12. The long-haul is set an average
distance of 2.500 km with 50% of all flights occurring in this range13.
11
ICAO, 2018
12
Statistisches Bundesamt 2012
13
Eurostat 2020
8The distances for car, rail and walk/bike/local public transport were also divided into three distance
categories of 200km (500km for calculation).
2.5 Quantitative and qualitative analysis
The input data was established by literature research and analysis and two descriptive case studies. In
order to test and verify the assumptions and hypothesis introduced for the BAU system, case studies
were conducted. The chosen approaches were explanatory, as an online customer survey, and
descriptive case studies, as expert interviews, to describe and test the assumptions in the real-life
context. This was on the one hand necessary to understand and test the use cases chosen and the
related BAU scenarios. It was also necessary to gain insight into modal choices in relation to distance
and bundling of journeys for users of TeamViewer solutions.
To assure data quality and ethics the survey was set as voluntary, available to all users of TeamViewer
Core product where the survey was distributed given the constraint of availability. The participation
was anonymous. The data could not be used to conclude the origin or any other user specific data.
The expert interviews were conducted virtually via TeamViewer Meeting. The participants were
informed of the background of the topic and the purpose. It was aimed at taking no influence during
questioning by avoiding interpretation or explanation beforehand to avoid bias. The answers were
documented in the online survey and can, thus, not be tracked or traced to the expert participant.
Due to confidentiality the customer experts cannot be named and the interview results cannot be
published14.
14
For reference please refer to the TeamViewer AG CCO
93 Study results
The estimated total avoided emissions for TeamViewer Germany AG amount to approximately 37 Mt
CO2e. This number represents the difference between TeamViewer portfolio emissions of 100.000 t
(ICT system) CO2e and approximately 36,9 Mt CO2e potential travel emissions (BAU system). This
result is based on the chosen input information and data verified by the quantitative and qualitative
analysis.
Figure 3-1: Comparative emission result as avoided emissions15
The results show that using TeamViewer products has a net enabling effect on global emissions due
to avoided emissions from travelling activities. However, it should be noted that the input parameters
play a significant role in the result
Depending on the input parameters the conducted sensitivity analysis shows that the amount of
avoided emissions can lie between 20 and 60 Mt CO2e.
Figure 3-2: Sensitivity of long-haul flight distances Especially the effect of airplane travel with
on avoided emissions regard to frequency and distance has a high
impact on the overall avoided emissions. The
basis for the present air travel emissions
calculation was an average long distance of
2.500km. If this amount changes and, for example,
increases to an average distance of a flight from
Frankfurt, Germany, to New York, USA, the
emissions that can be avoided by using
TeamViewer instead amount to approximately 55
Mt CO2e. The same is true if the average distance
is set to 1.000 km which decreases the amount of
emissions avoided when using TeamViewer
products to roughly 20 Mt CO2e. The figure below
shows the sensitivity of the medium flight
distances for the overall avoided emissions result,
for example, if the long-haul distance lies at 6.500 km the amount of avoided emissions ranges around
60 MT CO2e.
15
Values are rounded figures
10In the current comparative emissions calculation, it was assumed that 16% of air travel occurs in
domestic distances averaged at 500 km. If, as was recently discussed in European politics, domestic
flights were banned entirely and, thus, decreased to 0% assuming a change to train travel instead,
avoided emissions would decrease to 35 Mt CO2e. If, on the other hand, the domestic travel frequency
would increase to 25% with more people travelling overall, using TeamViewer products could avoid
emissions of approximately 37 Mt CO2e.
Sources of uncertainty
As part of the study, an error analysis was conducted to quantify bandwidths and data variability. By
way of example, the following input assumptions and data points will be discussed in terms of their
effect:
1) Emissions from data: A source of uncertainty is to be seen with estimating data centre and
data traffic emissions used for the PCF and the comparative emission study. Only few peer-
reviewed information sources exist for approaching their calculation and use general average
data form different data centre set-ups or data traffic pre-conditions not all necessarily
applicable to TeamViewer products. Additionally, the information on energy consumption of
GB/kWh to estimate data traffic emissions is based on data from 201516. With increasing and
fast developing data energy efficiencies this value might be lower than assumed for this study.
2) Availability of data: Another uncertainty to be considered concerns the available primary data.
The amount of data traffic used for emission estimation is based on the maximum storage
capacity retained for TeamViewer at the various external data centres rather than the actual
data traffic produced by using TeamViewer products. This value, therefore, contains
uncertainty and is likely to be a conservative estimation.
3) Travel distances: With regard to the BAU system, the distances chosen for calculation
travelling emissions are a source of uncertainty. Sources differ on what maximum and average
distances are appropriate and applicable for the different modal choices. Additionally, the
modal choice and distance relation differs in different countries and even regions. The chosen
data represents an average slightly more influenced by European data due to availability and
applicability. Furthermore, the present study analysed the one-dimensional alternative of
avoided travel. The choice of mode of transport can depend on other influences beyond
distance such as availability or monetary aspects which were not analysed in this study.
The examples illustrate the derivation of robust statements. Nevertheless, the study succeeded in
demonstrating the positive one-to-one effect of IT use on the reduction of climate gases.
16
Aslan et al. 2017
114 Conclusion and outlook
Interpretation of results
In light of increasing atmospheric CO2 levels and global temperature increase, this study has shown
that using TeamViewer products has a positive effect on global emissions as emissions can potentially
be avoided.
The analysis of results and data has, however, also shown that the data is sensitive. Changes in the
basic assumptions, especially regarding the use of airplane as main mode of transport and the
potentially travelled distance can change the actual emissions avoided: the more and the farther the
user would fly, the more emissions can be avoided if TeamViewer products are used instead.
It has also become clear that the overall user behaviour towards products but also on travelling
activities influences the positive impact on comparative emissions and drives the enabling effect for
TeamViewer products.
The sensitivity analysis has shown that the avoided emissions can most likely be found at 37 Mt CO2e
within a range of 20 Mt CO2e and 60 Mt CO2e for TeamViewer products in 2019.
Comparative assertions i.e. claims regarding the overall environmental superiority or equivalence of
a product versus a competing product are not supported by this study. The results of the comparative
emissions study need to be reported separately from TeamViewer AG own emissions and cannot be
seen as a balance sheet of compensating or reducing own emissions17.
Outlook
Regarding the Product Carbon Footprint for the next year, it is suggested to put an even stronger focus
during data collection and analysis on categories of high importance and improvable data quality, like
data centres and product use.
It is suggested that to increase data quality and comparability the data inputs are further analysed and
improved continuously. Included should be a better understanding of customer behaviour and the
relation of user and connections. This could further be supported by expanding the present project
boundaries to secondary effects. Regarding the impact of user behaviour and to make the present
results comparable it is suggested to repeat the survey at a later stage.
17
WRI 2019
12Index and references
Index of figures
Figure 2 1: PCF and comparative emissions structure and framework 4
Figure 2 2: Life cycle stages of a product in relation to Corporate Carbon Footprint 5
Figure 2 3: TeamViewer clustering criteria for 54 use cases 6
Figure 3 1: Comparative emission result as avoided emissions 10
Figure 3 2: Sensitivity of long-haul flight distances on avoided emissions 10
Index of tables
Table 2 1: ICT and BAU system scope 7
Table 2 2: Primary and secondary enabling and rebound effects 8
References
- Last access to all online resources: December 2020
ACRP (Airport Cooperative Research Program), 2019:
Air Demand in a Dynamic Competitive Context with the Automobile. The National Academics of Sciences, Engineering,
Medicine, chapter 3, pp. 35-44
https://www.nap.edu/read/25448/chapter/5#43
Aslan, J., Mayers, K., Koomey, J.G., France, C., 2017
Electricity Intensity of Internet Data Transmission: Untangling the Estimates. Journal of Industrial Ecology, vol. 22 (4), pp.
785-798
atmosfair gGmbH, 2016:
atmosfair Flight Emissions Calculator - Documentation of the Method and Data
https://www.atmosfair.de/wp-content/uploads/atmosfair-flight-emissions-calculator-englisch-1.pdf
Eurostat, 2020:
Passenger transport statistics
https://ec.europa.eu/eurostat/statistics-
explained/index.php/Passenger_transport_statistics#Modal_split_of_inland_passengers
GeSI (Global e-sustainability initiative) and BCG (Boston Consulting Groups), 2010:
Evaluating the carbon reducing impacts of ICT - An assessment methodology
https://www.sustainabilityexchange.ac.uk/files/evaluating_the_carbon_reducing_impacts_of_ict_1.pdf
GHG Protocol 2013:
Required Greenhouse Gases in Inventories - Accounting and Reporting Standard Amendment, February, 2013
http://ghgprotocol.org/sites/default/files/ghgp/standards_supporting/Required%20gases%20and%20GWP%20values_0.p
df
GHG Protocol 2011:
Corporate Value Chain (Scope 3) Accounting and Reporting Standard - Supplement to the GHG Protocol Corporate
Accounting and Reporting Standard (Print version)
http://www.ghgprotocol.org/sites/default/files/ghgp/standards/Corporate-Value-Chain-Accounting-Reporing-
Standard_041613_2.pdf
ICAO 2018:
ICAO Carbon Emissions Calculator Methodology
https://www.icao.int/environmental-
protection/CarbonOffset/Documents/Methodology%20ICAO%20Carbon%20Calculator_v11-2018.pdf
13ICT Sector Guidance 2017:
ICT Sector Guidance built on the GHG Protocol Product Life Cycle Accounting and Reporting Standard
https://ghgprotocol.org/sites/default/files/GHGP-ICTSG%20-%20ALL%20Chapters.pdf
Ifmo (Institute for mobility research) 2014:
Long-distance Mobility - Current Trends and Future Perspectives
https://www.ifmo.de/files/publications_content/2014/ifmo_2014_Long_Distance_Mobility_en.pdf
Statistisches Bundesamt Presseportal, 2012:
Zahl der Woche: Durchschnittlich 2 500 Kilometer legten Flugpassagiere 2011 auf Auslandsreisen zurück
https://www.presseportal.de/pm/32102/2269409
WRI (World Research Institute), 2019:
Estimating and Reporting the Comparative Emissions Impacts of Products by Stephen Russel
https://ghgprotocol.org/sites/default/files/standards/18_WP_Comparative-Emissions_final.pdf
Munich/Germany, February 2021
Founded in 1999 as a spin-off of the technical University of Munich, the DFGE – Institute for Energy, Ecology and Economy
provides consulting services in the field of sustainability. Our offer Sustainability Intelligence featuring calculation
management, reporting solutions and strategy development aims at bundling the effort of taking part in several
sustainability/CSR standards and rankings like CDP, UNGC, DJSI, EcoVadis or GRI as well as building overarching strategies,
such as a sustainability strategy according to the SDGs. As the unique partner of the CDP for SBTs, DFGE provides its
customers with comprehensive advice on climate strategy and helps them to operate climate-neutrally at product level or
company-wide. To enable a future AI-based CSR management, DFGE researches in big data approach and machine learning.
Our clients comprise international companies (DAX and fortune 500), SMEs, governmental organizations or territorial
authorities.
The DFGE disclaims all warranties as to the accuracy or completeness of the given information. All opinions and estimates
included in this report constitute DFGE's judgment as of the date of this report and are subject to change without notice.
DFGE shall have no liability for errors, omissions, or inadequacies in the information contained herein or for interpretations
thereof.
All trademarks and registered trademarks are the property of their respective owners.
This document was submitted by:
DFGE – Institute for Energy, Ecology and Economy
Kreitstr. 5, 86926 Greifenberg, Germany
T. +49.8192.99733-20 / F. +49.8192.99733-29
info@dfge.de
www.dfge.de
14You can also read