Connect the dots: Deriving insights from thousands of 'omics datasets - Land Explorer for QIAGEN Ingenuity Pathway Analysis (IPA) - QIAGEN Digital ...
←
→
Page content transcription
If your browser does not render page correctly, please read the page content below

Land Explorer for QIAGEN® Ingenuity® Pathway Analysis (IPA®)

                    Connect the dots: Deriving
                    insights from thousands of
                    ‘omics datasets

Sample to Insight
With the rise of ‘omics technologies and large-scale consortia projects, biological systems are studied at an
unprecedented scale, generating enormous numbers of heterogeneous and often large datasets. These
high-throughput technologies enable ‘omics studies that evaluate thousands of genes and millions of
variants. Approaches to combine many thousands of datasets spanning multiple ‘omics types provide a more
comprehensive understanding of complex genotype-phenotype associations than the analysis of a single
dataset alone. To make this easier to do, Land Explorer for QIAGEN IPA brings together the data for over
half a million ‘omics samples into one intuitive interface.

                     It can be burdensome to compile, store,              a conceptual challenge but a practical
                     search, analyze and visualize all relevant           hurdle in the daily analysis of ‘omics data.
                     information from massive repositories of             Even with sufficient resources to download
                     ‘omics experiments for medical conditions,           and store the data, it takes a combination
                     such as how gene regulation changes                  of biology expertise to properly annotate
                     by tissue, disease or treatment condition.           various features related to the samples
                     Mining data and the literature can identify          or subjects from which the data was col-
                     some key links; still, data relevant to              lected, bioinformatics skills for reanalyzing
                     research is often buried or hard to find,            datasets to be consistent with one another,
                     limiting the identification of meaningful            and further resources to publish them to
                     connections. Researchers often end up                researchers in a comprehensible interface.
                     ‘cherry picking’ the studies they use for
                                                                          “The quintessential inquiry in the genomics
                     comparisons, leading to results that may
                                                                          era,” postulates Dr. Ben Darbro, M.D.,
                     be biased in favor or against a particular
                                                                          Ph.D., Associate Professor and Director of
                     association.
                                                                          the Shivanand R. Patil Cytogenetics and
                     Yet, to explore these highly valuable but            Molecular Laboratory at the University
                     complex datasets constitutes not only                of Iowa, “is, ‘Here’s my data, give me

                                     “I use IPA quite a bit because there’s nothing that has
                                     more information. There’s nothing out there that has this
                                     kind of knowledge base behind it.”

                                     Dr. Ben Darbro, M.D., Ph.D., Associate Professor and Director of the
                                     Shivanand R. Patil Cytogenetics and Molecular Laboratory at the University of Iowa

2 	                                                                                               Connect the dots   10/2020
an answer’. That’s always been the               Ultimately, it is difficult and time-consum-
question ever since we started to                ing to analyze, interpret and contextualize
develop ‘omics techniques. One gene, one         findings from ‘omics experiments, which
hypothesis, one system – that’s pretty easy to   slows down scientific discovery. Therefore,
interpret. But anytime you get into the          there is a need for robust and advanced
‘omics       space—whether       proteomics,     analysis strategies to harness the value
transcriptomics, genomics—it’s really hard       of these comprehensive high-throughput
to focus on just one thing in an analysis.       data, to make it easier to identify true
Not to mention, you wouldn’t want to do          associations and reduce the number of
that, because you would be wasting all the       false associations.
rest of this information.”

Land Explorer for QIAGEN IPA:
A massive collection of ‘omics data at your fingertips
Land Explorer for QIAGEN Ingenuity               IPA to discover its tissue or cell expression
Pathway Analysis (IPA) is QIAGEN’s web-          in other samples or datasets. For biologists
based platform that helps life science           that would like to draw on the vast number
researchers perform insightful data analysis     of ‘omics data types, Land Explorer is a
and interpretation. It enables the under-        great resource that also serves as a central
standing of experimental results within the      location to visualize these data in various
context of various biological systems, and       ways, and works through web browsers,
empowers contextualizing findings from           allowing the exploration and visualiza-
QIAGEN IPA against more data than could          tion of large amounts of content in one
ever be analyzed by a single person.             place (Table 1), without having to install
This powerful tool dramatically accelerates      separate software platforms. Not only does
data interpretation, hypothesis generation       Land Explorer free up time and resources
and, ultimately, scientific publication.         to create impactful visualizations with
                                                 public datasets, but it also helps you
Land Explorer for IPA enables you to
                                                 develop and vali-
access a vast amount of information to
                                                 date      research
identify gene signatures and explore ‘omics
                                                 hypotheses         and                “The number one thing that
data for individual genes and to visualize
                                                 provides evidence                     stands out in QIAGEN IPA
expression correlation across multiple
                                                 that can be used                      versus any other solution is that
genes. You can jump from a gene of
                                                 for publication.                      it’s intuitive and easy to use.“
interest identified in an analysis in QIAGEN

Connect the dots   10/2020	                                                                                   3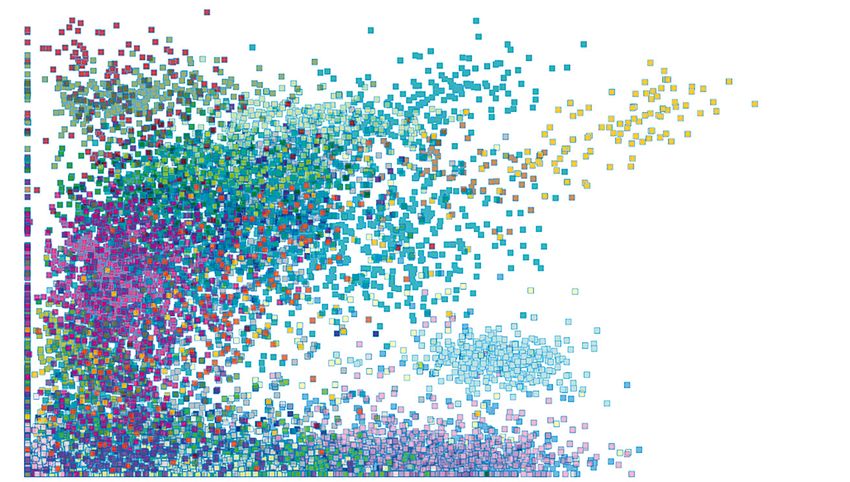
To provide comprehensive systems biology         datasets,   including        RNA-seq          gene/
                               analysis, Land Explorer facilitates the          transcript expression, RNA-seq gene
                               interrogation of findings in real time against   fusion expression, expression microarrays,
                               a library of over 500,000 samples across         methylation          microarrays,     miRNA-seq,
                               tissues, treatments and diseases from            reverse phase protein lysate microarray
                               thousands of ‘omics experiments to identify      (RPPA), somatic mutations, copy number
                               unique or common biological features.            alterations and curated metadata/survival
                               You can explore a wide variety of ‘omics         data (Table 2). Land Explorer lets you
                                                                                survey interactive plots of gene expression
Table 1. Data sources for Land Explorer*
                                                                                in 51 human tissues for gene-level and
  Land Name                     Land Type   Sample Count    No. Data Types
                                                                                individual splice variants and visualize
  GTEx                          BodyMap        17783              7
                                                                                patterns        of     differential      transcript
  Blueprint                     BodyMap         629               6
  HPA                           BodyMap         373               8             expression across multiple parameters
  HumanRNAi                     Cell line       1298              1             (Figure 1), including cell type, cell line,
  CellLine_GSK                  Cell line       1289              2
                                                                                tissue, disease, treatment, sample type
  CCLE                          Cell line       1054             14
                                                                                and project or clinical metadata. Besides
  CellLine_Pfizer               Cell line       399               2

  HumanCRISPR                   Cell line       342               1
                                                                                viewing a single data type in Land Explorer,
  CellLine_NCI                  Cell line       299               3             correlation views let you integrate different
  LINCS                         Cell line      115210             1             data types for samples with, for example,
  HumanDisease                  Disease        158996            10             both gene expression data and copy
  MouseDisease                  Disease        52422              9
                                                                                number variation data. With this solution
  RatDisease                    Disease         9667              8

  TCGA                          Oncology       22687             14
                                                                                for ‘omics data analysis, you can inspect
  ICGC                          Oncology       11805             10             expression, mutation status, copy number
  METABRIC                      Oncology        4129              2             and other details from any gene of interest
  TARGET                        Oncology        3942             12             using thousands of statistical comparisons
  expO                          Oncology        2159              1
                                                                                from a consistent data analysis, processing,
  BeatAML                       Oncology        666               8

  CGCI                          Oncology        110               6
                                                                                curation and statistical pipeline (Figure 2)
  OncoGEO                       Oncology       63816             11             to make true apples-to-apples comparisons
  Hematology                    Oncology       29492             12             between different studies. Such a feat
  TumorMutations                Oncology       21508              4             is simply not possible using other data
  ClinicalOutcome               Oncology       11405              1
                                                                                repositories.
  Pediatrics                    Oncology       11030             10

  MetastaticCancer              Oncology        4091              3

  OncoMouse                     Oncology        1733              8

*As of September 21, 2020

4 	                                                                                                       Connect the dots   10/2020
Table 2. Data types (and respective sample counts) available in Land Explorer

  •    RNA-seq gene/transcript expression, exons, junctions, fusions, mutations (70.000+)

  •    Expression microarrays (390.000+)

  •    Methylation microarrays (26.000+)

  •    miRNA-seq (16.000+)

  •    Somatic Mutations, copy number alterations (121.000+)

  •    Curated metadata/survival data

   A                                                                                     B

                                                                                         C

    Figure 1. Overall sample distribution from Land Explorer. The Sample Explorer lets you browse data across all available lands based on collections or
    individual lands for samples or tissues of interest and combine all oncology- and disease-focused studies in one simple interface. The Sample Explorer
    lets you survey 548,000 ‘omics samples from OncoLand and DiseaseLand, including 15 consortium databases (TCGA, LINCS, GTEx, CCLE, ICGC,
    TARGET and more) containing 184,000 samples, 6000 independent projects, over 331,000 samples from individual publications, 33,000 samples in
    specialty Lands and over 60,000 statistical comparisons.
    (A) Tissue distribution in Land Explorer. The tissue with the highest number of samples is blood, with over 150,000 samples and is followed by the
    central nervous system, which has 75,000 samples. (B) Land Explorer has multiple different experimental dataset types for a given sample set, including
    DNA-seq, RNA-seq, CNV, expression microarray and protein. (C) Tree block view of different sample types. The tree block view lets you filter down to
    samples or tissues of interest, identify which Land the samples are present within, and then quickly go into that Land that has already been pre-filtered
    to have the specific tissues that you would like to further investigate. Green: body map samples; turquoise: oncology-related samples; dark blue: non-
    cancer related disease samples; purple: cell line samples; light blue: non-categorized (other) samples.

Connect the dots   10/2020	                                                                                                                                 5
Case study: Identify genetic deter-                           critical for tumor suppression.” Tools in
                           minants of disease                                            IPA, such as Land Explorer, help reveal
                           Dr. Darbro’s research program focuses on                      the intersection between these two worlds,
                           the genetic determinants of disease and                       and inform one another. Dr. Darbro says,
                           is split into two research groups: germline                   “I think that’s probably the real strength
                           disorders and cancer. “I’m really inter-                      of looking at both germline disorders and
                           ested in that intersection [between germline                  cancer at the same time—that some of the
                           disorders and cancer], and I think one                        pathways and tools that you become quite
                           of the main areas of intersection is at a                     competent with, or developed, for one
                           pathway level,” Dr. Darbro says. “You                         group can also be used to study the other
                           think about things like conditions that lead                  group.”
                           to autism spectrum disorder or tuberous                       With this framework, Dr. Darbro’s team
                           sclerosis or other germline disorders, but                    also performs gene discovery in neuro-
                           they’re impacting pathways that are also                      developmental disorders like intellectual

                                                                                                                            Sample metadata
                                                    MetaData
                                                    Curation                                                                Project metadata

                                           • Multiple curators per project                                   Comparison/results
             Data                                                                            Data                                            Land
           Selection                       • Control vocabulary (CV)                        Analysis                                       Database
                                                                                                             Comparison metadata

                                           • Metadata QC

• Add new projects                                                                     • Stats modeling
  – driven by client requests                       Raw Data                           • Generate comparisons                  Sample signal
                                                   Processing
• Project sources are publicly                                                         • Post analysis QC
  available data
  – GEO, SRA, ArrayExpress,
                                                  • Signal extraction
    consortium repositories
                                                  • Normalization
• QC, project filtering
                                                  • Sample level QC
• Download raw data and meta data

      Figure 2. Land Data processing workflow. The ‘omics datasets in Land Explorer are curated and re-processed, adding extra value to each dataset. The
      QIAGEN team invested over 42,000 person-hours in expert curation to curate the more than 500,000 samples contained in Land Explorer. Furthermore,
      it has taken an estimated 835,000 CPU-hours (or 95.3 CPU-years) from SRA download to full analysis, to analyze the 83,500 RNA-seq samples
      contained in Land Explorer. Finally, performing statistical analyses on the 325,000 samples used in comparisons converts to 9,750 person-hours of
      statistical analysis.

 6                                                                                                                           Connect the dots   10/2020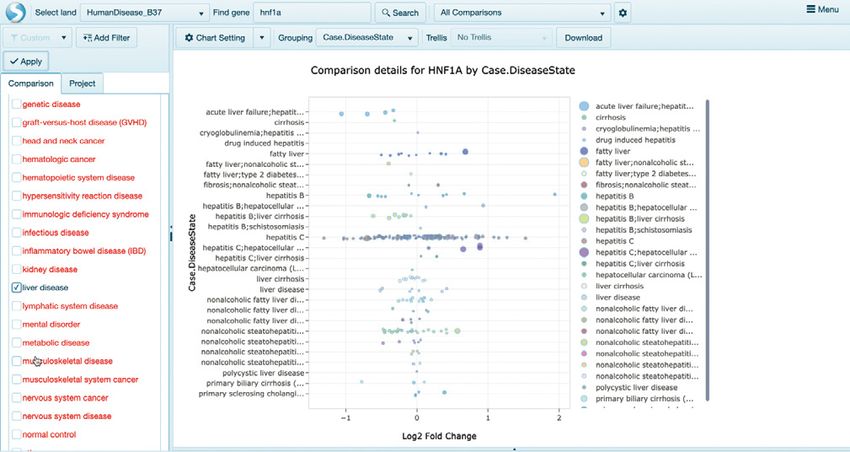
disability, autism spectrum disorder and         In     addition     to                 “Anytime you get into the
epilepsy. “We’re able to take a list of genes    discovering        how                 ‘omics space—whether
and start to try to see if there’s a relation-   genes are regulated                    proteomics, transcriptomics,
ship between them. One of the things we          in     disease     and                 genomics—it’s really hard
did after running an IPA analysis on genes       respond to gene                        to focus on just one thing in
was use Land Explorer to try to figure out a     mutations,         Dr.                 an analysis. Not to mention,
little bit more about some of the upstream       Darbro’s laboratory                    you wouldn’t want to do
regulators and the canonical pathways that       uses      tools     in                 that, because you would be
we found to be enriched. We try to branch        QIAGEN IPA, such                       wasting all the rest of this
out and say, ‘all right, well, what other        as Land Explorer                       information.”
studies have seen this as well? What other       and        Analysis
studies have these pathways or these             Match, to go one
upstream regulators enriched?’”                  step     further    to
                                                 explore drug treatments. “The other way
To take the exploration of these genes and
                                                 we use IPA—that I think is probably how
the underlying biology to the next level,
                                                 we’re going to continue to use it heavily
Dr. Darbro’s research groups look at the
                                                 —is in the drug selection area. There’s no
functional relevance of these genes
                                                 shortage of drugs out there. There are
and associated networks and identify
                                                 entire screening facilities that exist where
biomarkers. “Not only is there an aspect
                                                 you send them some cells and they test a
of exploring those genes and how they
                                                 thousand drugs to see what they do. But
directly interact with one another, but also
                                                 using tools in IPA is really a much more
understanding what functional networks
                                                 targeted way to find drug candidates.”
they’re a part of. If we have expression
data and copy number data, we can
use IPA’s statistical framework to basically
say that this particular copy number
variant is functional because all of the
genes in it change their expression in
the right direction. ”Dr. Darbro says these
CNVs are often found in both germline
diseases and cancer. “They’re the kind of
things that make for decent biomarkers
because they’re probably actually involved
in the pathogenesis...as opposed to the
myriad of ‘bystander lesions’ that show up.”

Connect the dots   10/2020	                                                                                  7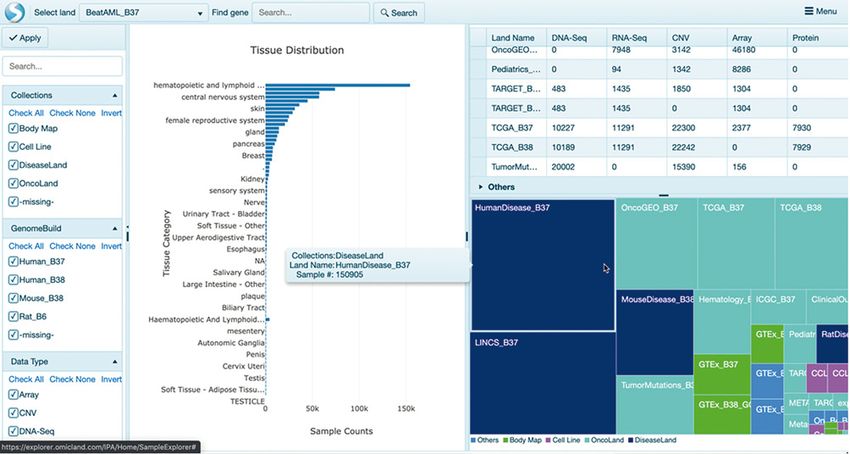
How Land Explorer for IPA can help advance
                            your research
                            Explore differential expression in                               comparisons where HNF1A is up- or
                            human disease studies                                            down-regulated. Filters enable you to
                                                                                             focus on specific human diseases, such
                            Land Explorer for QIAGEN IPA tremen-
                                                                                             as liver diseases (Figure 3). This reveals
                            dously accelerates how you examine gene
                                                                                             several studies that found significant
                            expression in studies of human diseases
                                                                                             differential regulation of HNF1A, such as
                            to identify gene signatures and discover
                                                                                             those in hepatitis C, hepatitis B and acute
                            biomarkers. For instance, the gene
                                                                                             liver failure. You can further survey these
                            HNF1A is a transcription factor highly
                                                                                             studies in more detail, such as all the genes
                            expressed in the liver and regulates the
                                                                                             differentially regulated in those studies.
                            expression of several liver-specific genes.
                                                                                             This ability to start with a specific gene of
                            In Land Explorer, there are many different
                                                                                             interest, then focus on a specific tissue,

Figure 3. Comparison of the HNF1A gene expression by disease state. Statistical comparisons for differential expression of HNF1A in liver diseases
using a bubble plot. HNF1A was found to be down-regulated compared to the control samples in acute liver failure, but different studies found HNF1A
to be either up-regulated or down-regulated in hepatitis C, depending on the experimental conditions. X-axis represents differential gene expression of
HNF1A by Log2 fold change. Y-axis represents individual disease states. Bubble size represents the significance (p-value) from the differential expression
(DESeq2 for RNA-seq and General Linear Model for microarray) of HNF1A. Larger bubbles represent greater significance. Selecting dot(s) in this view
will populate a Details table at the bottom of the view showing some key metadata from the comparison(s).

8 	                                                                                                          Land Explorer for QIAGEN IPA      10/2020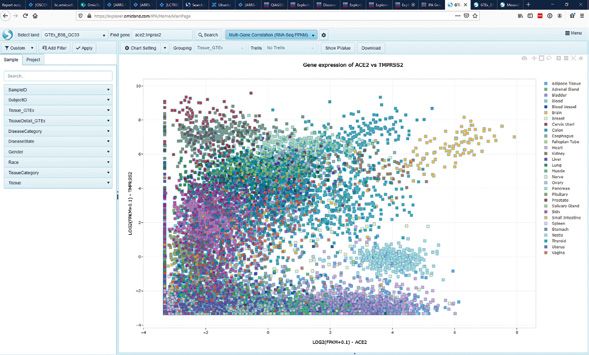
and then to include other significant genes,    Discover survival rates for cancer
allows you to expand gene signatures to a       gene mutations
whole set of genes in minutes. These genes
                                                Land Explorer for IPA enables the explora-
can then be explored further in QIAGEN
                                                tion of mutations for a particular gene, to
IPA to understand the biological underpin-
                                                get answers about how these mutations
nings of the studies.
                                                affect the expression of other genes, what
Explore gene expression in                      diseases they may influence and how they
normal and disease cell types                   might affect patient survival. For example,
                                                the tumor suppressor gene PTEN is found in
When you want to assess ‘omics data,
                                                most tissues, and mutations of this gene are
such as gene expression, from different cell
                                                involved in the development of many can-
types, major difficulties include finding the
                                                cers and other diseases (Figure 4A). Land
right datasets to analyze, and processing
                                                Explorer incorporates several public datas-
these datasets to make them comparable.
                                                ets to facilitate ‘omics analysis and improve
This can be resource-intensive, both in
                                                the level of generated insights. By featuring
terms of funds and time, and becomes more
                                                a collection of highly curated ‘omics data,
and more difficult with the number of data-
                                                Land Explorer streamlines the analysis pro-
sets that you include, since each one must
                                                cess to quickly focus efforts toward can-
be processed to make it comparable. Land
                                                didates with clear biological relevance to
Explorer for QIAGEN IPA helps you exam-
                                                help you identify and explore contextual
ine gene expression in normal and disease
                                                data in seconds. Using Land Explorer, you
samples of specific cell types more effi-
                                                can survey the mutation prevalence across
ciently. For example, you can explore gene
                                                all the cancers within The Cancer Genome
expression in immune cells in both normal
                                                Atlas (TCGA), then subset samples from
and tumor samples. Land Explorer allows
                                                a particular cancer with a PTEN mutation
you to visualize differences in expression
                                                from samples that do not. From here, Land
across thousands of different samples with
                                                Explorer can generate the survival plots for
RNA-seq data, and filter down to the tis-
                                                PTEN in samples that are wild-type versus
sues (for example, blood, esophagus and
                                                cancer of interest (Figure 4B).
nerves) or by cell types (normal or tumor
samples of different immune cell types).

            “One of the things we did after running an IPA analysis on genes was use Land
            Explorer to try to figure out a little bit more about some of the upstream regulators
            and the canonical pathways that we found to be enriched. We try to branch out
            and say, ‘what other studies have seen this as well?’”

Land Explorer for QIAGEN IPA   10/2020	                                                            9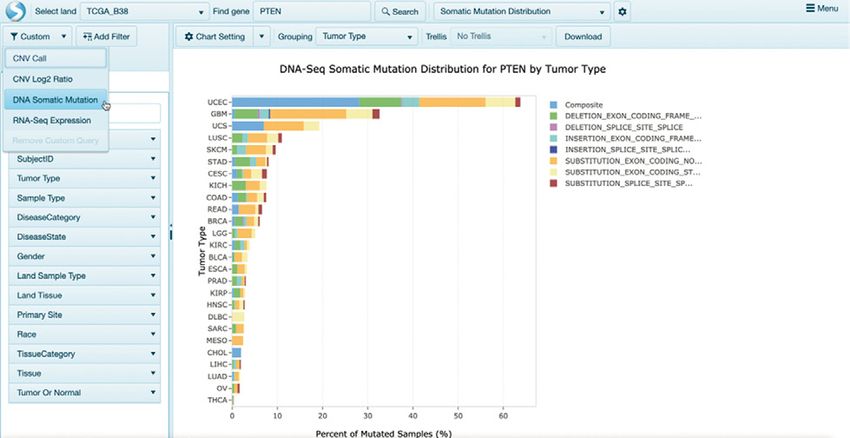
A

B

    Figure 4. (A) DNA-seq somatic mutation distribution for PTEN by tumor type. Somatic mutation distribution of PTEN in tumor samples from the Cancer
    Genome Atlas (TCGA), including insertions, deletions and substitutions. PTEN is somatically mutated in over 60% of uterine corpus endometrial
    carcinoma (UCEC) samples and over 30% of glioblastoma multiforme (GBM) samples. X-axis represents the percent of mutated samples. (B) Survival
    plots for PTEN wild-type versus PTEN-mutation in cancer samples of interest. Survival and disease-free survival time of patients with or without specific
    gene mutations for PTEN were analyzed using Kaplan-Meier curves.

10 	                                                                                                                              Connect the dots   10/2020
Explore genes implicated in a Explorer for IPA let you quickly narrow
disease down your focus to only the collection of
Upon identifying a list of genes from an studies that are of most interest. Finally, you
analysis in QIAGEN IPA, you can learn can look for co-expression or co-regulation
more about those genes individually in Land of genes like ACE2 with other genes like
Explorer. For example, Land Explorer can TMPRSS2—one of the essential host factors
aid in the study of the ACE2 gene, which is for SARS-CoV-2 pathogenicity (Figure 5B).
required for the SARS-CoV-2 virus to enter
cells and is responsible for the COVID-19
A
disease. Land Explorer for IPA contains a
vast amount of valuable information, such
as gene expression in normal tissue and
disease tissue, or whether the gene is dif-
ferentially over- or under-expressed across
thousands of studies that have been curated
and processed by QIAGEN experts. With
just a few clicks, you can investigate where
a gene is up- or down-regulated in human
disease studies, and which statistical com- B
parisons found differential regulation for
ACE2. Land Explorer for IPA enables you
to drill down on the studies that are of most
interest, with filters for metadata. For exam-
ple, if you are studying ACE2 you may be
interested only in projects concerning infec-
tious diseases (Figure 5A). Because the
QIAGEN curation teams carefully curate
samples using a controlled vocabulary for
each project, the metadata filters in Land
Figure 5. (A) Comparison of ACE2 gene expression by disease state. Statistical comparisons for differential expression of ACE2 in infectious diseases
(viral) using a bubble plot. X-axis represents differential gene expression of ACE2 by Log2 fold change. Y-axis represents individual disease states.
Bubble size represents the significance (p-value) from the differential expression (DESeq2 for RNA-seq and General Linear Model for microarray) of
ACE2. Larger bubbles represent greater significance. Selecting dot(s) in this view will populate a Details table at the bottom of the view showing some
key metadata from the comparison(s). (B) Co-expression of ACE2 and TMPRSS2 in human tissues. The multi-gene correlation view shows a scatter view
comparing the RNA-seq data for ACE2 and TMPRSS2. This scatter plot shows that ACE2 and TMPRSS2 are highly co-expressed in lung and brain
samples. Values plotted are Log2(FPKM + 0.1).
Connect the dots 10/2020 11Reveal the secrets of thousands of ‘omics Dr. Darbro reiterates, “I think the number one thing that
datasets to gain deeper biological insights stands out in QIAGEN IPA versus any other solution is
Land Explorer for QIAGEN IPA is a powerful resource that it’s intuitive and easy to use. Number two is the sheer
for life science researchers who want to gain deeper comprehensiveness. I use IPA quite a bit because there’s
insights into their biological data by quickly and easily nothing that has more information. There’s nothing out there
leveraging the vast number of available ‘omics datasets. It that has this kind of knowledge base behind it. The other
serves as a central location to visualize and compare these thing that IPA has is other tools. It’s great to have all these
data in many different ways with just a few clicks. With a analysis tools just in one place. I don’t think there’s been
continually growing catalog of over 500,000 curated a single project that I’ve worked on that we haven’t found
‘omics datasets, each which are carefully re-processed, a use for some of the tools from IPA like Land Explorer.”
you can quickly find answers to your most pressing Dr. Darbro reflects, “I first became a QIAGEN IPA
research questions. Explore valuable ‘omics datasets in a customer at least 10 years ago, and every single time we
simple and interactive way in order to easily understand must make a decision whether to renew [the license], we
gene expression data across tissues, discover how genes have.”
are regulated in diseases and in response to treatments
or mutations, and produce publication-quality visuals to
communicate your findings.
Understand complex ‘omics data. Start your free trial of Land Explorer for QIAGEN IPA today.
Visit digitalinsights.qiagen.com/IPA
QIAGEN Ingenuity Pathway Analysis (QIAGEN IPA) is intended for molecular biology applications. This product is not
intended for the diagnosis, prevention or treatment of a disease.
For up-to-date licensing information and product-specific disclaimers, see the respective Ingenuity product site. Further
information can be requested from ts-bioinformatics.qiagen.com or by contacting your local account manager.
Trademarks: QIAGEN®, Sample to Insight®, Ingenuity®, IPA® (QIAGEN Group). Registered names, trademarks, etc. used in this document, even when not specifically marked as such, are not
to be considered unprotected by law.
PROM-16459-001 1122214 10/2020 ©2020 QIAGEN, all rights reserved.
Ordering www.qiagen.com/shop Technical Support digitalinsights.qiagen.com/support Website digitalinsights.qiagen.com
1122214 10/2020You can also read