Rating of Various Indian Airlines on various parameters using Twitter Data
←
→
Page content transcription
If your browser does not render page correctly, please read the page content below

IOP Conference Series: Materials Science and Engineering

PAPER • OPEN ACCESS

Rating of Various Indian Airlines on various parameters using Twitter
Data
To cite this article: Hitendra Garg 2021 IOP Conf. Ser.: Mater. Sci. Eng. 1116 012122

View the article online for updates and enhancements.

                               This content was downloaded from IP address 46.4.80.155 on 04/08/2021 at 17:56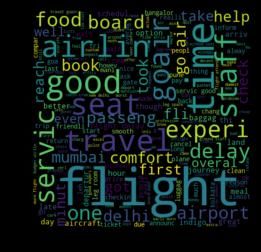
FSAET 2020                                                                                                               IOP Publishing
IOP Conf. Series: Materials Science and Engineering              1116 (2021) 012122           doi:10.1088/1757-899X/1116/1/012122

      Rating of Various Indian Airlines on various parameters
                         using Twitter Data

                                                                     Hitendra Garg
                                          Department of Computer Engineering and Applications,
                                                   GLA University, Mathura-INDIA
                                                        hitendra.garg@gmail.com

                     Abstract. In today‟s world, e-commerce markets runs on the sentiments of the customers as
                     they provides real feedback of the products or services. In such scenario, the companies tries to
                     collect data from different social media platform like instagram, Facebook, twitter, and other
                     sites where customers places their reviews and feedback about their experience on various
                     parameters. These organizations analyze these data as per their requirements for market
                     analysis, recommendation systems, feedback of the product/service, sentimental analysis etc.
                     In this proposed work, feedback/reviews of various Indian airlines like Air-India, Indigo, Go-
                     Air, Jet airways, Spice-Jet.is collected from twitter to rate the airlines services on various
                     parameters like food quality, staff, delay in time, turbulence, aircraft condition and value for
                     money parameters.

1. Introduction
Social networking sites have become a part of people‟s day to day life. Most of the people use it to
share their incidents from around the world on almost every possible topic. So, these sites like Twitter,
Facebook, Instagram etc have become a hub of user-generated data. Twitter also provide its API to
extract their data for free which has gain the attention of many companies, data analyst, scientific
researchers as well as government agencies to use this data and extract all the useful results and
conclusions for business purposes.
In the proposed work, we retrieved the tweets from twitter using „Tweepy‟ library of python to
compare the various Indian Airline companies on various service parameters that help the customer to
choose the best airline service according to their real feedback from various stakeholders. We also
compared and analysed the accuracy of our work using Naïve Bayes (Multinomial and Bernoulli),
SVM (Support Vector Machine) and Maximum Entropy to find out which algorithms works better on
obtained dataset.

2. Related Work
In recent years, analysis of social media data draws the attention of researchers due to variety and
volume of data set. Pang et al. in 2002, gathered the opinions of public about a movie by using movie
reviews data [7]. Dodds and Danforth in 2010 perform sentiment extraction of blogs. Parikh [3]
developed two classifiers for sentiment extraction from tweets and classify them in some predefined
categories like positive, negative and neutral tweets on the basis of Naive Bayes bigram classifier and
MaxEntropy model to categorize/classify input tuples (Tweets). Parikh [3] in their outcome describes
that the Naive Bayes bigram model classify the tweets in a much better way than the MaxEntropy
classifier.

              Content from this work may be used under the terms of the Creative Commons Attribution 3.0 licence. Any further distribution
              of this work must maintain attribution to the author(s) and the title of the work, journal citation and DOI.
Published under licence by IOP Publishing Ltd                          1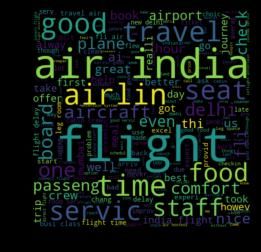
FSAET 2020                                                                                        IOP Publishing
IOP Conf. Series: Materials Science and Engineering     1116 (2021) 012122   doi:10.1088/1757-899X/1116/1/012122

Bhayani [4] draws a solution for sentiment analysis of twitter data by distant supervision, they took
data set for training where training data set consist of a number of tweets with emoticons and a testing
data set which consist of n testing tuples. They use three supervised learning models such as Naive
Bayes classifier, Maximum Entropy classifier and Support Vector Machines classifier (SVM). They
considered uigram, bigram and part-of-speech (POS) in their feature space (collection of feature
vectors). Bhayani [4] describes that SVM is best among those two classifiers and the case of unigram
is more effective than the case of bigram. But when they trained their maximum entropy classifier
using the combination of unigrams and bigrams then MaxEntropy classifier performs much better than
other classifiers which are trained from a combination of POS tags and unigrams by almost 3%.
Abhishek bhola [8] has conducted a study on twitter data about 2014 central election in India to know
the opinion of the public towards different political parties and candidates of those parties. He
prepared a dataset of 17.60 million tweets and then performed a sentiment analysis on that dataset to
find how many persons at any location or time are in the favor of any particular party or candidate or
how many people are interested in giving their vote to any political party.
B. Pang [5] performed an extensively large survey on sentiment analysis. They reviewed
approximately more than 300 research papers which includes various types of problems that
researchers faces during sentiment analysis and various tasks of opinion mining such as sentiment
extraction, classification, clustering, and calculation of polarity.
The twites, collected are examined with the objective of rating different airline services on the basis of
various parameters like delay time, staff behaviour, food quality, turbulence , aircraft condition value
for money etc using various machine learning techniques. These ratings helps the customer for
availing the services. In the proposed manuscript, data of various Indian Airlines services are collected
from twitters.
Initially, we have extracted the tweets from twitter using „Tweepy‟ library of python After pre-
processing and filtering the tweets and reviews we have classified them in three categories: positive,
negative and neutral using the „TextBlob‟ library of python. It is found that Trip-Advisor data contains
more positive sentiment data whereas twitter gives more negative sentiment data. Here, we compare
the performance of various airlines on the basis of six different parameters namely: time delay, food,
fare, staff, turbulence, aircraft conditions. This concludes that Trip Advisor data contains more
positive sentiment data whereas twitter gives more negative sentiment data. We have applied these
techniques describes as follow:

2.1. Bernoulli Naïve Bayes

Bernoulli Naïve Bayes uses naïve bayes classification specially in case of features based on Boolean
values. The decision rule is

                                   ( | )         (| )       (      ( | ))(     )

It penalizes the non-occurrence of feature I for class y, i.e. word occurrence vectors instead of word
count vectors are used to train and test the classifier.

2.2. Multinomial Naïve Bayes

Multinomial Naïve Bayes is for multinomially distributed data which is typically represented as word
vector counts. In text classification, the size of the vocabulary, „n‟ is the number of features for each
class y , parameter distribution vector is       (             ) where       is the probability ( | ) of
feature I appearing in a sample belonging to class y.      with smoothened parameter is :

                                                           2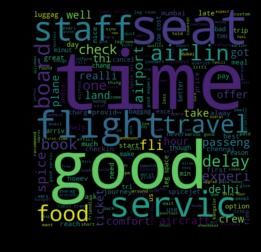
FSAET 2020                                                                                          IOP Publishing
IOP Conf. Series: Materials Science and Engineering    1116 (2021) 012122      doi:10.1088/1757-899X/1116/1/012122

Where             ∑        is the number of times feature I appears in a sample of class y in the training set
                 | |
T and         ∑           is the total count for all features for class y.   is the smoothing parameter.

2.3 Support Vector Machines

It tries to find a hyper plane which separates the data in two classes as optimally as possible. The set of
points are labeled with two categories (illustrated in Figure-1 with black and white points) and SVM
chooses the hyperplane that maximizes the margin between the two classes.

                                              Figure-1 depicting SVM

2.4 Maximum Entropy

The principle behind Maximum Entropy is the correct distribution that maximizes the Entropy /
uncertainty to meet the constraints set by the „evidence‟.
The maximum entropy suggest the unbiased model; events which are not excluded by known
constraints should be assigned as much uncertainty as possible, meaning the probability distribution
should be as uniform as possible. The mathematically the Entropy is given by
  ( )       ∑ (     )     (    ), so that most likely probability distribution is the one that maximizes
this entropy: P = arg maxH(p)
The proposed work is divided into three sections: First section deals with the analysis of data extracted
from a review site named is “Trip Advisor”, Second section is about the analysis of data obtained from
“Twitter”, a social networking site and lastly the third section deals with the analysis of different
machine learning algorithms and models like Naïve Bayes, Support vector machine, Maximum
Entropy etc. to explore their weaknesses and strengths in predicting the sentiments of a text obtained
from real life sources

3. PROPOSED METHODOLOGY
3.1 Analysis of Trip advisor reviews

3.1.1 Data extraction
Data has been extracted using “Scrapy”, a fast, open-source web crawling framework written in
Python, used to extract the data from the web page in JSON (Java Script Object Notation) format.
The extracted dataset contains about 6000 reviews on “Jet Airways”, 3000 reviews on “Air India”,
3500 reviews on “Indigo”, 1500 on “Spicejet” and about 500 on “Go Air”.

                                                          3
FSAET 2020 IOP Publishing
IOP Conf. Series: Materials Science and Engineering 1116 (2021) 012122 doi:10.1088/1757-899X/1116/1/012122
Figure-2 A review for Air India by some passenger posted on
Trip Advisor on 12 February 2018
3.1.2 Preprocessing of dataset
Obtained reviews have been used for analysis purpose and stop words, punctuation marks have been
removed followed by tokenization. Stemming is also performed in this step such that words like
departure, departed have been converted into depart. After preprocessing, reviews have been divided
into a bag of tokens.
3.1.2.1 Classification
In the proposed work, TextBlob Python library are used for classification followed by preprocessing.
Natural Language Processing and their associated functions are processed in python using TextBlob
libraries that provide a simple API.
These reviews have been passed through the classifier one by one to provide its polarity and
depending upon its sign (+ve, -ve or neutral). We classify these as Positive, Negative and Neutral as
shown in Figure-3. This classification simply states that Jet Airways is the most popular airline
followed by Indigo and Go Air among these five airlines. We normalize the chart as we can‟t compare
them due to popularity difference as shown in Figure-4. Figure-4 reports that Jet-Airways and Indigo
airlines are having the highest ratio of Positive reviews while Spice-jet has least. It is also concluded
that Air-India have highest ratio of negative reviews
Figure-3: Stacked bar graph depicting the distribution of sentiments of people
on different airlines
4FSAET 2020 IOP Publishing
IOP Conf. Series: Materials Science and Engineering 1116 (2021) 012122 doi:10.1088/1757-899X/1116/1/012122
Figure-4: Normalized version of graph depicting the distribution of sentiments
on different airlines
3.2.1.2 Word frequency
Word frequency of each data set presents the occurrence of words as shown by WordCloud graphs in
Figure-5. It describes that some words even having high frequency have no use as their removal is
necessary. Here, these words are „Air‟ ,'flight' ,'airlin' ,'goair' ,'indigo' ,'ground' ,'jet' ,'airways' ,'they'
,'i' ,'jetairways' ,'travel', 'also' ,'took' ,'spice jet', 'even', 'fli', 'also'. WordCloud graph after elimination
of these words is shown in Figure-6. The purpose of this exercise is to observe that people are mostly
talking about: Time, Staff, Value for money, Food, Turbulence and Aircraft condition. Now, we deal
with the reviews with these specific words.
Figure-5: Depicting frequency of different words in review dataset
Figure-6: Depicting frequency of different words after removal of useless words
5FSAET 2020 IOP Publishing
IOP Conf. Series: Materials Science and Engineering 1116 (2021) 012122 doi:10.1088/1757-899X/1116/1/012122
Figure-7: Graph depicting sentiment distribution of people on different parameters
The graph in Figure-7 shows the basic parameters like Time Delay, Value for money, Staff, Food,
Turbulence and Aircraft condition and the volume of reviews in each category. In the same ways
Figure-8 reports the distribution of positive reviews on most common parameters. Here, we eliminate
Turbulence as people are less talking about turbulence as shown in Figure-7. Figure-9(a-d) describes
the reviews of different airlines services on different parameters.
(8-a) (8-b)
Figure-8(a-b): Graph showing the distribution of positive reviews on four parameters for five
different airlines & 8-b showing its normalized view.
(a) (b)
6FSAET 2020 IOP Publishing
IOP Conf. Series: Materials Science and Engineering 1116 (2021) 012122 doi:10.1088/1757-899X/1116/1/012122
(c) (d)
Figure-9(a-d): Parameter wise comparison of airlines
3.2 . Analysis of tweets extracted from Twitter
3.2.1 Data extraction
Tweepy API is used to extract data from twitter with certain restrictions as it has a limit of ten days
only. Due to this restriction, we extract the data from twitter again and again in different periods of
time which contains number of tweets on a particular query. Numbers of tweets that we extracted from
twitter on particular airlines are shown in Table-1.
3.2.1.1 Data Preprocessing:
In sentiment analysis, Data Preprocessing is a very essential as it contains noisy, duplicate / repeated
tweets and some time uses short forms like „are you‟ as „r u‟ etc. Therefore preprocessing is essential
which contain following steps:
a. Convert all the tweets in the dataset into lower case.
b. Remove all the URL, username „@username‟ from the tweets.
c. Tweets also contains hash tags like „#airindia‟ and sometimes these # tags provide us some
significant information about the query, hence it is required to keep the hash tag words safe so
we replace those # tags words with words only and remove # tag symbol. E.g. #kakashi is
replaced by 'kakashi'.
d. Sometimes some unnecessary whitespaces and punctuations are also present at the starting and
ending of the text so we remove these whitespaces and punctuation from the starting and
ending of the texts. e.g: ' this car is bwaah! ' is replaced with 'this car is bwaah'.
e. Remove all repeated tweets.
f. Table-1 shows the results after preprocessing the tweets w.r.t. actual tweets
g. Stop words like „a‟, „is‟, „an‟ etc are completely removed from preprocessed tweets as it does
not change the emotions or feeling of tweets.
h. Also remove the punctuations such a comma, single/double quote, question marks at the
starting and ending of each word.
Table-1: Number of Tweets obtained after preprocessing
Airline Air India Jet Indigo Spice-Jet Go-Air
Airways
Number of Tweets
(After preprocessing 5020/14281 1579/2419 5224/7699 1132/2066 8348/11640
/ total Tweets)
7FSAET 2020 IOP Publishing
IOP Conf. Series: Materials Science and Engineering 1116 (2021) 012122 doi:10.1088/1757-899X/1116/1/012122
3.2.2 Data Analysis:
The preprocessed data is passed through Textblob (predefined library in python for processing textual
data) to predict the sentiments of tweets in following way:
a. Pass the tweets to a model which is defined inside the Textblob and predict the sentiment of
the tweet as positive, negative or neutral by assigning it a polarity between 1.0 to -1.0.
b. After calculating polarity, we assign a label to the tweet if polarity is greater than 0 then
„positive‟, if polarity is less than 0 then „negative‟ and if polarity is equal to 0 then „neutral‟.
c. Calculate total number of positive, negative and neutral tweets and plot the graph shown in
Figure-10. Figure-11 reports various parameters of five airlines.
Figure-10: Tweets classification
3.2.3 Analysis of different machine learning algorithms
The sufficient amount of data is collected, preprocessed and analyzed through various machine
learning algorithms. Tweets have been analyzed through Bernoulli Naïve Bayes, Multinomial Naïve
Bayes, Maximum Entropy and Support Vector Machines and it have been reported that SVM shows
better results in predictions on the test set. The Reviews from Trip Advisor also analyzed on the basis
of title and contents. It is observed that SVM reports 87.56% accuracy on the basis of contents while
Max-entropy reports highest result on the basis of title. Details results are shown in Table-2. Title
refers to the shortest possible description of the review. It has the advantage of faster classification of
data. Content refers to the detailed possible description of the review. It has the advantage of better
accuracy of classification of data
Table-2: Performance of different machine learning algorithms on Tweets and Reviews
ML Algorithms Tweets Reviews ( On Basis of Reviews ( On Basis
Content) of Title)
Bernoulli Naïve Bayes 68.11 69.41 69.41
Multinomial Naïve Bayes 72.44 74.53 74.53
Maximum Entropy 65.98 44.53 44.53
Support Vector Machines 84.51 87.56 87.56
8FSAET 2020 IOP Publishing
IOP Conf. Series: Materials Science and Engineering 1116 (2021) 012122 doi:10.1088/1757-899X/1116/1/012122
Figure-11: Comparison of airlines on various parameters
4. CONCLUSIONS
Sentimental Analysis is the modern, easier and most cost effective way to understand the need of the
mass population. It provides the way to read the feeling of general person on various subjects on the
basis of their comments, reviews etc on public platforms. Here, the objective of the proposed work is
to assess the services of most popular indian airlines like Spice-Jet, Go-Air , Air-India, Indigo and Jet
airways, through the reviews from Trip-advisor and tweets from Tweeter on various parameters like
food quality, staff, delay in time, turbulence, aircraft condition and value for money parameters.
Different Airlines services are showing better result as compare to other on different parameters. On
the basis of reviews, Jet-airways shows best option on the basis of Time Delay and overall customer
satisfaction. In terms of value for money Spice-jet is the first choice. Air India is best in its food / meal
quality. It is observed that observation on different parameters by reviews from trip advisor and tweets
are completely different as Jet-Airways is better in terms of Fare, Indigo is better in terms of meal etc.
Overall Jet-airways is seems better as compare to other existing airlines in India but unfortunately
9FSAET 2020 IOP Publishing
IOP Conf. Series: Materials Science and Engineering 1116 (2021) 012122 doi:10.1088/1757-899X/1116/1/012122
today, Jet-Airways completely shut down the airlines services in April-2019.
References
[1]. A. Pak and P. Paroubek. “Twitter as a Corpus for Sentiment Analysis and Opinion Mining”. In
Proceedings of the Seventh Conference on International Language Resources and Evaluation,
2010, pp.1320-1326
[2]. Agarwal, B. Xie, I. Vovsha, O. Rambow, R. Passonneau, “Sentiment Analysis of Twitter Data”, In
Proceedings of the ACL 2011Workshop on Languages in Social Media,2011 , pp. 30-38
[3]. R. Parikh and M. Movassate, “Sentiment Analysis of User- Generated Twitter Updates using
Various Classification Techniques”, CS224N Final Report, 2009.
[4]. Go, R. Bhayani, L.Huang. “Twitter Sentiment Classification Using Distant Supervision”. Stanford
University, Technical Paper,2009.
[5]. Bo Pang and Lillian Lee. 2008. Opinion mining and sentiment analysis. Found. Trends Inf. Retr.,
2(1-2):1–135.
[6]. Dodds, P. S., & Danforth, C. M. (2010). Measuring the happiness of large-scale written
expression: Songs, blogs, and Presidents. Journal of Happiness Studies, 11(4), 441–456.
[7]. Pang, B., Lee, L., & Vaithyanathan, S. (2002). Thumbs up: sentiment classification using
machine learning techniques. In Proceedings of the ACL-02 conference on Empirical methods in
natural language processing-Volume 10 (pp. 79-86). Association for Computational Linguistics.
[8]. Abhishek Bhola "Twitter and Polls: Analyzing and estimating political orientation of Twitter users
in India General Elections2014" arXiv:1406.5059 [cs.SI]
[9]. Min Song MeenChulKim ;Yoo Kyung Jeong, Analyzing the Political Landscape of 2012 Korean
Presidential Election in Twitter 1541-1672/14/ Published by the IEEE Computer Society.
[10]. Wan, X..“A Comparative Study of Cross-Lingual sentiment classification’’. In proceedings
of the 2012 IEEE/WIC/ACMInternational joint conferences on web intelligence and
IntelligentAgent technology-Volume 1 (pp. 24-31). IEEE computer society. 2012
[11]. Taboada, M., Brooke, J., Tofiloski, M., Voll, K., &Stede, M..“Lexicon basedmethods for
sentiment analysis”. Computational linguistics, 2011:37(2), 267-307.
[12]. V. M. K. Peddinti and P. Chintalapoodi, “Domain adaptation in sentiment analysis of
twitter,” in Analyzing Microtext Workshop, AAAI, 2011.
[13]. Shulong Tan, Yang Li, Huan Sun, Ziyu Guan, Xifeng Yan, Jiajun Bu, “Interpreting the
Public Sentiment Variations on Twitter”, IEEE TRANSACTIONS ON KNOWLEDGE AND
DATA ENGINEERING, VOL. 26, NO. 5, MAY 2014
[14]. Changbo Wang, Zhao Xiao, Yuhua Liu, Yanru Xu, Aoying Zhou, and Kang Zhang,
“SentiView: Sentiment Analysis and Visualization for Internet Popular Topics” IEEE
TRANSACTIONS ON HUMAN-MACHINE SYSTEMS, VOL. 43, NO. 6, NOVEMBER 2013.
[15]. Shai Shalev-Shwartz, Yoram Singer, Nathan, Srebro, Andrew Cotter “Pegasos: Primal
Estimated sub-GrAdient SOlver for SVM”, 2000.
[16]. Chuan-Ju Wangz, Ming-Feng Tsaiy, Tse Liuy, Chin-Ting Changzy, “Financial Sentiment
Analysis for Risk Prediction” Department of Computer Science & Program in Digital Content and
Technology National Chengchi University Taipei 116, 2013
[17]. A. Kumar and T. M. Sebastian, “Machine learning assisted Sentiment Analysis”.
Proceedings of International Conference on Computer Science & Engineering (ICCSE‟2012),
2012, pp. 123-130.
[18]. K. Dave, S. Lawrence, and D.M. Pennock. “Mining the peanut gallery: Opinion extraction
and semantic classification of product reviews”. In Proceedings of the 12th International
Conference on World Wide Web (WWW), 2003, pp. 519–528.
[19]. L. Barbosa, J. Feng. “Robust Sentiment Detection on Twitter from Biased and Noisy Data”.
COLING 2010:Poster Volume, pp. 36-44.
[20]. S. Batra and D. Rao, ”Entity Based Sentiment Analysis on Twitter”, Stanford University,
2010.
10You can also read