Interactive comment on "The Importance of Size Ranges in Aerosol Instrument Intercomparisons: A Case Study for the ATom Mission" by Hongyu Guo et al.
←
→
Page content transcription
If your browser does not render page correctly, please read the page content below
Atmos. Meas. Tech. Discuss.,
doi:10.5194/amt-2020-224-SC1, 2020                                                           AMTD
© Author(s) 2020. This work is distributed under
the Creative Commons Attribution 4.0 License.

                                                                                            Interactive
                                                                                             comment

Interactive comment on “The Importance of Size
Ranges in Aerosol Instrument Intercomparisons:
A Case Study for the ATom Mission” by
Hongyu Guo et al.
Daniel Murphy
daniel.m.murphy@noaa.gov

Received and published: 27 June 2020

Comment on Guo et al., The Importance of size ranges in aerosol instrument intercom-
parisons: A case study for the ATom Mission
D. M Murphy1, K. D. Froyd1,2, C. A. Brock1, C. Williamson1,2, and A. Kupc1,3
1Chemical Sciences Laboratory, National Oceanic and Atmospheric Administration          Printer-friendly version
2Cooperative Institute for Research in the Environmental Sciences, University of Col-
orado 3Faculty of Physics, Aerosol Physics and Environmental Physics, University of       Discussion paper
Vienna, Austria

                                                   C1
Introduction
AMTD
The authors of this comment are the principal investigators for the PALMS single par-
ticle mass spectrometer and the aerosol microphysical properties (AMP) size distribu-
tion instruments that were operated on the Atmospheric Tomography Mission (ATom).
Interactive
The PALMS authors are the developers of the instrument and associated data analysis
comment
methodologies, and have applied the instrument to study the atmospheric aerosol for
more than 2 decades.
We write out of concern that this manuscript (Guo et al., 2020; hereafter G20) has
serious flaws in the way it represents the PALMS instrument capabilities and the
PALMS+AMP data products submitted to the ATom database. Others who use data
from ATom and other missions could misunderstand how to utilize PALMS+AMP prod-
ucts in the mission archive. Moreover, G20 introduces into the literature a new “chemi-
cal information” metric that has unphysical behavior and lacks mathematical rigor.
This comment will show that that G20: - Analyzes the PALMS data with arbitrary size
bins that are too narrow. The combination of a very high size resolution and prescrib-
ing zero values to any bins without PALMS particle observations biases the results. -
Includes a conceptually flawed “chemical information” metric that leads incorrect con-
clusions. - Improperly compares instrument performance by using different metrics
for different instruments. - Is quantitatively incorrect in several ways: underestimating
by large factors the number of particles actually sampled by PALMS, and producing
concentrations that are biased low and scale unphysically with sampling time.
These issues were pointed out to the lead authors, who are PIs and scientists as-
sociated with the Aerodyne Aerosol Mass Spectrometer (AMS) instrument operated
on ATom before submission. There was extensive, but unresolved, discussion, that in- Printer-friendly version
cluded us suggesting alternative figures and text. We repeatedly stated that the method
of calculating PALMS statistics was not consistent with a detailed description of PALMS Discussion paper
data analysis methods (Froyd et al. 2019; hereafter F19) and therefore was likely to
C2be inaccurate, and that their “chemical information” metric was both conceptually and
quantitatively flawed. Because of the use of PALMS data, K. Froyd and D. Murphy were AMTD
originally invited to be coauthors on this manuscript but we were removed as authors
when agreement could not be reached. Following this, four other authors (comprising
the AMP team plus one other) removed themselves from authorship. Interactive
comment
The purpose of this comment is to describe these issues in detail as a matter of public
record, to help mitigate any misconceptions about the intrinsic merit and capabilities of
the PALMS instrument and associated data products, and to form recommendations for
the Editor to correct these problems before acceptance of G20 in Atmospheric Mea-
surement Techniques. While much of G20 represents solid research and a valuable
contribution to the literature, the sections relating to PALMS are flawed and need to
be removed or undergo major revision, as detailed at the end of this comment. The
PALMS-AMP data products are very complementary to AMS and SAGA. Each mea-
surement has its own strengths. We continue to be ready to assist the AMS team in
representing our data.
Background
PALMS by itself cannot derive absolute particle concentrations, as it samples particles
with uneven efficiency across its nominal size range of 0.1 to 4.8 µm. This uneven size
sampling underlies the methodology developed by F19 which derives absolute con-
centrations from PALMS by combining it with accurate counting and sizing instruments
(the AMP size spectrometers for ATom). Members of the AMS team are coauthors on
F19.
Arbitrary and narrow size bins
Printer-friendly version
G20 show results obtained by combining PALMS and AMP data (e.g., Fig 8, 9, S28,
S29, S30). However, they explicitly do not follow the data analysis procedures used
Discussion paper
by the PALMS+AMP team for data submitted to the mission archive. Instead, the
manuscript “provides an alternative illustration of PALMS size coverage” (line 339).
C3Instead of the 4 size bins used by the PALMS+AMP team to derive absolute concentra-
tions, G20 use 20 bins per decade of diameter, or 35 bins across the nominal PALMS AMTD
size range. The choice of bin width is critical because it significantly affects their anal-
ysis of data coverage and derived concentrations. The G20 choice has no physical
basis. Presumably, it arises because the AMP team uses 20 bins per decade as a Interactive
convenient bin size to report optical particle counter data in the data files, minimiz- comment
ing file size while providing adequate resolution for optical calculations. Note that 20
bins/decade is narrow: each bin is only a ∼12% change in diameter. When establish-
ing the methodology to derive concentrations from PALMS, F19 found that grouping
the size-resolved PALMS composition data into just four size bins was a good compro-
mise between adequate statistics and changes in particle composition with size. This
choice of bin width is extensively and quantitatively evaluated in F19, which states “It
is infeasible to retain the raw size resolution of the OPS [optical particle spectrometer,
AMP here] for the integrated concentration analysis”.
The G20 manuscript creates a data coverage metric called “chemical information con-
tent” or “chemical composition information”. The metric, used in G20 to derive Figs.
8, S29, and elsewhere, assigns an information content of 1 to size bins with particles
and 0 to size bins without particles. It is easy to see that this leads to lower values of
“chemical information” as the number of size bins is increased.
Imagine, for example, that an instrument has measured 50 particles. If there is no size
resolution (one bin), the “chemical information” is always 1. If there are three bins and
50 particles, statistically each bin will almost always contain a particle and the average
“chemical information” will be very close to one. But if there are 100 size bins (e.g. the
native resolution of the UHSAS optical spectrometer) and 50 particles, at least 50 bins
are necessarily empty and the average “information content” will be less than 0.5. With Printer-friendly version
1000 bins, in this example the “chemical information” metric that is supposed to quantify
Discussion paper
data coverage would be reduced tocoverage simply by choosing narrower bins must be mathematically invalid.
AMTD
Conceptual flaws in the "chemical information" metric
It is worth exploring some reasons why their metric of data coverage has an unphysical
dependence on the width of the size bins. Even if reasonable bin resolution were used Interactive
and the quantitative errors described below were corrected, the “chemical information” comment
analysis is still conceptually flawed as an indicator of data coverage.
The first reason the “chemical information” metric in G20 is flawed is that it penalizes
high-resolution data for empty bins but does not give credit for information obtained
from narrower bins. For example, having two size bins instead of one adds informa-
tion about possible differences in composition between small and large particles; G20
assign no value, either conceptually or mathematically, to this added information.
Second, the G20 analysis does not recognize autocorrelation. In reality, neighboring
bins are not independent of each other, either in concentration or chemistry. This is
particularly true at the high resolution used by G20. For example, if 200 nm particles
are composed of 80% sulfate, it is very unlikely that 225 nm particles are composed of
pure organics. If 200 nm particles truly had a completely different composition than 205
nm particles, and those again different than 210 nm particles, etc., PALMS would need
to sample an enormous number of particles to fully characterize the size-dependent
composition. If all the particles from 100 nm to 5 µm in a given air mass were exactly
the same, PALMS would only need to sample a few particles. Naturally, the amount of
data required is in between these extremes.
When analyzing PALMS data coverage, G20 do not consider that different size parti-
cles may have correlated compositions, yet that assumption is implicit in the interpre-
Printer-friendly version
tation of AMS and SAGA data. Without it one would have no idea, for example, if a
50:50 organic-sulfate mixture represented mixed particles, small pure organic particles
Discussion paper
and large pure sulfate particles, or vice versa. The AMS collection efficiency (bounce)
correction, which is based on bulk composition, also assumes similar particle compo-
C5sitions at different sizes. For example, if 150 nm particles were ammonium sulfate and
250 nm particles were sulfuric acid, the AMS bounce correction would be incorrect. AMTD
A rigorous analysis of information and data coverage is beyond the scope of this com-
ment but we can point out that that it should be framed in terms of detection limits. The
Interactive
G20 “chemical information” metric conflates information about the instrument with infor-
comment
mation about the atmosphere. In a typical 3-minute period in the stratosphere PALMS
measures no 30 nm particles and no 3 µm particles. G20 assign the same zero value
to these, yet they are very different. The former is a statement about PALMS because
30 nm is far below PALMS’ nominal size range, whereas the latter is a statement about
low concentrations in the stratosphere. In G20 this is evident in Fig. 8 for exam-
ple, where zero “information content” is assigned at high altitudes to large sizes that
PALMS samples well (because the atmosphere there contained almost no large par-
ticles). This illustrates why the scientific literature conventionally discusses detection
limits for in-situ instruments rather than “chemical information”. When one compares
an instrument detection limit with an atmospheric concentration it properly separates
instrument performance from atmospheric properties. There are mathematically rigor-
ous ways of defining information content for aerosol size distributions (Preining, 1972)
in the context of a priori information (Petty, 2018), yet an arbitrary metric is developed
in G20 instead.
Flawed instrument comparisons
The G20 manuscript applies different metrics to different instruments, leading to biased
comparisons. In particular, G20 Fig. 8, the primary comparison of instrument measure-
ment capabilities, is not internally consistent. The “chemical information” metric is ap-
plied only to PALMS, not the other instruments. PALMS data coverage is derived using Printer-friendly version
a limited (3 minute) sample time. Imposing this sample time restriction only on PALMS
misrepresents its size range and data coverage relative to the other instruments. Were Discussion paper
a similar information content or sample time restriction imposed on AMS and SAGA, a
high fraction of samples would be below detection limit. At the native sampling times
C6for AMS or SAGA (1 min and ∼5-15 min, respectively), 72% of AMS and 35% of SAGA
samples are below their detection limits for a major chemical component (sulfate, am- AMTD
monium, nitrate, or organic material). Such samples have little “chemical information”
across all sizes beyond being able to say “below detection limit”, yet that is ignored in
G20 Fig 8, where instead AMS and SAGA are shown to detect 100% of particles within Interactive
their nominal size ranges. On the same 3 minute sample time as PALMS, over 60% of comment
AMS organic data in the tropical Pacific are below detection limit, yet G20 assert that
those data have more “chemical information” than PALMS data above detection limit.
Quantitative errors: scaling and number of particles.
A quantitative error in G20 is that their derived PALMS+AMP concentrations in Fig.
8 and elsewhere scale improperly with sampling time. This is illustrated in Fig.
S29, where increasing the PALMS sampling time from 3 to 60 min increases the
PALMS+AMP number and volume. Although PALMS observes more particles with
longer sample time, higher particle counts do not translate into higher derived concen-
trations. The G20 method to derive PALMS+AMP concentrations is therefore flawed:
physical concentrations do not scale with sample time. The method of F19 does not
have this problem.
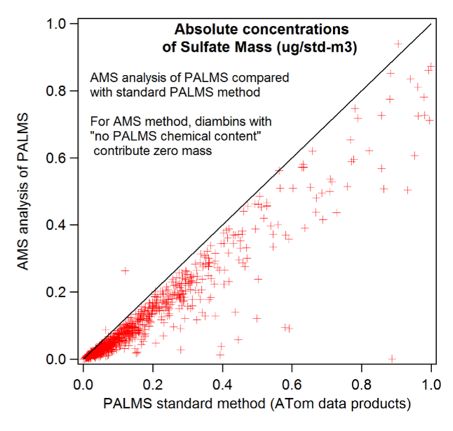
Figure 1 below shows that it is essential to use information across wider bins than
20/decade to obtain accurate concentration measurements with PALMS+AMP. If one
simply puts zeros in empty bins, as in G20 Fig. 8, the resulting concentrations have
large discrepancies and are biased low.
The G20 manuscript also strongly underestimates the number of particles sampled by
PALMS. Fig. S14 in G20 is the basis for the derived PALMS+AMP concentrations in
Fig 8 and elsewhere. Although their estimated sampling rate near the peak sampling Printer-friendly version
efficiency at around 300 nm appears reasonable, their estimates have large errors for
smaller and larger particle sizes, exactly those most important for data coverage (Fig- Discussion paper
ure 2). For instance, for the narrow bin at 1005-1128 nm G20 calculate that PALMS
C7observed ∼500 particles over an ATom deployment, whereas PALMS actually observed
over 14000. Considering the 5 bins/decade curve on G20 Fig. S14, they underesti- AMTD
mate the average sampling rate for the bin centered near 130 nm by a factor of about
10 and underestimate the PALMS sampling rate above 1 µm by factors of 8 to 40.
Similar errors apply to all other curves in S14. These errors presumably propagate Interactive
into all calculations in the manuscript (Fig 8, 9, S15, S28, S29, S30, and Table S2). comment
Underestimating the number of particles sampled by PALMS by x10 and higher factors
will seriously affect the conclusions of the manuscript.
Specifically, G20 state (line 345) “The probability of detecting on average one valid
particle per AMP size bin in the PALMS is very low below ∼160 nm and above 1000
nm over a typical 3 min analysis period.” In contrast, on average PALMS actually mea-
sured in 3 minutes the composition of about 4 particles smaller than 160 nm and about
10 particles larger than 1 µm. G20 (lines 336 and 694) also refer to PALMS+AMP
products for small and large particles as “extrapolations”. In reality, during the ATom
deployments PALMS measured over 100,000 particles between 100 and 180 nm di-
ameter and almost 100,000 between 1 and 4 µm.
We provided the AMS team with unpublished data on the PALMS sampling rate (the
red curve on their Fig. S13), and allowed them to use these data even after we were
removed as coauthors. We have been unable to replicate exactly how they arrived
at their underestimates of PALMS sampling rates. The manuscript states (Fig. S14
caption) that they used a detection efficiency and multiplied it by a flow rate and atmo-
spheric concentrations. However, according to F19, using a detection efficiency curve
for PALMS is “not recommended due to many possible pitfalls and large, unquantifiable
errors.”
Printer-friendly version
Summary
The incorrect calculation of the number of particles sampled by PALMS and the use Discussion paper
of arbitrarily narrow bin widths together lead to low assessments of the PALMS data
C8coverage. G20 assert (line 691, also Table S2 and Figs 8 and 9) that the PALM+AMP
data characterize about 54% of the aerosol volume within 3 minutes of sample time AMTD
during the ATom flights. Figure 3 shows cumulative size distributions for the ATom
flights. One can see that a 54% fraction of the volume within the nominal PALMS size
range is implausibly low. Interactive
comment
The analysis of the PALMS+AMP data in G20 has both quantitative and conceptual
errors. Even if the quantitative errors were fixed, the “chemical information” metric of
data coverage would still be conceptually flawed. G20 Figs. 8 and 9 and the stated
size-dependent numbers of PALMS-sampled particles are incorrect by large margins,
as is the 54% PALMS volume coverage figure. Finally, instruments are not compared
using the same criteria: only the PALMS data are scaled by “chemical information”
using a limited sample time, and an implicit assumption that particle composition is
uncorrelated across nearby diameters is applied only to PALMS.
The manuscript is not suitable for publication unless the incorrect calculations, the
“chemical information” analysis, and all associated discussion are removed. Specif-
ically, in G20, Figs. 8, 9, S14, S15, S28, S29, and S30 show incorrect information
about PALMS. The associated discussion starting on line 331 is incorrect, as are the
data coverage percentages following line 689, line 744, and in Table S2. The red curve
on Fig. S13 is correct but mislabeled.
Instead of the existing panels showing PALMS+AMP data coverage in Fig. 8, we would
support a figure similar to the bottom panel of G20 Fig. S29 or S30. These do a good
job of illustrating the coverage of the PALMS data and how PALMS samples within the
four broad size bins established in F19.
References Printer-friendly version
Froyd, Karl D., Daniel M. Murphy, Charles A. Brock, Pedro Campuzano-Jost, Jack
Discussion paper
E. Dibb, Jose-Luis Jimenez, Agnieszka Kupc, Ann M. Middlebrook, Gregory P. Schill,
Kenneth L. Thornhill, Christina J. Williamson, James C. Wilson, and Luke D. Ziemba,
C9A new method to quantify mineral dust and other aerosol species from aircraft plat-
forms using single-particle mass spectrometry, Atmos. Meas. Technol., 12, 6209-8239, AMTD
https://doi.org/10.5194/amt-12-6209-2019, 2019.
Guo, H., P. Campuzano-Jost, B. A. Nault, D. A. Day, J. C. Schroder, J. E. Dibb, M.
Interactive
Dollner, B. Weinzierl, and J. L. Jimenez, The importance of size ranges in aerosol
comment
instrument intercomparisons: A case study for the ATom mission, Atmos. Meas. Tech.
Disc., submitted manuscript, 2020.
Petty, G. W., On some shortcomings of Shannon entropy as a measure of information
content in indirect measurements of continuous variables, J. Atmos. Oceanic Technol.,
35, 1011-1021, https://doi.org/10.1175/JTECH-D-17-0056.1, 2018.
Preining, O., Information theory applied to the acquisition of size distributions, J.
Aerosol Sci. 3, 289-296, https://doi.org/10.1016/0021-8502(72)90050-X, 1972.
Figure 1. PALMS+AMP sulfate mass concentrations if one inserts zero values in bins
without particles (20 bins/decade) in a 3-minute period, compared to the PALMS stan-
dard method used for data in the ATom mission archive (x axis).
Figure 2. A comparison of the G20 calculation of the number of particles ostensibly
sampled by PALMS with the number actually sampled. The red dashed curve is from
Fig. S14 in G20. The black curve is the average number actually sampled out of cloud
expressed as particles per 3 minutes. This shows 5 bins/decade; other bin sizes have
similar discrepancies. Thin dashed lines are individual deployments. (Slight changes in
vacuum inlet alignment favored large particles during ATom 2 and 3 and small particles
during ATom 1 and 4.)
Figure 3. Cumulative size distributions expressed as the fraction of aerosol volume Printer-friendly version
below 3 µm optical diameter. Solid lines are data taken below 2 km altitude and dashed
lines above 2 km. Horizontal grey bars show approximate size ranges for AMS and Discussion paper
PALMS+AMP data. These are averages of all ATom data out of cloud and west of 60◦
C10W longitude. The last criterion is just a simple way to exclude strong biomass and dust
plumes near Africa. AMTD
Interactive comment on Atmos. Meas. Tech. Discuss., doi:10.5194/amt-2020-224, 2020.
Interactive
comment
Printer-friendly version
Discussion paper
C11AMTD
Interactive
comment
Printer-friendly version
Discussion paper
Fig. 1.
C12AMTD
100
Number of PALMS particles in 3 minutes with 5 bins/decade
Interactive
comment
10
1
Guo et al. Figure S14
Actual PALMS average
Thin lines: ATom1 to 4
0.1
0.01
2 3 4 5 6 7 8 9 2 3 4
0.1 1
Optical diameter (µm) Printer-friendly version
Discussion paper
Fig. 2.
C13-3
AMTD
Vacuum aero. diameter at 1.7 g cm (µm)
0.1 1
6 7 8 9 2 3 4 5 6 7 8 9 2 3 4 5
Interactive
1.0 comment
AMS
Fraction of dry aerosol volume below 3 µm
Solid: below 2 km
Dashed: above 2 km
0.8 ATom1
ATom2
ATom3
ATom4
0.6 west of 60°
out of cloud
0.4
0.2
PALMS-AMP
0.0
4 5 6 7 8 9 2 3 4 5 6 7 8 9 2 3
Printer-friendly version
0.1 1
Optical diameter (µm)
Discussion paper
Fig. 3.
C14You can also read