A 2D laser rangefinder scans dataset of standard EUR pallets
←
→
Page content transcription
If your browser does not render page correctly, please read the page content below
A 2D laser rangefinder scans dataset of standard EUR pallets
                                               Ihab S. Mohameda,∗, Alessio Capitanellib , Fulvio Mastrogiovannib , Stefano Rovettab ,
                                                                               Renato Zaccariab
                                                            a
                                                              INRIA Sophia Antipolis - Méditerranée, Université Côte d’Azur, France
                                          b
                                              Department of Informatics, Bioengineering, Robotics and Systems Engineering (DIBRIS), University of
                                                                                          Genoa, Italy
arXiv:1805.08564v2 [cs.RO] 13 Mar 2019

                                         Abstract
                                         In the past few years, the technology of automated guided vehicles (AGVs) has notably
                                         advanced. In particular, in the context of factory and warehouse automation, different
                                         approaches have been presented for detecting and localizing pallets inside warehouses and
                                         shop-floor environments. In a related research paper [1], we show that an AGVs can detect,
                                         localize, and track pallets using machine learning techniques based only on the data of an
                                         on-board 2D laser rangefinder. Such sensor is very common in industrial scenarios due to its
                                         simplicity and robustness, but it can only provide a limited amount of data. Therefore, it
                                         has been neglected in the past in favor of more complex solutions. In this paper, we release
                                         to the community the data we collected in [1] for further research activities in the field of
                                         pallet localization and tracking. The dataset comprises a collection of 565 2D scans from
                                         real-world environments, which are divided into 340 samples where pallets are present, and
                                         225 samples where they are not. The data have been manually labelled and are provided in
                                         different formats.
                                         Keywords: 2D Laser Rangefinder, Object Detection, Robotics, Automated Guided Vehicle

                                              ∗
                                             Corresponding author.
                                             Email addresses: ihab.mohamed@inria.fr (Ihab S. Mohamed),
                                         alessio.capitanelli@dibris.unige.it (Alessio Capitanelli), fulvio.mastrogiovanni@unige.it
                                         (Fulvio Mastrogiovanni), stefano.rovetta@unige.it (Stefano Rovetta), renato.zaccaria@unige.it
                                         (Renato Zaccaria)

                                                                                                                                   March 15, 2019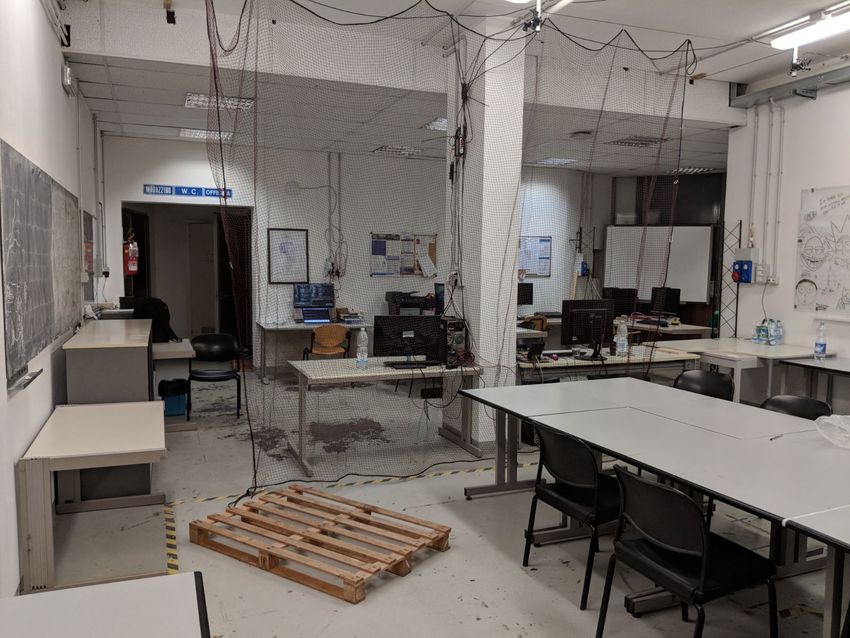
Specifications Table

 Subject area                 Engineering
 More specific subject area   Robotics, Object Detection, Automated Guided Vehicle
 Type of data                 Raw depth data provided by the 2D range sensor
                              Processed 2D bitmap-like image representation of raw data
 How data was acquired        2D laser rangefinder (SICK S3000 Pro CMS)
 Data format                  Files in text format .txt
                              2D images in .jpg & .png (681 × 533 & 250 × 250 pixels)
                              MAT-files in MATLAB format .mat
 Experimental factors         2D depth data processed offline and converted into 2D images.
                              Images have been manually tagged whether they include a pallet
                              or not, and eventually paired with the respective region of interest.
 Experimental features        Raw data have been acquired by moving a 2D laser scanner
                              in a realistic reproduction of a factory workshop, featuring
                              pallets, people, robots and other equipment.
 Data source location         EMARO Lab, Department of Informatics, Bioengineering, Robotics
                              and Systems Engineering, University of Genoa, Genoa, Italy
                              (44.402241, 8.960811)
 Data accessibility           Dataset and codes are archived in a GitHub repository at:
                              https://github.com/EmaroLab/PDT
 Related research article     "Detection, localisation and tracking of pallets using
                              learning techniques and 2D range data" [1]

Value of the Data
   • The 2D Laser Rangefinder dataset allows to develop novel techiques for pallet detec-
     tion, localization and tracking.

   • The 2D Laser Rangefinder dataset can be used as banchmark to compare the accuracy
     of different pallet detection, localization and tracking algorithms.

   • The 2D Laser Rangefinder dataset allows to improve Automated Guidance Vehicles in
     industrial workshop environments.

   • The 2D Laser Rangefinder dataset can be used to simulate the 2D range sensor data
     of a mobile robot moving in an industrial workshop environment.

   • To our knowledge, this is the first dataset for pallet localization and tracking using
     only 2D Laser Rangefinder data, as opposed to previous datasets aimed at generic
     AGV and/or more complex sensors [2–5].

                                                                               March 15, 2019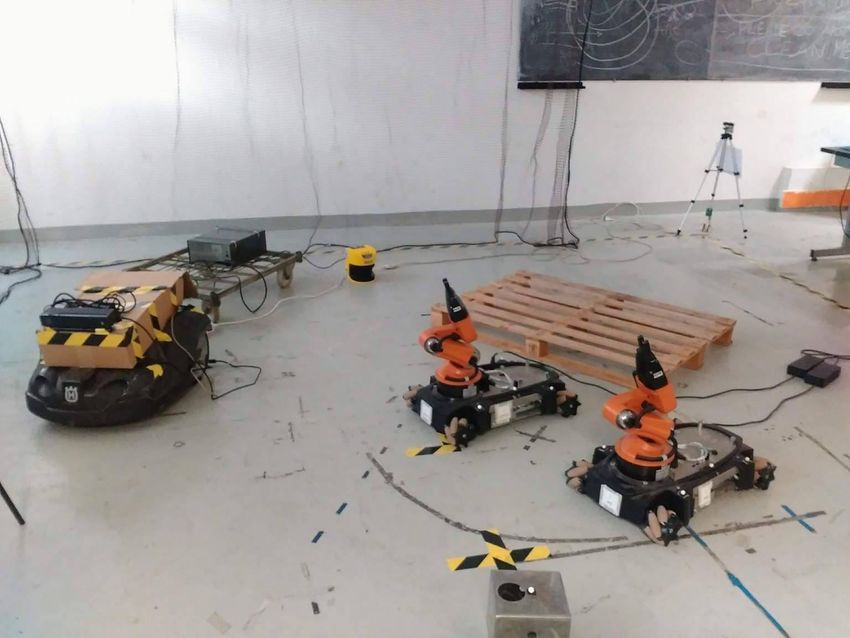
1. Data
    In this article, we present a dataset of 2D range data obtained from a laser scanner
moving inside an industrial workshop environment, where EUR standard pallets (see Fig.
3(a)), people, robots and other equipment are present. Each frame of the sensor trajectory
corresponds to: (i) a 2D range scan (see Table 1) obtained from a SICK S3000 Pro CMS
laser rangefinder (see Fig. 3(b)); (ii) a 2D image obtained by processing the 2D range scan
(see Fig. 4); (iii) a tag attached by a human, indicating whether the scan includes a pallet
or not; and (iv), the region of interest of the pallet in the image (if any), also defined by a
human.
    The laser rangefinder has a resolution of 0.25 deg and a maximum field of view of 190 deg,
leading to scans made of 761 ranges. It operates at 16 Hz frequency, and the scans are
averaged every 4 frames during the static data acquisition phase in order to reduce noise.
There are a total of 565 scans, 340 of which contains a pallet, while the remaining 225
do not. The corresponding 2D images are obtained by converting the range data from
polar to cartesian coordinates and resizing them to 250 × 250 px. Also, images containing a
pallet come with a pallet Region Of Interest (ROI), defined by its upper-left and lower-right
vertices. Finally, an additional set of 4 continuous trajectories’ raw range data is also made
available, to allow online testing.

2. Experimental design, materials, and methods
2.1. Equipment and Software
     In our experiment, the data have been acquired using a commercial 2D laser rangefinder
from SICK, in particular the model S3000 Pro CMS1 pictured in Fig. 3(b). The sensor has
a maximum range of 49 m (20 m at 20% reflectivity), a resolution of 0.25 deg, a 16 Hz refresh
frequency, and an empirical error of 30 mm. The maximum field of view of the rangefinder
is 190 deg, which is sufficient for the detection of objects in front of an eventual AGV. The
sensor generates an array of 761 distances in polar coordinates, i.e., each value in the array
correspond to the distance to the closest object for every angle in 0.25 deg increments.
     The choice of this sensor was due to its widespread adoption in industrial mobile robotics,
where it is mostly employed for safety applications and is appreciated for its robustness and
precision. It belongs to the class of sensors based on the Time-of-Flight (TOF) principle,
i.e., sensors which measure the delay between the emission of a signal and the moment it
hits back a receiver in order to estimate the distance to a surface. This category of systems
involves sensing devices such as Laser Measurement Systems (LMS) or LIDARs, radars, TOF
cameras, and sonar sensors, and they emit either light or sound waves in the environment.
Knowing the speed with which the signal propagates and using precise circuitry to measure
the exact TOF, the distance can be estimated with high precision.

  1
   https://www.sick.com/ag/en/s3000-professional-cms-sensor-head-with-io-module/s30a-6011db/p/
p31284

                                                                                   March 15, 2019
The laser rangefinder is then connected to a PC through a RS422-USB converter, which
has a transmission rate of 500 kBaud. The PC used to acquire the data is equipped with an
Intel® Core i5-4210U 1.70 GHz CPU and 6 GB of RAM, and runs Ubuntu 16.04 64 bit.
On the software side, real-world data is acquired online using an ad hoc software2 running
in the Robot Operating System framework3 (ROS). Offline processing (i.e., conversion to
2D images and manual definition of the regions of interest) has been perfomed in MATLAB.
The scripts employed to that purpose and the resulting .mat files are also provided as part
of this dataset.
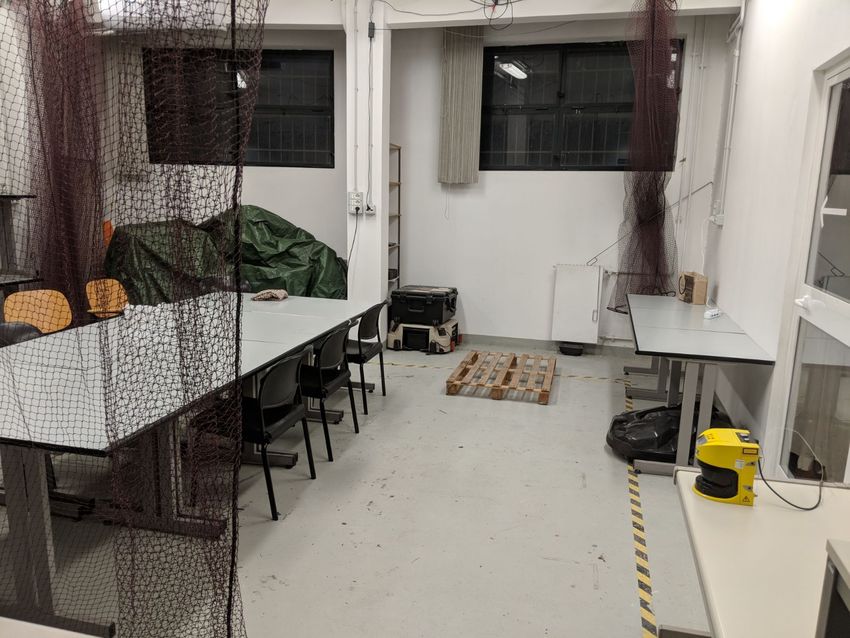
2.2. Environment
We performed our experiments for data acquisition in the indoor environment represented
in Figs. 1-2, with the sensor moving in the 40 m2 area highlighted in Fig. 1. Such envi-
ronmennt has been fitted to reproduce a typycal industrial workshop, featuring industrial
pallets, furniture, robots and equipment (e.g., a conveyor belt). People were also included
in the scene and allowed to move during data acquisition, which lead to temporary occlu-
sions of the objects in the environment. Between acquisition sessions, the position of several
objects was modified to better simulate a dynamic environment. The 2D laser rangefinder
was positioned close to the floor, in a way that was both realistic with real world mounting
position and able to perceive a pallet laying directly on the ground.
Concerning the type of pallet, we focused on the EUR-pallet standard depicted in
Fig.3(a), which is the European pallet format specified by the European Pallet Association
(EPAL)4 . The size of EUR-pallets is 1200 mm×800 mm with a height of 144 mm. Moreover,
we defined as operating face of the pallet the one of narrower width. On that face there are
two slots, each 227.5 mm wide.
2.3. Experiments
In our experiments, the sensor was moved around the environment. Sensor frames differ
from each other by the position and orientation of the pallet with respect of the sensor, but
also due to the dynamic nature of the environment, as described in the previous section. In
particular, it is possible that the pallet is heavily occluded and only few points belonging to
it are visible in the frame.
The acquired raw range data Ri at any time instant i represent the array of measured
distances from the rangefinder to surrounding objects in the environment in the direction
given by the angle φj . More formally:
Ri = {r0 , . . . , rj , . . . , rM }, (1)
where M is the maximum number of range points acquired per frame, which is related to
the sensor’s field of view and angular resolution. In our case, M = 761, as the two values
2
https://github.com/RobotnikAutomation/s3000_laser
3
http://www.ros.org/about-ros/
4
https://en.wikipedia.org/wiki/EUR-pallet
March 15, 2019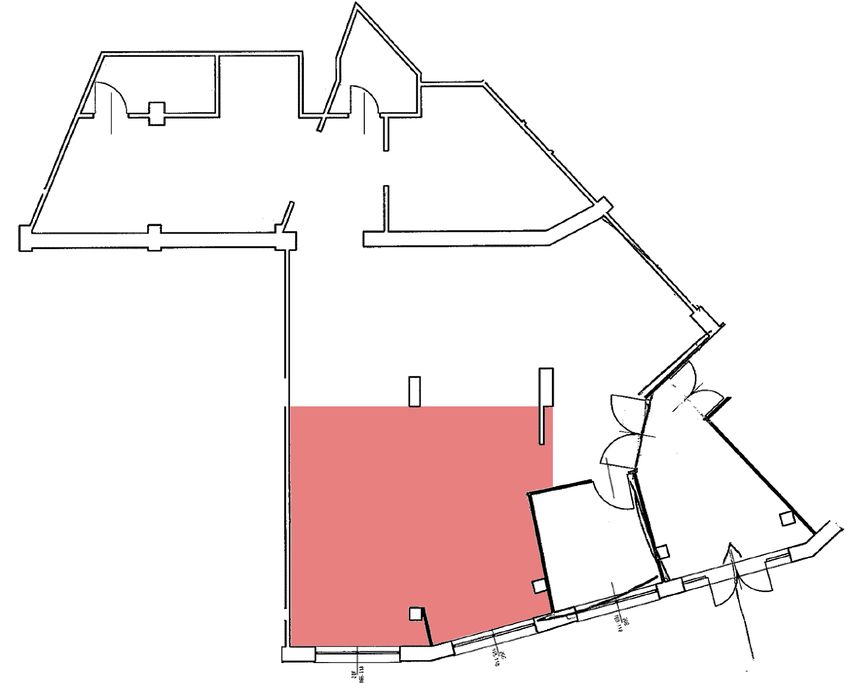
Figure 1: A planimetry of the indoor environment where the experiment took place. The 2D laser rangefinder
has been moved along several trajectories inside the read area, measuring 40 m2 . The rest of the environ-
mentis is still visible in several frames. In the whole environments several pieces of furniture and equipment,
pallets, robots as well as people were present.

are 190 deg and 0.25 deg respectively. Keep in mind that the sensor employed runs at 16 Hz,
which would rapidly lead to a unmanageable amount of data, especially considering the
manual labelling steps ahead. For this reason, we decided to effectively reduce the operating
frequency to 4 Hz in the static data acquisition phase, thus every Ri is actually the result of
the average of 4 raw consecutive frames from the sensor. This also helps reducing noise on
the data. An example of such process as well and the structure of the raw range data are
reported in Table 1.
    In our experiments, we are focusing on the detection of pallets in the environment,
hence, the set R of all raw range data readings Ri , consisting of 565 2D range scans, has
been manually divided into two classes:
   1. Pallet class represents the case of having a pallet located somewhere in the environment
      with a free operating face, i.e., it can be eventually be picked up by an AGV as an
      autonomous forklift. It consists of 340 samples.
   2. NoPallet class represents the case in which no pallet is present in the environment, or
      there is, but the operating face is too cluttered to allow an AGV such as an autonomous
      forklift to pick up the pallet. It consists of 225 samples.
This manual labeling step has been performed with the help of an online ROS visualization
tool, RViz 5 . An operator checked the screen of the PC while the sensor was being moved,
marking frames where a pallet with a free operating face was present in the sensor’s FOV.
   5
       http://wiki.ros.org/rviz
                                                                                              March 15, 2019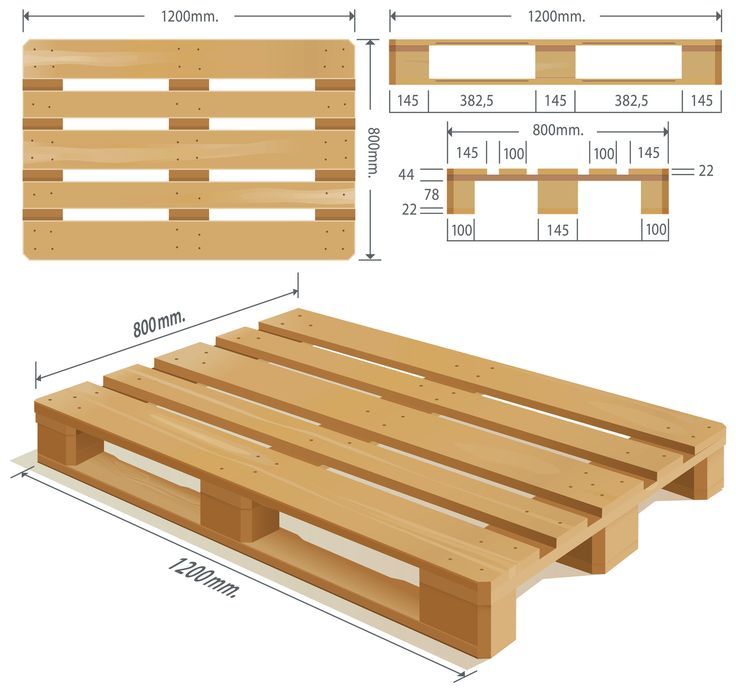
Figure 2: Snaphots of the test environment in different configurations. In the images a number of other
objects appear beyond pallets, such as other robots, equipment and furniture.

   Afterwards, any range data frame Ri can also be represented as a set Si of polar coordi-
nates, and consequently converted to Cartesian coordinates using (2) and (3).

                          si = {(r0 , φ0 ), . . . , (rj , φj ), . . . , (rM −1 , φM −1 )}.             (2)

                                               xj = rj cos(φj ),
                                                                                                       (3)
                                               yj = rj sin(φj ).
This results in a binary 2D image of the operating area’s floor plan, which is then resized to
250 × 250 px. An example of the resulting images is given in Fig. 4.
    Of course, these images are labeled with the same class as the originating frame. In
partcular, images belonging to the Pallet class come with the respective pallet ROI expressed
as its upper-left and lower-right vertices (i.e., (xmin , ymin ) and (xmax , ymax )), as well as a
companion 250 × 250 px image containing the pallet only. Such ROIs are the results of the
Region Proposal Network we employed in the related research paper [1]. The resulting ROIs
have been manually labelled to indicate whether they present a pallet or another object. A
selection of ROIs not including a pallet is also included in the dataset repository.
                                                                                             March 15, 2019
EUR-pallet S3000 Professional CMS
Figure 3: The equipment that has been used to acquire the raw 2D range data: on the left hand side, the
geometric characteristics of standard European pallet are shown, whilst on the right hand side the S3000
Professional laser scanner (Type: S30A-6011DB) is represented.
We will not further delve here into the details of our specific solution to the problem of
pallet localization and tracking, which we present instead in the related research paper [1].
We just point out that the data was indeed employed for pallet localization and tracking and
that the proposed architecture was tested using 4 additional continous trajectories, which
are also made available on the dataset repository. In particular, localization was performed
using the aforementioned Region Proposal Network, cascaded with a Faster Recurrent Con-
volutional Neural Network classifier that took as input the set of manually labelled ROIs
[6]. On the other hand, tracking was performed using a Kalman Filter [7]. The filter was
also used to implement a Sequantial Classification procedure, i.e., accepting a ROI as an
actual pallet was deferred till it was detected and tracked for a predefined amount of time,
eventually reaching a sufficient confidence threshold.
Finally, note that the dataset can be used for multi-pallet detection, but that was not
part of our data collection experiment. Indeed, in the related research paper [1] we ran a
preliminary study on the subject by generating artificial data. We want to stress that given
that the EUR-Pallet is an official standard with strict tolerances, differences between any
two pallets are not perceivable by the the sensor, due to its characteristics and margin of
error. This leads to two major consequences:
• It is not possible with this sensor and with the dataset we provide to univocally identify
a pallet, yet it is possible to distinguish them from each other if appropriate tracking
techniques are put in place, like we did in the related research paper [1].
March 15, 2019• Artificial 2D images including two or more pallets in every image are easy to generate.
This can be achieved by taking an original image and adding the pallet ROI from
another image, possibly changing position, orientation, and/or adding noise, and con-
sequently deleting any reading in the original image that would now be occluded by
the new pallet. Such artificial images are not provided here, but can easily be gener-
ated with the provided materials and tools. Nevertheless, future work on our related
research paper will include real world multi-pallet testing, thus an extended dataset
will be made available too.
Index Range data Ri
Frame #1 (i = 1) Index Range data Ri
0 3.11 0 3.12
1 3.11 Frame #2 (i = 2) 1 3.11
2 3.00 2 3.06
.. .. 0 3.11 Taking average .. ..
. . 1 3.11 Frame #3 (i = 3) =========⇒ . .
over 4 frames
100 2.26 2 3.11 100 2.252
.. .. 0 3.13 101 2.28
101 2.28
.. .. . . 1 3.11 Frame #4 (i = 4) .. ..
. . 100 2.26 2 3.13 . .
1r 0 3.13 1 r +···+4 r
j j
j j 101 2.28 .
.. .. j 4
.. .. .. .. . 1 3.11 .. ..
. . . . 100 2.26 2 3.00 . .
757 1.51 j 2r
j 101 2.28 .
.. .. 757 1.50
. . .
758 4.05 .. .. .
.. .
.. 758 4.07
100 2.23
759 4.08 3r 759 4.075
757 1.51 j j 101 2.28
760 4.08 . .. .. .. 760 4.07
758 4.08 ..
END of Frame #1 . . .
759 4.06 4
757 1.51 j rj
760 4.08 .. ..
758 4.08 . .
END of Frame #2
759 4.08 757 1.48
760 4.05 758 4.08
END of Frame #3
759 4.08
760 4.08
END of Frame #4
Table 1: An example of the raw range data provided by the laser rangefinder. As soon as the data is
visualized using the standard ROS package rviz, four sequential frames are stored in a text file. Then, the
average can be calculated in order to perform the detection and tracking of the pallet using machine learning
techniques.
2.4. Dataset inspection
The dateset is completely contained in the AllData folder of the provided git repository.
The folder is structured as follows:
March 15, 2019Pallet
NoPallet
Figure 4: The dataset of real-world 2D scans represented in Cartesian coordinates: the first two rows are
related to the case where a pallet is present in the environment and the operating face is free, whilst the last
two rows represent samples of the dataset when no pallet is present or the operating face is not accessible
by an autonomous forklift. The red box in the first image represent an example of region of interest, i.e.,
the part of the image actually where the pallet is located.
March 15, 2019• The Class1 and Class2 folders correspond to Pallet and NoPallet classes, respectively.
They include 565 raw laser rangefinder scans in .txt format in total, 340 for the former
class and 225 for the latter.
• DataSet565.mat is a file containing the whole dataset as a 761 × 565 MATLAB matrix.
• PalletImages folder containing all the 250 × 250 px images in various formats, divided
by class and eventually accompained by the relative pallet’s ROI. In particular, the
files PalletGrayImages.zip and RGBImages.tar.gz contains the images in .jpg and .png
format, respectively.
• TrajectoryDataset folder contains 4 additional continous trajectories that we used to
test the architecture presented in our related research paper [1]. The trajectories are
provided in .mat format.
Acknowledgements
The work by I. S. Mohamed was supported by a scholarship from the ERASMUS+
European Master on Advanced Robotics Plus (EMARO+) programme. The authors would
like to thank M.Eng. Yusha Kareem for his helping in data collection process.
Conflict of interest
The authors declare that they have no conflict of interest relevant to this article.
Transparency document. Supplementary material
Transparency data associated with this article can be found in the online version at
https://github.com/EmaroLab/PDT.
References
References
[1] I. S. Mohamed, A. Capitanelli, F. Mastrogiovanni, S. Rovetta, R. Zaccaria, Detection, localisation and
tracking of pallets using machine learning techniques and 2D range data, arXiv preprint arXiv:1803.11254
(2018).
[2] A. Geiger, P. Lenz, C. Stiller, R. Urtasun, Vision meets robotics: The KITTI dataset, The International
Journal of Robotics Research 32 (11) (2013) 1231–1237.
[3] W. Maddern, G. Pascoe, C. Linegar, P. Newman, 1 year, 1000 km: The Oxford RobotCar dataset, The
International Journal of Robotics Research 36 (1) (2017) 3–15.
[4] J. Jeong, Y. Cho, Y.-S. Shin, H. Roh, A. Kim, Complex urban lidar data set, in: 2018 IEEE International
Conference on Robotics and Automation (ICRA), IEEE, 2018, pp. 6344–6351.
[5] C. Rennie, R. Shome, K. E. Bekris, A. F. De Souza, A dataset for improved rgbd-based object detection
and pose estimation for warehouse pick-and-place, IEEE Robotics and Automation Letters 1 (2) (2016)
1179–1185.
March 15, 2019[6] S. Ren, K. He, R. Girshick, J. Sun, Faster R-CNN: Towards real-time object detection with region
proposal networks, in: Advances in neural information processing systems, 2015, pp. 91–99.
[7] E. V. Cuevas, D. Zaldivar, R. Rojas, Kalman filter for vision tracking, Technical Report, Freie Universität
Berlin, Inst. Informatik, Berlin, Germany.
March 15, 2019You can also read