Avalanche - Cloud Analytics Performance Report Actian Avalanche: Up to 20X faster and 1/3rd the cost
←
→
Page content transcription
If your browser does not render page correctly, please read the page content below

Cloud Analytics
Performance Report

  Actian Avalanche: Up to
20X faster and 1/3rd the cost
   of Amazon Redshift
   MCG Global Services Benchmark Results

              March 2019

          Avalanche
          Cloud Data Warehouse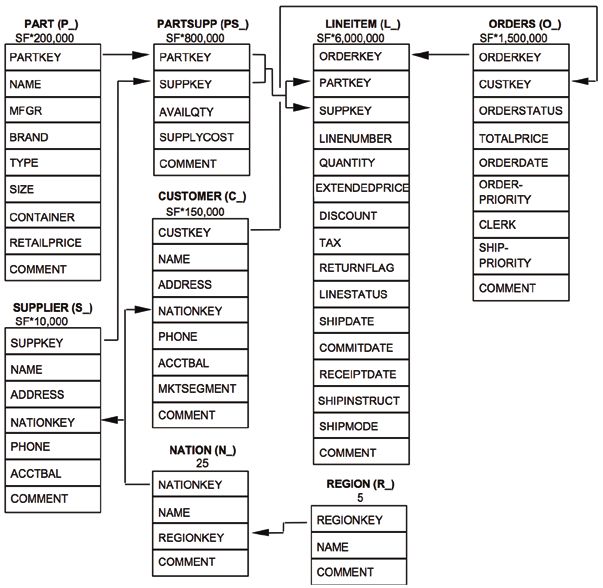
Cloud Analytical Database Performance Testing
Product Evaluation:
Actian Avalanche and Amazon Redshift

March 2019

Sponsored by
Cloud Analytical Database Performance Testing

Introduction
Performance is important but is only one criterion for an analytical platform selection. This is only one
point-in-time check into specific performance. There are numerous other factors to consider in
selection across factors of administration, integration, workload management, user interface,
scalability, reliability, and numerous other criteria. It is also our experience that performance changes
over time and is competitively different for different workloads. Also a performance leader can hit up
against the point of diminishing returns and viable contenders can quickly close the gap.

MCG Global Services runs all of its performance tests to strict ethical standards. The results of the
report are the objective results of the application of queries to the simulations described in the
report. The report clearly defines the selected criteria and process used to establish the field test. The
report also clearly states the data set sizes, the platforms, the queries, etc. used. The reader is left to
determine for themselves how to qualify the information for their individual needs. The report does
not make any claim regarding third-party certification and presents the objective results received
from the application of the process to the criteria as described in the report. The report strictly
measures performance and does not purport to evaluate other factors that potential customers may
find relevant when making a purchase decision.

This is a sponsored report. Actian chose the competitors, the test, and the Actian configuration. MCG
chose the most compatible configurations for the other tested platform. MCG ran the queries on both
platforms. Choosing compatible configurations is subject to judgment. We have attempted to
describe our decisions in this paper.

Although we used the TPC Benchmark™ H (TPC-H)1 specification to derive our data and queries, this
was NOT an official TPC benchmark.

In this writeup, all the information necessary is included to replicate this test. You are encouraged to
compile your own representative queries, data sets, data sizes and compatible configurations and test
for yourself.

1
    More can be learned about the TPC-H benchmark at http://www.tpc.org/tpch/.
© MCG 2019                                http://www.mcknightcg.com                                 Page 2
Cloud Analytical Database Performance Testing
Cloud Analytics Platform Offerings
Big data analytics platforms load, store, and analyze volumes of data at high speed, providing timely
insights to businesses. Data-driven organizations leverage this data, for example, for advanced
analysis to market new promotions, operational analytics to drive efficiency, or for predictive
analytics to evaluate credit risk and detect fraud. Customers are leveraging a mix of relational
analytical databases and data warehouses to gain analytic insights.
This report focuses on relational analytical databases in the cloud, because deployments are at an all-
time high and poised to expand dramatically. The cloud enables enterprises to differentiate and
innovate with these database systems at a much more rapid pace than was ever possible before. The
cloud is a disruptive technology, offering elastic scalability vis-à-vis on-premises deployments,
enabling faster server deployment and application development, and allowing less costly storage. For
these reasons and others, many companies have leveraged the cloud to maintain or gain momentum
as a company.
This paper specifically compares two fully-managed, cloud-based analytical databases, Actian
Avalanche and Amazon Redshift, two relational analytical databases based on massively parallel
processing (MPP) and columnar-based database architectures that scale and provide high-speed
analytics. It should be noted while our testing measures the cloud-based performance of both
offerings, Avalanche, unlike Redshift, is also available as an on-premise offering, Vector. In addition,
Vector is available for developers as a free on-premise community edition, as a download with
support in both the Amazon Web Services (AWS) and Azure marketplaces with single-click
deployment.
Table 1. Platform Summary
Actian Avalanche Amazon Redshift
Company Actian Amazon
First Released 2010 (as VectorWise) 2014
Current Version 5.1 1.0.5833
SQL Ansi-2016 Compliant PostgreSQL 8
© MCG 2019 http://www.mcknightcg.com Page 3Cloud Analytical Database Performance Testing
Test Setup
Although we used the TPC Benchmark™ H (TPC-H) specification to derive our data and queries, this
was NOT an official TPC benchmark. The queries were executed using the following setup,
environment, standards, and configurations.
Cluster Environments
We selected the cluster configuration based on fit-for-performance and closest price proximity.
The measure of Actian Avalanche compute power is known as Avalanche Units (AU). At the time of
this writing, Avalanche is priced at $1.99 per AU per hour. This price includes both compute and
cluster storage.
Amazon Redshift has four configuration options—large and 8xlarge classes for both dense compute
or dense storage architecture. For our performance testing, we used the lowest hourly rate we found
for Redshift’s 8xlarge class—which was a dc2.8xlarge instance type was $4.80 per node 2. Redshift also
has reserved instance pricing, which can be substantially cheaper than on-demand pricing. However,
reserved instance pricing can only be procured with 1 or 3-year commitments and is cheapest when
paid in full upfront. Long commitments are out of scope for this field test, so we chose the lowest on-
demand rate.
Our performance testing included two different cluster environments:
● Actian Avalanche 32 Avalanche Units (AU)
● Amazon Redshift dc2.8xlarge 16 nodes (with 32 CPUs 244GB RAM each)
Test Data
The data sets used in the performance tests were derived directly from the TPC-H.
From tpc.org: “The TPC-H is a decision support benchmark. It consists of a suite of business-oriented
ad-hoc queries and concurrent data modifications. The queries and the data populating the database
have been chosen to have broad industry-wide relevance. This benchmark illustrates decision support
systems that examine large volumes of data, execute queries with a high degree of complexity, and
give answers to critical business questions.”
To show the data model, the following diagram was taken from page 13 of the TPC-H Revision 2.17.3
specification document.
2
Amazon Redshift pricing was found at https://aws.amazon.com/redshift/pricing/.
© MCG 2019 http://www.mcknightcg.com Page 4Cloud Analytical Database Performance Testing Figure 1. TPC-H Data Model To give an idea of the data volumes used in our performance testing, the following table gives row counts of the database when loaded with 10TB of data: Table 2. Table Row Count @ 10TB Table 10TB Row Count Customer 1,500,000,000 Line Item 59,999,994,267 Nation 25 Region 5 Orders 15,000,000,000 Part 2,000,000,000 Supplier 100,000,000 PartSupp 8,000,000,000 Data Loading and Additional Setup © MCG 2019 http://www.mcknightcg.com Page 5
Cloud Analytical Database Performance Testing

For the selected platforms, we created the test tables according to above schema, loaded the data
into both clusters, and performed some additional configuration according to the recommended best
practices of each platform.

When creating the test tables, we specified some partitioning/distribution schemes for both
Avalanche and Redshift. For Avalanche, we partitioned the larger tables on key fields. On Redshift,
partitioning is called distribution, but it is essentially the same effect. Both are specified in the data
definition language (DDL), i.e., the CREATE TABLE statements, of both platforms. Both horizontally
distribute the data, so that rows that share the same partition/distribution key value will be stored on
the same node of the cluster. This is critical to performance in clustered environments, because when
the database engine creates hash tables for join and aggregation operations, if the rows for one
group is spread over different nodes, the DBMS must consolidate all the group’s data into a single
node’s memory for processing. This is horribly inefficient. Even though this test was NOT an official
TPC Benchmark™ H, the partitioning/distribution of data would be allowed under section 1.5.4 of the
specification document.

The test data was stored in parquet format in an AWS Simple Storage Service (S3) bucket. For Actian
Avalanche, we loaded data by creating an EXTERNAL TABLE directly to our test data. Then we used
INSERT to load the data from the external table into the test tables we created for the benchmark.
For Redshift, we used the COPY command to load the data directly from the same S3 bucket. The
same generated source data was used for both platforms.

Once the data was loaded, statistics were gathered for both platforms. For Avalanche, the CREATE
STATS command was used for each table. For Redshift, the ANALYZE command was issued for each
table. This operation is also allowed by the TPC-H specification in section 5.2.8.

Additionally for both platforms, we created primary and foreign key constraints for the test tables
with ALTER TABLE commands. There is a slight difference in the implementation of this for each
platform. In Redshift, the constraints are accepted, but not enforced by the DBMS. They are used only
for query planning to improve performance. For Avalanche, the constraints are enforced—meaning
an error is thrown if a constraint is violated. Avalanche also uses the constraints to assist with query
execution planning. The constraints used complied with the TPC-H specification section 1.4.2.

Finally on Avalanche, we created explicit indexes. According to Actian documentation, indexing is not
always required for good performance. However, they recommend indexing for large tables with
highly selective queries. Indexes are allowed by TPC-H specification section 1.5.7. However, Redshift
does not use indexes. According to Amazon’s website, “Amazon Redshift doesn’t require the creation
and maintenance of indexes: every column is almost its own index, with just the right structure for
the data being stored.”

The following table summarizes the additional setup we did to the test data prior to executing the
performance queries.

© MCG 2019                           http://www.mcknightcg.com                                    Page 6
Cloud Analytical Database Performance Testing

Table 3. Additional Setup

                Partition/Distribution      Constraints                          Indexes
 Table         Avalanche      Redshift
                                   Avalanche          Redshift             Avalanche Redshift
                                 PK c_custkey     PK c_custkey
 Customer c_custkey   c_custkey                                          c_custkey      N/A
                                 FK n_nationkey FK n_nationkey
                                 FK o_orderkey FK o_orderkey
                                 FK ps_partkey    FK ps_partkey
 Line Item l_orderkey l_orderkey FK ps_suppkey FK ps_suppkey             l_orderkey      N/A
                                 FK p_partkey     FK p_partkey
                                 FK s_suppkey     FK s_suppkey
                                 PK n_nationkey PK n_nationkey
 Nation    none       none                                               n_regionkey    N/A
                                 FK r_regionkey FK r_regionkey
 Region    none       none       PK r_regionkey PK r_regionkey           r_regionkey    N/A
                                 PK o_orderkey PK o_orderkey
 Orders    o_orderkey o_orderkey                                         o_orderdate N/A
                                 FK c_custkey     FK c_custkey
 Part      p_partkey  p_partkey  PK p_partkey     PK p_partkey           p_partkey      N/A
                                 PK s_suppkey     PK s_suppkey
 Supplier  none       none                                               s_nationkey    N/A
                                 FK n_nationkey FK n_nationkey
                                 PK ps_partkey    PK ps_partkey
                                 PK ps_suppkey PK ps_suppkey
 PartSupp ps_partkey ps_partkey                                          ps_partkey     N/A
                                 FK p_partkey     FK p_partkey
                                 FK s_suppkey     FK s_suppkey

Queries
We sought to replicate the TPC-H Benchmark queries modified only by syntax differences required by
the platforms. The TPC’s benchmark is a fair representation of enterprise query needs. The queries
used for the derived tests were compliant with the standards set out by the TPC-H specification and
included only minor query modifications as set out by section 2.2.3 of the TPC-H specification
document. For example, minor query modifications included vendor-specific syntax for date
expressions. Also, in the specification, queries 2, 3, 10, 18 and 21 require row limits and, thus, vendor
specific syntax was used (e.g., TOP, FIRST, LIMIT, and so forth) as allowed by section 2.1.2.9 of the
TPC-H specification.

Our testing included all 22 queries of the TPC-H specification, which are described by the table below.

Table 4. Query Descriptions

                                                     Sub-             Min/                     Top/
 Q#      Description                           Sum           Joins*          Avg      Count
                                                     query            Max                      Limit
  1      Pricing Summary Report                 ✓                             ✓        ✓
  2      Minimum Cost Supplier                        ✓        5       ✓                        ✓

© MCG 2019                               http://www.mcknightcg.com                                  Page 7
Cloud Analytical Database Performance Testing
3 Shipping Priority ✓ 3 ✓
4 Order Priority Checking ✓ 2 ✓
5 Local Supplier Volume ✓ 6
6 Forecasting Revenue Change ✓
7 Volume Shipping ✓ ✓ 6
8 National Market Share ✓ ✓ 8
9 Product Type Profit Measure ✓ ✓ 6
10 Returned Item Reporting ✓ 4 ✓
11 Important Stock Identification ✓ ✓ 3
12 Shipping Modes and Order Priority ✓ 2
13 Customer Distribution ✓ 2 ✓
14 Promotion Effect ✓ 2
15 Top Supplier ✓ 2 ✓
16 Parts/Supplier Relationship ✓ 2 ✓
17 Small Quantity Order Revenue ✓ ✓ 2 ✓
18 Large Volume Customer ✓ ✓ 3 ✓
19 Discounted Revenue ✓ 2
20 Potential Part Promotion ✓ ✓ 3
21 Suppliers Who Kept Orders Waiting ✓ 4 ✓ ✓
22 Global Sales Opportunity ✓ ✓ 2 ✓ ✓
*Given as the number of tables involved in joins. Both implicit and explicit joins are counted.
© MCG 2019 http://www.mcknightcg.com Page 8Cloud Analytical Database Performance Testing
Test Results
There are some important distinctions of the performance testing described here within and the TPC-
H. These include:
Data and Schema
• The schema and data used were from the TPC-H.
Single-User Power Runs
• Three power runs were completed. Each of the 22 queries was executed three times in order
(1, 2, 3,…) against each vendor cloud platform, and the fastest of the three times was used as
the performance metric.
• For this workload, the primary metric used was the best execution times for each query. These
best times were then added together to gain the total aggregate execution time for the entire
workload.
Single-User Power Runs with Continuous Updates
• Three power runs were repeated—this time with continuous updates happening at the same
time. The update methodology was derived from the TPC-H specification document, section
2.5, which refers to continuous updates as “refresh functions.” During the tests, the following
operations were performed:
o Begin loop
§ Insert a new row into the ORDERS table
§ Insert a random number (between 1 and 7) of new rows into the LINEITEM
table
§ Delete an old row from the ORDERS table
§ Delete the rows (between 1 and 7) from the LINEITEM table which correspond
to the deleted order
o End loop and repeat continuously
• Each of the 22 queries was executed three times in order (1, 2, 3,…) against each vendor cloud
platform while continuous updates were also being processed, and the fastest of the three
times was used as the performance metric.
• For this workload, the primary metric used was the best execution times for each query. These
best times were then added together to gain the total aggregate execution time for the entire
workload.
20-User Power Runs
• Three power runs were also completed simulating 20 concurrent users. For these tests, 20
identical query requests (threads) of the 22 queries were simultaneously submitted. This
differs from the throughput (multi-stream) runs defined by the TPC-H. The diagram below
represents this test.
• For the concurrency simulation workload, the primary metric used was the average execution
time across all 20 users for each query. The best average of the three runs was taken.
© MCG 2019 http://www.mcknightcg.com Page 9Cloud Analytical Database Performance Testing
20-User Power Runs with Continuous Updates
• The 20-User Power Runs test was repeated with the continuous updates running
simultaneously.
• The same continuous update methodology was used as described in the Single-User Power
Runs with Continuous Updates section above.
• Once again, the primary metric used was the average execution time across all 20 users for
each query. The best average of the three runs was taken.
Table 5. Concurrent User Simulation
Thread 1 2 3 4 5 6 7 8 9 10
Query 3 3 3 3 3 3 3 3 3 3
Thread 11 12 13 14 15 16 17 18 19 20
Query 3 3 3 3 3 3 3 3 3 3
This section analyzes the results from the tests described earlier using these methods.
Single-User Power Runs
The following chart shows the aggregate total performance of the best times for each platform. As
you can see, Actian Avalanche was 81% faster that Amazon Redshift when considering the entire
workload.
Figure 6. Single-User Power Runs Aggregate Results
[Chart]
The following table shows the full set of individual query times (in seconds) for both Actian Avalanche
and Amazon Redshift.
Table 7. Single-User Power Runs Individual Results
Query Avalanche Redshift Query Avalanche Redshift
1 10.860 21.069 12 1.461 22.072
2 1.887 5.404 13 64.949 34.084
3 12.926 36.087 14 4.001 11.316
4 0.483 28.290 15 7.278 12.319
5 14.868 17.531 16 13.653 6.790
6 0.815 6.083 17 7.773 17.890
7 10.764 21.874 18 5.423 35.897
8 5.482 15.457 19 10.825 29.995
9 75.416 66.257 20 8.128 17.210
© MCG 2019 http://www.mcknightcg.com Page 10Cloud Analytical Database Performance Testing
10 6.421 18.795 21 15.916 36.046
11 53.464 163.726 22 16.663 8.184
TOTAL 349.456 632.376
Single-User Power Runs with Continuous Updates
The following chart shows the aggregate total performance of the best times for each platform. As
you can see, Actian Avalanche was 41% faster that Amazon Redshift with continuous updates running
when considering the entire workload.
Figure 8. Single-User Power Runs with Continuous Updates Aggregate Results
[Chart]
Table 9. Single-User Power Runs with Continuous Updates Individual Results
Query Avalanche Redshift Query Avalanche Redshift
1 11.745 27.189 12 1.807 25.961
2 2.467 8.902 13 104.672 35.788
3 19.615 37.218 14 4.387 11.604
4 0.559 32.803 15 8.042 12.497
5 15.364 21.100 16 19.209 6.920
6 1.148 7.088 17 13.257 20.652
7 16.710 23.368 18 6.360 40.906
8 9.833 17.499 19 35.076 34.240
9 112.832 72.634 20 8.703 18.056
10 6.948 21.124 21 18.674 42.883
11 54.090 167.665 22 20.282 8.257
TOTAL 419.780 694.354
20-User Power Runs
The following chart shows the aggregate total performance of the best times for each platform. As
you can see, Actian Avalanche was 2.8 times faster that Amazon Redshift when considering the entire
workload.
Figure 10. 20-User Power Runs Aggregate Results
[Chart]
© MCG 2019 http://www.mcknightcg.com Page 11Cloud Analytical Database Performance Testing
The following table shows the full set of individual query times (in seconds) for both Actian Avalanche
and Amazon Redshift.
Table 11. 20-User Power Runs Individual Results
Query Avalanche Redshift Query Avalanche Redshift
1 56.590 249.773 12 13.359 196.907
2 11.686 34.241 13 171.445 416.636
3 114.076 211.547 14 23.844 68.421
4 5.067 231.166 15 54.163 144.301
5 45.903 127.747 16 45.611 59.638
6 9.789 44.889 17 101.095 188.722
7 122.635 178.005 18 51.928 363.911
8 42.558 126.440 19 112.273 237.823
9 444.855 512.191 20 86.118 105.567
10 67.424 146.589 21 73.385 484.466
11 198.757 1,171.499 22 60.323 75.383
TOTAL 1,912.884 5,375.863
20-User Power Runs with Continuous Updates
The following chart shows the aggregate total performance of the best times for each platform. As
you can see, Actian Avalanche was 2.4 times faster that Amazon Redshift with continuous updates
running when considering the entire workload.
Figure 12. 20-User Power Runs with Continuous Updates Aggregate Results
[Chart]
Table 13. 20-User Power Runs with Continuous Updates Individual Results
Query Avalanche Redshift Query Avalanche Redshift
1 63.723 288.657 12 49.183 225.171
2 16.426 36.976 13 214.240 451.462
3 116.265 233.143 14 24.038 75.491
4 6.216 281.559 15 57.202 153.519
5 51.208 146.603 16 45.703 65.352
6 17.770 49.971 17 179.984 249.974
7 162.977 194.416 18 62.609 396.375
8 197.684 134.077 19 216.760 284.229
9 497.868 570.587 20 92.129 113.709
© MCG 2019 http://www.mcknightcg.com Page 12Cloud Analytical Database Performance Testing
10 82.188 167.401 21 79.090 532.886
11 218.573 1,294.389 22 62.785 79.769
TOTAL 2,514.621 6,025.716
Price Per Performance
The price-performance metric is dollars per query-hour ($/query-hour). This is defined as the
normalized cost of running our performance testing workloads on each of the cloud platforms. It was
calculated by multiplying the best on-demand rate (expressed in dollars) offered by the cloud
platform vendor (at the time of testing) times the number of computation nodes used in the cluster
and by dividing this amount by the aggregate total of the best execution times for each query
(expressed in hours).
If you contiguously ran all 22 of these queries to completion of the set, the cost at an hourly basis is
indicated in the chart below. As you can see, Actian Avalanche completed these queries with 2.2
times more cost effectiveness than Amazon Redshift.
Figure 14. Single-User Price-Performance @ 10TB ($ per Query per Hour)
[Chart]
The following table details the breakdown of the price-performance calculation.
Table 15. Single-User Price-Performance @ 10TB Breakdown
Avalanche Redshift
Instance Class Standard dc2.8xlarge
Node Count 32 AU 16 nodes
Compute ($/node/hour) $1.99 $4.80
Total Compute ($/hour) $63.68 $76.80
Total Execution Time (seconds) 349 632
Concurrent Users 1 1
Price-Performance ($/query-hour) $6.18 $13.49
If you ran all 22 of these queries to completion of the set using our method to simulate 20 concurrent
users and added up the average completion time of each query, the cost at an hourly basis is
indicated in the chart below. As you can see, Actian Avalanche completed these queries with 3.4
times more cost effectiveness than Amazon Redshift.
© MCG 2019 http://www.mcknightcg.com Page 13Cloud Analytical Database Performance Testing
Figure 16. 20-User Price-Performance @ 10TB ($ per Query per Hour)
[Chart]
The following table details the breakdown of the price-performance calculation.
Table 17. 20-User Price-Performance @ 10TB Breakdown
Avalanche Redshift
Instance Class Standard dc2.8xlarge
Node Count 32 AU 16 nodes
Compute ($/node/hour) $1.99 $4.80
Total Compute ($/hour) $63.68 $76.80
Total Execution Time (seconds) 1,913 5,376
Concurrent Users 20 20
Price-Performance ($/query-hour) $1.69 $5.73
© MCG 2019 http://www.mcknightcg.com Page 14Cloud Analytical Database Performance Testing Conclusion Cloud analytical databases are a way for enterprises to avoid large capital expenditures, provision quickly, and provide performance at scale for advanced analytic queries. Relational databases with analytic capabilities continue to support the advanced analytic workloads of the organization with performance, scale, and concurrency. For our performance testing, which contains a representative set of corporate-complex queries derived from the well-known TPC Benchmark™ H (TPC-H)3 standard, Actian Avalanche outperformed Amazon Redshift. Overall, the performance testing results were insightful in revealing query execution performance and some of the differentiators for the tested platforms. Actian Avalanche query response times on the 10TB performance tests were 81% faster than Redshift. When 20 concurrent users were simulated, Avalanche was 2.8 times faster. In terms of price per performance, Actian Avalanche ran the performance test queries 2.2 times cheaper than Redshift in terms of cost per query per hour. When 20 concurrent users were simulated, Avalanche was 3.4 times cheaper. These performance results are most likely explained by the technology underlying Vector. The basic architecture of Actian Avalanche is the Actian patented X100 engine, which utilizes a concept known as "vectorized query execution" where processing of data is done in chunks of cache-fitting vectors. Vector performs “single instruction, multiple data” processes by leveraging the same operation on multiple data simultaneously and exploiting the parallelism capabilities of modern hardware. It reduces overhead found in conventional "one-row-at-a-time processing" found in other platforms. Additionally, the compressed column-oriented format uses a scan-optimized buffer manager. Overall, Actian Avalanche is an excellent choice for data-driven companies needing high performance and a scalable, fully-managed analytical database in the cloud—at a reasonable cost. 3 This was NOT an official TPC Benchmark™ H (TPC-H) benchmark. More can be learned about the TPC-H benchmark at http://www.tpc.org/tpch/. © MCG 2019 http://www.mcknightcg.com Page 15
Cloud Analytical Database Performance Testing

About McKnight Consulting Group
About MCG

Learn more at http://www.mcknightcg.com/.

About Actian
Actian, the hybrid data management, analytics and integration company, delivers data as a
competitive advantage to thousands of customers worldwide. Through the deployment of innovative
hybrid data technologies and solutions Actian ensures that business critical systems can transact and
integrate at their very best – on premise, in the cloud or both. Thousands of forward-thinking
organizations around the globe trust Actian to help them solve the toughest data challenges to
transform how they run their businesses, today and in the future.

To learn more about Actian Avalanche, visit www.actian.com/avalanche

© MCG 2019                         http://www.mcknightcg.com                                 Page 16
You can also read