SW BI101 Cardinal Business Intelligence Reporting Overview - Web Based Training
←
→
Page content transcription
If your browser does not render page correctly, please read the page content below
SW BI101
               Cardinal Business Intelligence Reporting
                                              Overview

                                         Web Based Training

Rev 6/4/2019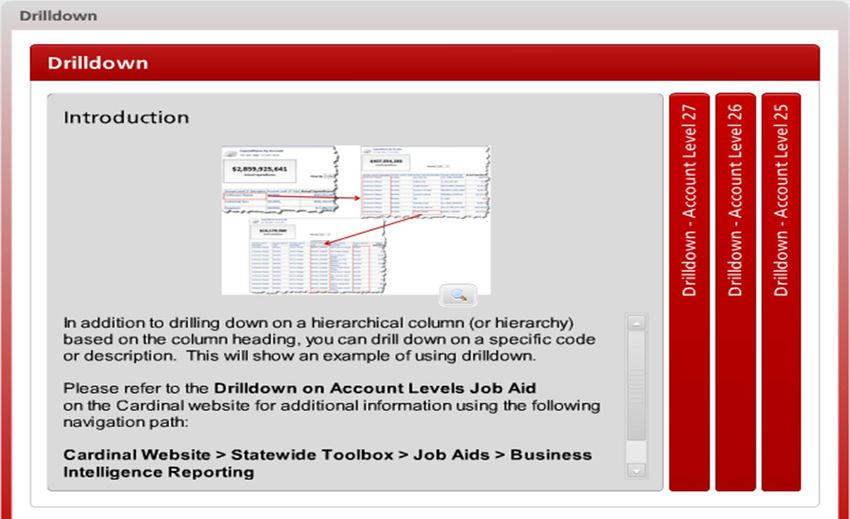
Welcome to Cardinal Training
This training provides participants with the skills and information necessary to use Cardinal and is not intended to
replace existing Commonwealth and/or agency policies.
This course, and the supplemental resources listed below, are located on the Cardinal website
(www.cardinalproject.virginia.gov) under Training.
Cardinal Reports Catalogs are located on the Cardinal website under Resources:
•   Instructor led and web based training course materials
•   Job aids on topics across all functional areas
•   Variety of simulations
•   Glossary of frequently used terms
The Cardinal screenshots included in this training course show system pages and processes that some users
may not have access to due to security roles and/or how specific responsibilities relate to the overall transaction
or process being discussed.
For a list of available roles and descriptions, see the Statewide Cardinal Security Handbook on the Cardinal
website in the Security section under Resources.

                                                                                                                  1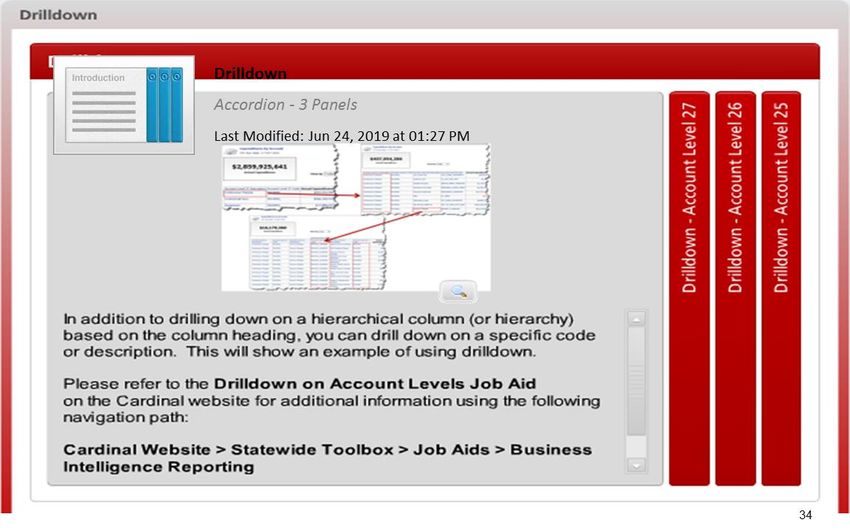
Course Objectives
After completing this course, you will be able to:

         Understand the purpose of Cardinal Business Intelligence

              Understand the functionality of a dashboard and a report

                Log into Cardinal Business Intelligence

                Use the Global Header

              Understand prompts and use prompt capabilities to filter report data

         Understand hierarchy drilldowns and guided navigation between dashboard pages

                                                                                         2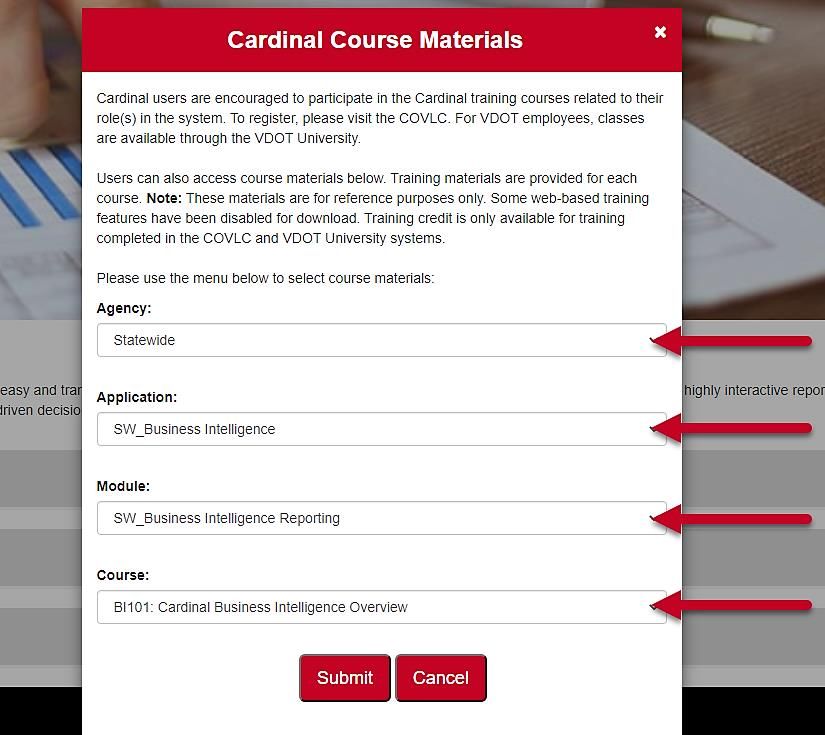
Course Objectives (continued)

  Understand available report features

      Understand the different report and graph types

        Manipulate report columns on a dashboard

        Use different print and export options

      Set default prompts on a dashboard page

  Set a landing page

                                                        3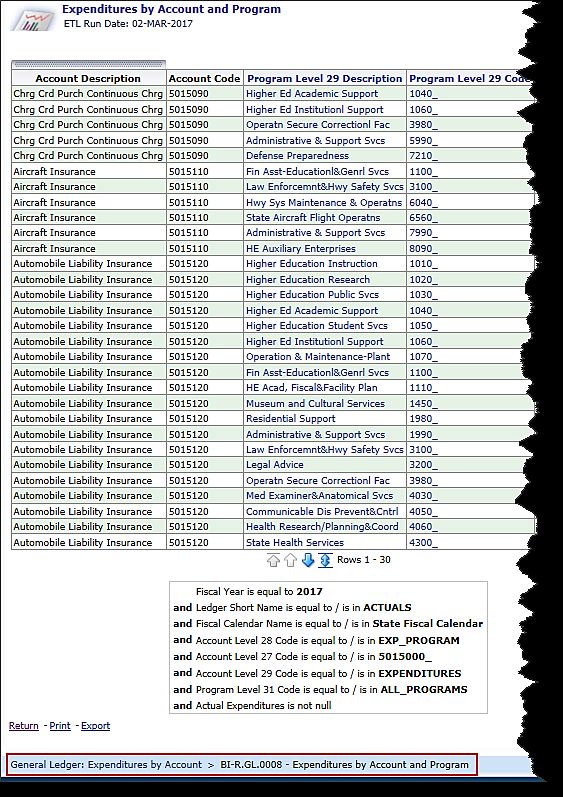
Course Objectives (continued)

  Clear personalization

      Find Cardinal Business Intelligence Help

                                                 4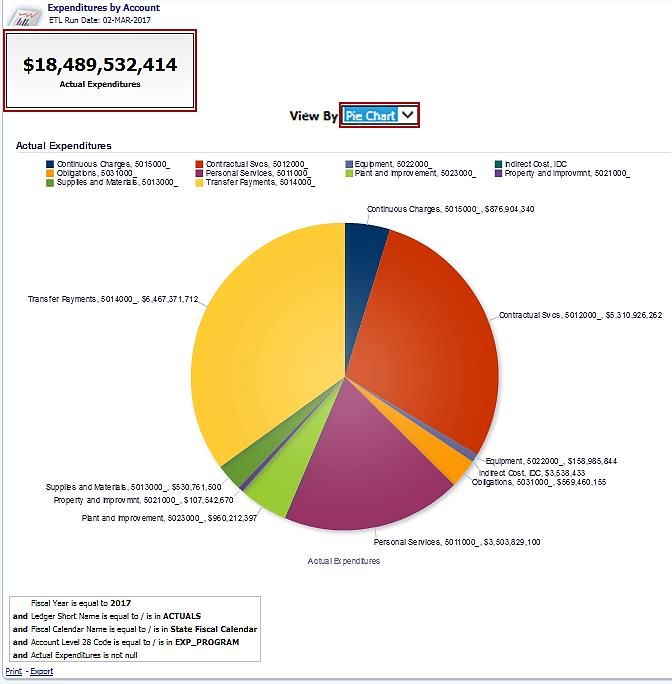
Agenda

   1     Cardinal Business Intelligence Basics

   2     Dashboards and Reports

   3     Personalization and Finding Help

                                                 5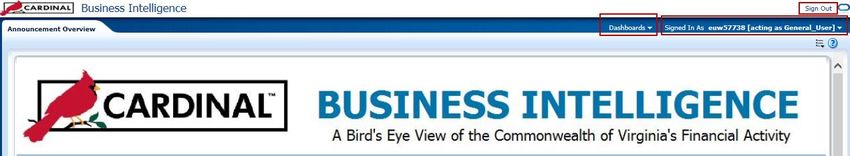
Lesson 1: Introduction

             1               Cardinal Business Intelligence Basics

This lesson covers the following topics:

•   Cardinal Business Intelligence Overview

•   Logging Into Cardinal Business Intelligence

                                                                     6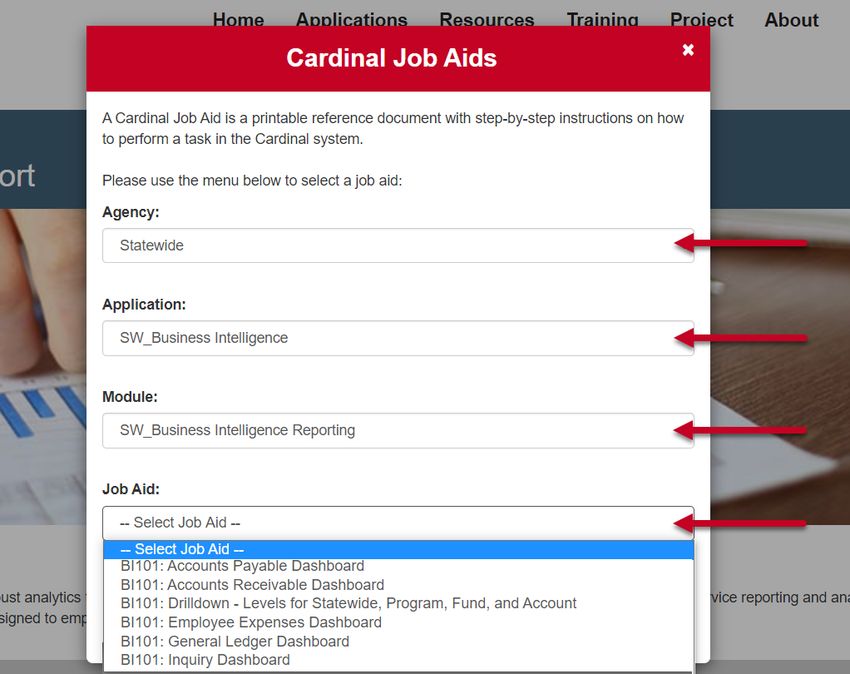
Cardinal Business Intelligence Overview
The Cardinal Business Intelligence (BI) Solution is a tool created using Oracle Business Intelligence
Enterprise Edition (OBIEE) that:

•   Provides easy access to Cardinal information across a wide range of audiences through self-service
    reporting and analysis (General Ledger, Accounts Payable, Employee Expenses, and Accounts
    Receivables information).
•   Empowers executive, managerial, and select agency operational staff to make data driven, fact-based
    decisions using Key Performance Indicators (KPIs) focused on outcomes.
•   Provides transparent access to data.

This web based training teaches the navigation and general use of the Cardinal BI Solution and is not specific
to the Cardinal system. For more detailed information about Cardinal BI, see the Job Aids located on
the Cardinal website in Job Aids under Training.

Note: There is typically a one day interval between the time the data is posted in Cardinal and the time the
data is posted in BI. The BI data is refreshed from the Cardinal system nightly and does not reflect real time
information.

                                                                                                                 7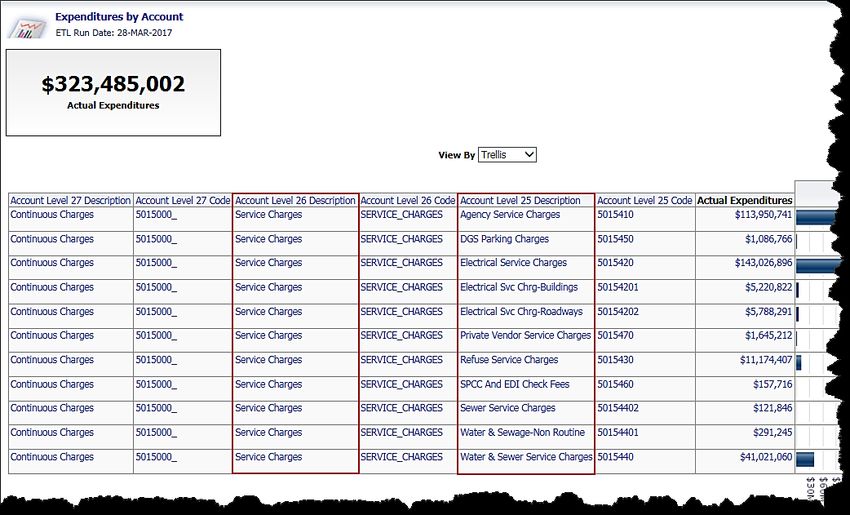
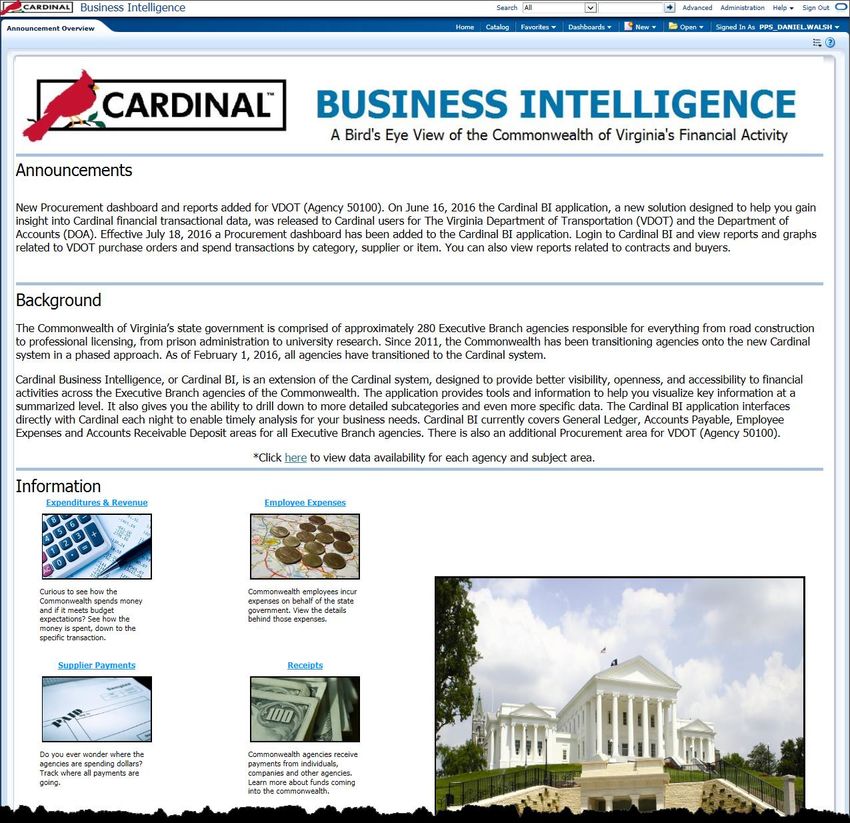
Dashboard and Report Overview
Cardinal Business Intelligence (BI) is made up of many Dashboards, Dashboard Pages, and Reports.
A Dashboard is a structure that organizes analytical content (e.g., General Ledger, Accounts Payable,
Accounts Receivable, and Employee Expenses). The content on a Dashboard Page (e.g., reports, links,
visualizations) is usually displayed as one or more reports.
In the below example, the General Ledger Dashboard is displayed with the Expenditures by Account
Dashboard Page (tab) selected. This Dashboard Page is used to review the Expenditures by Account
Report.

                                                                                                        8
Dashboard and Report Overview (continued)
In BI, a Report is an analysis displayed as a table or
visualization based on a data set. There can be
multiple reports placed on one Dashboard Page.

In this example, the two Reports on the
Expenditures and Revenue Summary Page (tab)
are:

•   Expenditures Budget vs. Actual

•   Revenue Budget vs. Actual

                                                         Click on image to enlarge

                                                                                     9
Logging In
Access the Cardinal BI Solution logon page using
the following link:
my.cardinal.virginia.gov
From the logon page, enter your User ID and
Password.
User ID: Your User ID for Cardinal BI is the same as
your Active Directory account User ID.
Note: Your User ID is based on first name and last
name only. Use firstname.lastname as the User ID
and exclude “@agencyname.virginia.gov”.
Password: Cardinal BI uses the same password as
your Active Directory account password.
10Global Header
Once logged in, the Global Header provides quick access to commonly used functions:
• Dashboards: Links to all Dashboards that are available to the user (this is the primary way to navigate
through the Cardinal BI Solution).
• Signed In As: Displays the username and links to My Account, for specific preferences.
• Sign Out: Click this link to sign out of Cardinal BI.
11Announcements Overview
Below the Global Header, the Announcement Overview page displays with the following sections:
• Announcements
• System outages, system upgrades, and important information related to the BI system.
• Background
• Cardinal system and Cardinal BI Information.
• Information
• Links to each of the subject area Dashboards and Dashboard pages. For example, click on the
“Expenditures and Revenue” link and see the details for the 7 Dashboard pages related to
expenditures and revenue.
• Disclaimer
• Statement that defines risk and responsibility for any user of the BI system.
• Related Sites
• Links to other related websites.
12Announcements Overview (continued)
The Information section of the Announcements
Overview page provides access to the following links:
• Expenditures and Revenue
• Employee Expenses
• Supplier Payments
• Receipts
• Procurement (VDOT Only)
Clicking on a link in the Information section displays
the list of Dashboard pages related to that link.
Users can click on any Dashboard page link and view
the report(s) on that dashboard page.
13Lesson 1: Checkpoint
Now is your opportunity to check your understanding of the course material.
Read the question on the next slide(s), select answer(s) and click Submit to see if you chose the correct
response.
1415
16
17
Lesson 1: Summary

             1                 Cardinal Business Intelligence Basics

In this lesson, you learned:
•   The Cardinal BI Solution is an OBIEE tool used to provide transparent and easy access to Cardinal
    information across a wide range of audiences through self-service reporting and analysis.
•   Cardinal BI is made up of Dashboards and Reports. Each Dashboard will have at least one Report.
•   Log into Cardinal BI through my.cardinal.virginia.gov with your Active Directory User ID and Password.
•   The Global Header and Announcements page allows easy access to important links.

                                                                                                             18
Lesson 2: Introduction
2 Dashboards and Reports
This lesson covers the following topics:
• Navigation
• Prompts
• Report features
• Report types
• Exporting and printing
19Navigation
The Dashboards button is the key navigational link, allowing movement from one subject area to another in
order to view different Reports.
Dashboards are organized by subject areas; a logical grouping of similar content and information (e.g.,
Accounts Payable, Accounts Receivables, Employee Expenses, and General Ledger).
A list of all the available subject area Dashboards can be found under the Dashboards link on the Global
Header.
For example, to see General Ledger Reports, use the following path:
Dashboards >Cardinal >General Ledger
20Navigation (continued)
Once a subject area is selected from the drop-down list, the Report(s) on the first Dashboard of that subject
area will run based upon predefined prompt values. In the example below, the Accounts Receivable
subject area was selected.
Navigate between the Dashboard pages within the subject area by clicking on the individual tabs. Each
Dashboard page (tab) will then display the corresponding Reports. In the example below, Agency Deposit
Overview and Customer Deposit Overview are the different Dashboards within the Accounts Receivable
subject area.
Most Reports can be accessed through a Dashboard page. This is the primary method of navigation in
Cardinal BI.
21Prompts
Reports are run with default criteria. Prompt criteria can be changed. For example, most Dashboard pages
are defaulted to show Reports from a statewide perspective. Use prompts to narrow the reporting results to a
specific agency.
Prompts
• Available at the top of each Dashboard page.
• Allow you to filter the Dashboard to smaller increments of data.
• Once applied, the Report for that Dashboard will reflect the newly queried selections.
• Many Dashboard pages default prompt values. However, these defaults can be changed.
Constrained Prompts limit all other prompt values. For example, if an agency number is used as a
constrained prompt, the Program prompt only shows programs for that agency. A prompt selection may not
display because a previously constrained prompt value eliminated it as a choice.
The example below displays the following prompts:
Fiscal Year Secretariat Level Name
Agency Description Program Level 30 Code
22Prompts (continued)
An asterisk (*) indicates that the prompt is a required field and a selection must be made.
After selecting prompt values, click the Apply button to run the report.
Note: Pressing Enter does not apply prompt values to the Dashboard.
The Reset button provides three options:
Reset to last applied values: resets all prompt values to the most recently run values
Reset to default values: resets to default prompt values for that Dashboard page
Clear All: clears all prompt values
23Types of Prompts
There are different types of prompts that allow different user input options. The Cardinal BI prompt types
include:
• Radio Buttons
• Checkboxes
• Choice Lists
• Text Fields
• Sliders
Some prompts allow you to Select One value, while other prompts allow you to Select Multiple values.
Select One Select Multiple
24Auto-Complete
Auto-Complete suggests and highlights matching prompt values as the user types in the prompt selection
field. In the example below, typing the word Virginia caused only those agencies that contain the word
Virginia to display in the Agency Description prompt.
25Searching Prompts
Often the list of values within a prompt is very extensive. Cardinal BI has an automatic search feature that
reduces the number of prompt values as a value is typed.
Use the More/Search feature if the exact value is not known or to choose more than one value.
26Searching Prompts (continued)
Once the Search… button has been selected, the Select Values window shown below displays.
Select the type of search: Starts, Contains, Ends, is Like (pattern match).
27Searching Prompts (continued)
After a search type is chosen, enter the search criteria (in this example “Dept”). Move the selected items to
the Selected box via the Move or Move All arrows.
28Searching Prompts (continued)
Select OK to finish, the selected item appears in the prompt field.
29Report Features
Select View is a drop-down list to select a specific view of the results.
In this example, the Select View allows the following options:
• Trend Revenue and Expenditures
• Trend Revenue
• Trend Expenditures
30Report Features (continued)
Column selector: a set of drop-down lists that contain pre-selected columns. Select columns and change
the data that is displayed in the views of the analysis as needed.
In the example below, the column selector provides the option to select and view the Budget Amount or the
Transaction Amount in the analysis.
31Drilldowns
Cardinal BI allows drilling down on a column for more detailed information. The most common drilldown is a
hierarchical column (or hierarchy). A hierarchy is a column that drills down into more specific information
for a certain number of pre-established levels.
For example, the Expenditures by Account Report displays information starting at Level 27. Click on column
header Account Level 27 Code to drill down to Account Level 26 Code.
While drilling down from level to level, always select the farthest “Account Level Code” column to the right to
keep columns in order.
The number of drilldown levels varies for each Report. Some Reports may only have two levels to drilldown
and others may have three, four, or five levels. Drilldowns are based on pre-established levels.
32Drilldowns (continued)
Continue to drill down on the Account Level 26 Code until Account Level 25 Code is displayed. For more
detailed information about Levels and how they relate to Program, Fund, and Account, see the Job Aid titled
Business Intelligence – Drilldown – Levels for Statewide, Program, Fund, and Account located on
the Cardinal website in Job Aids under Training.
3334
Guided Navigation
Guided Navigation allows movement from one
Report to another Report with selected information
from the first Report passed through to the second
Report.

Any number that appears as a hyperlink signifies that
it is possible to use this data to navigate to another
Dashboard or Report.

When clicking on the hyperlinked data, a button
appears with the report name on it (e.g., Expenditure
by Account and Program). Clicking this button allows
the information from that cell to be passed to the next
Dashboard or Report.

                                                          Click on image to enlarge

                                                                                      35
Guided Navigation (continued)
Clicking on the report name opens another Report that has the information that was passed on. For example,
clicking the Expenditure by Account and Program button from the $876,904,340 cell displays the
Expenditure by Account and Program Report with Fiscal Year, Secretariat, Agency Code, and Dollar
Amount passing through from the Expenditures by Account Report.
Guided Navigation allows movement between Dashboards or Reports easily without having to input specific
prompt criteria to find specific information.
Click on image to enlarge 36Navigating With Breadcrumbs
Breadcrumbs identify your current location in Cardinal
BI and to view the path used to get there.
Breadcrumbs are active links that can be used to
navigate back through to the original starting point.
37Navigating With Breadcrumbs (continued)
In this example, we have navigated to the Expenditures by Account and Program Report. The
breadcrumbs are highlighted.
38Return and Back Buttons
Use the Return button on a report page to display the
original Report or drill level that was in place before
you started drilling.
In the example, click on the Return button while on
Account Level 25 to be taken back to Account Level
28.
While drilling down on a Report, click the Back button
at the bottom of a Report to be taken back one level.
In the example, after drilling down to Account Level
25, click the Back button to be taken back to Account
Level 26. Click the Back button again to be taken
back to Account Level 27.
Click on image to enlarge
39Navigating Using the Light Bulb
Users can click on the light bulb and navigate to another Report. In this example, when you click on the
light bulb for William McKinley, then you navigate to the Employee Expense by Expense Group
specifically for William McKinley.
40Reports: Tables and Visualizations
Cardinal BI Reports can be displayed as tables, visualizations, or a combination of the two. Visualizations
are graphs or charts on a Report.
In the next few slides you will see different types of visualizations and tables.
Trellis Pie Chart
41Report Tables
Types of tables:
• Table
Displays results in a visual representation of data organized by rows and columns.
• Pivot table
Displays data similarly to a standard table, but can display multiple levels of both row and column
headings. In the example below, Fiscal Years become columns.
Table Pivot Table
42Table Paging Controls
Cardinal BI defaults to show 30 rows of data on each table or pivot table. You can page through the table by
using the arrow icons at the bottom of each report:
Returns to the beginning of the table output
Takes you up a page
Takes you down a page
Displays maximum (500) rows per page
43Table Functionality
Tables and pivot tables can be easily rearranged. Hovering over a column header causes a gray tab to
appear. Click on the gray tab and drag that column to any position on the report.
44Table Functionality (continued)
Modify a table by right clicking on a column header.
The following options display, depending on the
column properties:
Sort Column
Provides options for sorting the selected column.
Exclude column
Removes the column from the table completely. The
data will no longer be broken out by this column
header.
Include column
Lists the columns available to add into the table.
Including a column will break out the table values
based on this column.
Move Column
Allows you to manipulate the data and move a
particular column to see the data in a different way.
You can move the column within the table, make the
column a prompt for the Report, and create multiple
45
table sections based on the column values.Report Visualizations
Visualizations available in Cardinal BI include:
Graph
Displays numeric information visually, which makes it Graph
easier to understand large quantities of data. Graphs
are used most often and usually reveal trends or show
quantities associated with categories (e.g., Budget
Amount by Year, Actual Expenses by Department).
*Gauge
Plots one data point, indicating whether that point falls
in an acceptable or unacceptable range. (There are
different kinds of gauges (e.g., Dial, Horizontal bar, *Gauge
Vertical bar, Bulb).) Gauges identify problems in data,
making them very useful for showing performance
against goals (e.g., Budget Expense Remaining for a
Department).
* Not currently used in BI 46Report Visualizations (continued)
Performance Tile
Performance Tile
Displays a single aggregate measure value in a
manner that is both visually simple and prominent, yet
it immediately reveals summary metrics that will likely
be presented in more detail within a Dashboard view.
Trellis Trellis
Displays multidimensional data shown as a set of cells
in a grid, where each cell represents a subset of data
using a particular graph type. Data can be
represented with graphs, microcharts, and numbers.
Pie Chart
Shows data sets as dollar amounts or percentages of
a whole. Pie charts are useful for comparing parts of
a whole, such as expenditures by fund, program, or Pie Chart
account.
47Exporting and Printing
At the bottom of each Report, you can print and export
data from that specific Report.
Print
• Printable PDF
• Printable HTML
Export
• PDF
• Excel
• PowerPoint
• Web Archive
• Data (CSV, Tab Delimited, or XML)
Note: Exporting data to a CSV file opens the file in
Excel, which can then saved as an Excel file.
48Exporting and Printing (continued)
You can print all the Reports on a Dashboard page level at once.
• Click on the Page Options button in the upper right corner of the Dashboard. Select Print and then select
either Printable PDF or Printable HTML. The Dashboard is now ready to print.
• This is beneficial to see all Reports on the Dashboard page with the same prompt values associated to
each.
49Exporting and Printing (continued)
You can also export a current Dashboard page or all Dashboard pages to Excel.
• To export a current Dashboard page or all Dashboard pages to Excel, click on the Page Options button in
the upper right corner of the Dashboard. Select Export to Excel and then select either Export Current
Page or Export Entire Dashboard. The exported Dashboard page(s) will open in an Excel file.
50Lesson 2: Checkpoint
Now is your opportunity to check your understanding of the course material.
Read the question on the next slide(s), select answer(s) and click Submit to see if you chose the correct
response.
5152
53
54
Lesson 2: Summary

             2                 Dashboards and Reports

In this lesson, you learned:
•   To navigate through Cardinal BI, use the Dashboards link on the Global Header. Use the tabs within each
    Dashboard to navigate from one Dashboard page to another.
•   Prompts are used on each Dashboard page to filter the data into smaller increments.
•   Report tables and pivot tables have many features that allow sorting, rearranging columns, and modifying
    the way the table displays the data.
•   There are many different types of report graphics that are used to display data.
•   There are different ways to print and export individual reports within Cardinal BI. It is possible to print a
    whole Dashboard page with multiple Reports.

                                                                                                                    55
Lesson 3: Introduction
3 Personalization and Finding Help
This lesson covers the following topics:
• Saved Customization
• Setting Landing Page
• Basic Troubleshooting
• Understanding Report Results
• Cardinal Website
56Saved Customization
Customize a Dashboard page to have certain prompt values automatically populated with a saved
customization. In this example, the Saved Customization sets the Fiscal Year prompt to include 2016 and
2017 for Agency 50100 on the Trend Analysis Dashboard.
57Saved Customization (continued)
To personalize a Dashboard page:
• Navigate to the Dashboard page to personalize
and input desired prompts.
• Click the Page Options button in the upper right
corner of the Dashboard.
• Click the Save Current Customization list item to
save the prompt values within a certain Dashboard.
• Name the page.
• Check the Make this my default for this page
checkbox option to have the customizations
automatically in place when navigating to the
personalized Dashboard.
58Saved Customization (continued)
Users can create multiple Saved Customizations with different prompt values. For example, with multiple
agencies, it is possible to save multiple Dashboard pages, each with a different agency prompted.
To apply another saved Dashboard, select another agency and click on the Apply Saved Customization
button.
The Apply Saved Customization functionality uses a previously saved customization on the current
Dashboard page. In the example below, there are two different Saved Dashboards to choose from.
59Saved Customization (continued)
Modify saved Dashboards by using the Edit Saved Edit Saved Customizations allows renaming and
Customization menu item. editing Saved Customizations. It also allows a
Page Default selection.
.
60Saved Customization (continued)
To clear customizations and view the Cardinal BI
default Dashboard page, use the Clear My
Customization menu item.
To clear customization and view the Cardinal BI
default Dashboard page, use the Clear My
Customization menu item to reset the current
Dashboard back to its default state.
61Setting Landing Page
It is possible to change the default landing page within Cardinal BI in order to see your most important
Dashboard page upon logging in.
• Click on the arrow next to the User Name to the right of Signed In As in the upper right corner, then click
on the My Account link.
• Select the preferred Dashboard Page from the drop-down list entitled Starting Page and click OK.
62Basic Troubleshooting
When working with Cardinal BI, keep in mind these helpful hints:
The Cardinal BI Solution technology (OBIEE) is best optimized when used with:
• Internet Explorer 7.x, 8.x, 9.x, 10.x
• Firefox 3.5+, 6+, 13+
• Chrome 19+
• Safari 4.x, 5.x
Issues can often be fixed by simply clicking the Refresh button on your browser.
Issues can often be fixed by clearing the cache on your browser
• To do this within an IE screen navigate to:
Tools > Internet Options > Browsing History > Delete > select Temporary Internet Files and Cookies >
Delete
63Understanding Report Results
If a Report returns No Results, this means
there is no data that matches the prompt
criteria. Try expanding the prompt values
to include a bigger dataset in order to see
results within the Report.
There are a few report values that may
seem abnormal, but are expected. These
do not signify that the information is
incorrect, rather they are a result of the
relationships within the data.
The values are:
• Blank spaces: In this example, a
ChartField cell contains a blank space.
This signifies that no monetary
transactions exist for that particular
field. However, notice that other fields
are populated with monetary amounts.
64Understanding Report Results (continued)
• Not Applicable: In this example, several ChartField cells contain the words _Not_APPLICABLE_. This
signifies that no data exists for that particular ChartField.
65Access BI Support Materials
For additional information, the link in the upper right corner opens the Cardinal website, providing
access a number of online tools such as Job Aids and Course Materials to help you complete a task.
You can also access Job Aids and Course Materials directly from the Cardinal website under the Training
section. Additional guidance for accessing these materials is provided on the following slides.
66Access BI Job Aids
To access Job Aids from the Cardinal website visit: www.cardinalproject.virginia.gov
From the home page, navigate to Training
• Select Job Aids
• Select Agency: Statewide
• Select Application: SW_Business Intelligence
• Select Module: SW_Business Intelligence Reporting
• Select Job Aid
• Click Submit
67Access BI Course Materials
To access Course Materials from the Cardinal website visit: www.cardinalproject.virginia.gov
From the home page, navigate to Training
• Select Course Materials
• Select Agency: Statewide
• Select Application: SW_Business Intelligence
• Select Module: SW_Business Intelligence Reporting
• Select Course: BI101: Cardinal Business Intelligence
Overview
• Click Submit
68Lesson 3: Checkpoint
Now is your opportunity to check your understanding of the course material.
Read the question on the next slide(s), select answer(s) and click Submit to see if you chose the correct
response.
6970
69
72
Lesson 3: Summary

            3                  Cardinal Business Intelligence Basics

In this lesson, you learned:
•   Users can personalize individual Dashboard pages.
•   Users can make any available dashboard page a personalized landing page.
•   Personalization on a dashboard can be cleared by using the Page Options button.
•   When working within the Cardinal BI Solution, it is helpful to use certain browsers, clear the cache, and
    refresh the page if having issues.
•   Report results sometimes are Not Applicable, blank, or show no results.
•   For additional information about Cardinal Business Intelligence, see the Job Aids located on the Cardinal
    website in Job Aids under Training.

                                                                                                                73
Course Summary
BI101 Cardinal Business Intelligence Overview
In this course, you learned:
• The purpose of Cardinal Business Intelligence.
• How to log into Cardinal Business Intelligence.
• The use of the Global Header.
• The functionality of a Dashboard and a Report.
• How to use prompts and prompt capabilities to Filter report data.
• How to use hierarchy drilldowns and navigation between Dashboard pages.
• The available report features.
• The different Report and graph types.
74Course Summary (continued)
SW BI101 Cardinal Business Intelligence Overview
• How to manipulate report columns on a Dashboard.
• How to print and export data.
• How to set default prompts on a Dashboard page.
• How to set a landing page.
• How to clear personalizations.
• How to find Cardinal Business Intelligence help.
75Appendix
• Key Terms
• Drilldown Interaction
• Screenshot Enlargements
76Key Terms
Cardinal Business Intelligence (BI): A tool created using Oracle Business Intelligence Enterprise Edition
(OBIEE). It focuses on easy access to information to improve information sharing across a wide range of
audiences through self-service reporting and analysis. It is made up of Dashboards and Reports with
analytical content.
Column Selector: A set of drop-down lists that contain pre-selected columns. Dynamically select columns
and change the data that is displayed in the views of the analysis.
Dashboard: A structure that organizes analytical content (e.g., reports, links, visualizations). The content on
a Dashboard is usually displayed as a report targeted to users.
Global Header: A list of links at the top of Cardinal BI that is always available as you work. It allows easy
access to Cardinal BI functionality. For example, Home page, access dashboards, open objects (such as
analyses and dashboard prompts), and so on, are displayed.
Graph: A type of visualization that displays numeric information visually, making it easier to understand large
quantities of data. There are different kinds of graphs, such as: Bar (Vertical, Horizontal, Stacked), Line,
Area, Pie , Line-Bar, Time Series Line, Scatter, Bubble, Radar.
Guided Navigation: A feature that allows navigating to another report with prompt values automatically
enabled that correspond to the original report navigation hyperlink.
Hierarchal column: A column that can expand (or drill down) into more specific information for a certain
number of pre-established levels.
77Key Terms (continued)
Oracle Business Intelligence Enterprise Edition (OBIEE): The technology behind the Cardinal BI
Solution.
Performance Tile: A type of visualization that displays a single aggregate measure value in a manner that is
both visually simple and prominent, yet it immediately reveals summary metrics to the user that will likely be
presented in more detail within a dashboard view.
78Key Terms (continued)
Pie Chart: A type of visualization that shows data sets as dollar amounts or percentages of a whole. Pie
charts are useful for comparing parts of a whole, such as expenditures by fund, program, or account.
Pivot Table: A visual representation of data similar to a standard table. It can display multiple levels of both
row and column headings, allowing you to view data in many different ways.
Prompt: A tool that allows you to filter the dashboard to smaller increments of data. Once a prompt is
applied, the report for that dashboard will reflect the newly queried selections.
Report: An analysis displayed as a table or graphic based on a data set.
Subject Area: A logical grouping of similar content and information.
Table: A visual representation of data organized by rows and columns.
Trellis: A type of visualization that displays multidimensional data shown as a set of cells in a grid, where
each cell represents a subset of data using a particular graph type. Data can be represented with graphs,
microcharts, and numbers.
View Selector: A drop-down list used to select a specific view of the results from among the saved views.
Visualization: A graph or chart on a report. They include graphs, pie charts, gauges, funnels, performance
tiles, trellis, and map views.
79Drilldown Interaction
80
Image enlargement on next pageDrilldown: Account Level 27
81Drilldown Interaction
82
Image enlargement on next pageDrilldown: Account Level 27
83Drilldown: Account Level 26
Image enlargement on next page 84Drilldown: Account Level 27-26
85Drilldown Interaction
Image enlargement on next page 86Drilldown: Account Level 26-25
87Dashboard and Report Overview
Click on image to return 88Guided Navigation
Click on image to return 89Guided Navigation (continued)
Click on image to return
90Return and Back Buttons
Click on image to return
91End Of Appendix
Congratulations! You successfully completed the appendix section of SW BI101: Cardinal Business
Intelligence Overview course.
To close the web based training course, click the ‘X’ button in the upper right corner.
92You can also read