Predicting Price of Cryptocurrency - A Deep Learning Approach
←
→
Page content transcription
If your browser does not render page correctly, please read the page content below
Special Issue - 2021                                            International Journal of Engineering Research & Technology (IJERT)
                                                                                                                   ISSN: 2278-0181
                                                                                              NTASU - 2020 Conference Proceedings

      Predicting Price of Cryptocurrency - A Deep
                  Learning Approach
                       Samiksha Marne                                                          Shweta Churi
          Department of Information Technology                                   Department of Information Technology
 St. Francis Institute of technology of Mumbai University               St. Francis Institute of technology of Mumbai University
                        Mumbai, India                                                          Mumbai, India

                        Delisa Correia                                                         Joanne Gomes
          Department of Information Technology                                   Department of Information Technology
 St. Francis Institute of technology of Mumbai University               St. Francis Institute of technology of Mumbai University
                        Mumbai, India                                                          Mumbai, India

  Abstract—Bitcoin, a type of cryptocurrency is currently               that Bitcoin is the world’s most valuable cryptocurrency
 a thriving open-source community and payment network,                  and is traded on over 40 exchanges worldwide accepting
 which is currently used by millions of people. As the value            over 30 different currencies The study in the paper [4]
 of Bitcoin varies everyday, it would be very interesting
 for investors to forecast the Bitcoin value but at the same            reveals that the authors have executed the result of
 time making it difficult to predict. Bitcoin is a                      Bayesian Neural Networks (BNNs) by analyzing the time
 cryptocurrency technology that has attracted investors                 series of Bitcoin process. The paper [5] proposes that the
 because of its big price increases. This has led to                    model for prediction of time series data based on the
 researchers applying various methods to predict Bitcoin                concept of sliding window using Artificial           Neural
 prices such as Support Vector Machines, Multilayer                     Network (ANN) technique which is Radial Basis
 Perceptron, RNN etc. To obtain accuracy and efficiency
 as compared to these algorithms this research paper tends
                                                                        Function      Network      (RBFN).      It depicts certain
 to exhibit the use of RNN using LSTM model to predict the              limitations such introduction of hybrid or ensemble
 price of cryptocurrency. The results were computed by                  techniques with new features. The paper [6] attempts to
 extrapolating graphs along with the Root Mean Square                   identify and understand daily trends in Bitcoin market by
 Error of the model which was found to be 3.38.                         gathering optimal features surrounding Bitcoin prices and
                                                                        plot a graph using normalization. The authors of the work
 Keywords—Recurrent-Neural-Network (RNN), Long-
 Short- Term-Memory (LSTM), Deep Learning, Bitcoins.
                                                                        [7], use rolling window Long Short- Term Memory
                                                                        (LSTM) model to predict Bitcoin price by selecting
                                                                        the input features such as macroeconomics, global
                                                                        currency ratios, and block chain information. In the
                       I.   INTRODUCTION
                                                                        work [8], the authors explore Neural Network ensemble
The Bitcoin is a highly cryptic and virtual currency used               approach called Genetic Algorithm based Selective
by many investors throughout the world. Satoshi                         Neural      Network Ensemble by using back tracking
Nakamoto was the inventor of Bitcoins in 2009[1]. Thus,                 strategy where the author suggested that some input
Bitcoin is a blockchain         based      currency      that           information might be missing as more processing of the
encompasses a public records of all the transactions                    data was required. The authors of [9] establish a study
performed under monitoring. Many researchers have                       of      Binomial      Classification algorithms such as
worked in this field to predict and analyze the trends                  Generalized Linear Model (GLM), SVM and Random
and patterns of the Bitcoin prices. Initially, with very less           Forest. The authors suggest that K-means is a bulbous
data and limited scope in algorithms and tools the                      scope. The work done in paper [10] aims on calculating
accurate representation and factual prediction of values                quantitative gradation and predict values using hand
was difficult but with the advancements in technology                   designed features or technical pointers. The research
and higher scopes in domains like machine learning                      work as proposed in [11] makes use of multivariate linear
and deep learning researchers have been keen on                         regression to predict highest and lowest price of
developing models that can provide an insight to the                    cryptocurrencies by using features like open, low and
estimation of monetary values. A literature survey that                 close. The research work presented in [12] attempts to
consisted of some prominent work in the respective                      predict the Bitcoin price precisely taking into
domain provided quite notable results. There is high                    consideration various constraints that affect the Bitcoin
volatility in the market, and this provides an opportunity              value. For principal phase of the analysis, it aims to know
in terms of prediction as mentioned in [1]. The writer of               and identify day-to-day fashions within the Bitcoin
[2] proposes a solution to double spending problem using                marketplace while gaining perception into best features
peer to peer distributed server. The authors of [3] assert

Volume 9, Issue 3                                     Published by, www.ijert.org                                               387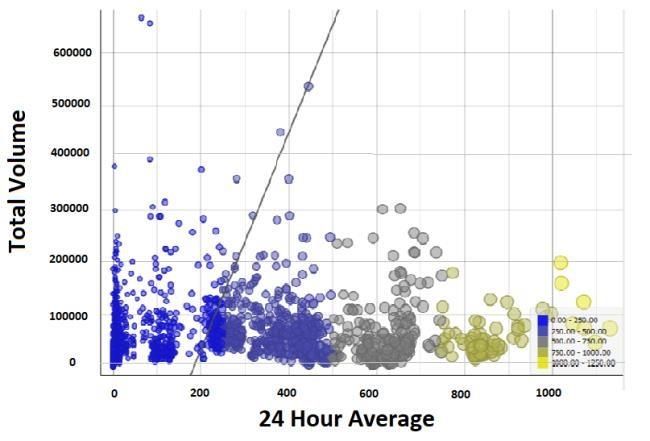
Special Issue - 2021 International Journal of Engineering Research & Technology (IJERT)
ISSN: 2278-0181
NTASU - 2020 Conference Proceedings
surrounding Bitcoin price. It m v akes use of Recurrent by creating data frames for training set. Hence, taking this
neural networks and LSTM comparison ARIMA model. into consideration LSTM is implemented in our thesis.
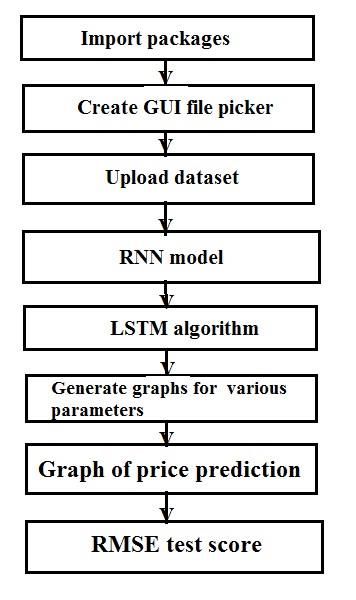
This proposed work tends to exhibit the use of III. PROPOSED METHODOLOGY
Recurrent
Neural Network (RNN) model using Long Short-Term This proposed method as shown in the Figure.1. depicts
Memory (LSTM) regression algorithm on the acquired the use of Recurrent Neural Network which uses the
Cryptocurrency dataset for predicting the prices of Long Short-Term Memory algorithms. This proposed
cryptocurrency (Bitcoin) by analyzing the dataset method begins with A. visualizing and analyzing the
and applying deep learning algorithms. Thus, for this bitcoin dataset followed by B. implementation of RNN
research the dataset used consists of various parameters model using LSTM algorithm in this model.
of Bitcoins data values . The goal of this research is
to design a model that will consistently be able to predict
the price of Bitcoin. Predicting the exact price is very
hard. Therefore, we simplify the problem; we only try to
predict whether the price will increase, decrease or
stay the same within certain thresholds. The
prediction analysis would be carried out based on the
resultant values from the given algorithms. The
objectives of proposed model is to create model that leads
to the Bitcoin price prediction accuracy by incorporating
RNN elements.
The brief description of various sections provides an
insight that integrates the flow of this work. The
second section represents various related works under this
domain. The third section provides a generalized
methodology used in this work. The fourth section gives
an understanding of the proposed methodology which Figure .1. Work flow of the proposed model
we have undertaken to accomplish our objectives.
The results and observations constitute of the fifth A. Data Visualization of Bitcoin dataset
section. The sixth section conforms the conclusions and The data used here is obtained from Kaggle because it
future scope. The seventh and the final section enlists presents
all the references used to assimilate our theories. Bitcoin exchanges from the time period of January 2014 to
January 2019 . It provides minuscule updates of the
II. RELATED WORK bitcoin exchange considering attributes like Open, High,
Low, close, Volume, currency, and weighted Bitcoin
Various data scientists and researchers have worked to find
price. Unix timestamps are available for the same.
out the prediction of the price of cryptocurrency by the
Data visualization is done using the Orange Tool. It helps
means of different algorithms and approaches. The work
to understand and analyze the data set and different
proposed in [4] makes use of Bayesian Neural Networks
patterns and trends that can help to incorporate various
(BNNs) by analyzing the time series of Bitcoin process
algorithms to predict and perform various operations. The
which describes fluctuation in a timeseries format. The
initial working can be shown in Figure .2. where the
authors suggest the use of different machine learning
visualization toolset is available at the left corner with
algorithms to improve variability which the authors fails to
different options to visualize the data. First the dataset file
sustain. The work presented in [7] aims to analyses a
is selected which has to be visualized. Then by selecting
timeseries data of bitcoin prices by using various variables.
scatter plot and distribution function from the toolset it is
The authors suggest the scope that the time series data can
connected to the datafile.
be modeled by predicating price of the bitcoins using
LSTM algorithm. It gives an insight about the backend
processing of bitcoins followed by the use of a rolling
window LSTM and empirical study for price prediction.
The research work exhibited in [11] makes use of
Multivariate Linear Regression to predict highest and
lowest price of cryptocurrencies by using features like
open, low and close. According to the authors of [11], this
work fails to provide enough information for long term
analysis. Therefore, the authors of this work propose a
scope of using LSTM to analyze various cryptocurrencies
Volume 9, Issue 3 Published by, www.ijert.org 388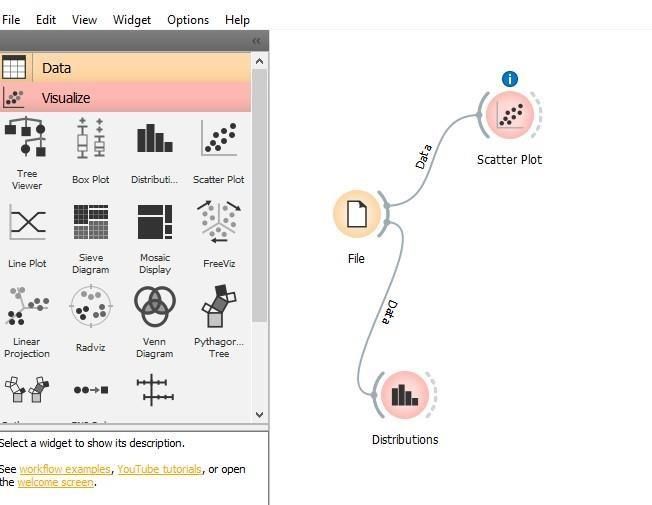
Special Issue - 2021 International Journal of Engineering Research & Technology (IJERT)
ISSN: 2278-0181
NTASU - 2020 Conference Proceedings
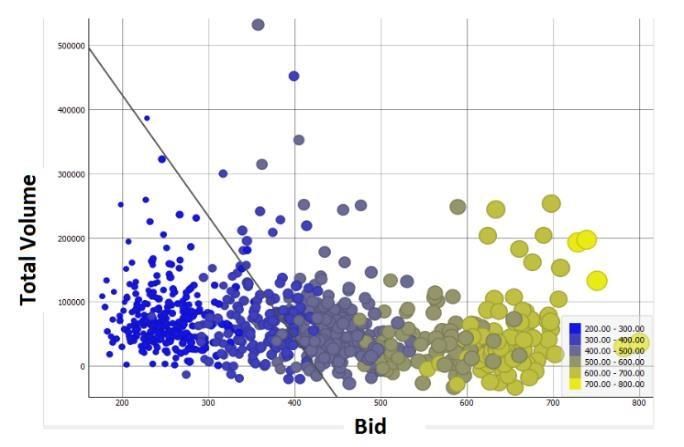
Figure .4. Plot of total volume with respect to the value been bided of
the Bitcoins data
Figure 2. Data Visualization of the Bitcoin dataset
The linear plot as seen in the Figure.5. shows that the last
amount at which the Bitcoin was bided on the Y-Axis is
The graph in the Figure .3. depicts the clusters made by almost similar to the average data collected over the 24
the total volume of Bitcoin traded on the Y-Axis over the Hour that was referenced on the X-Axis. This shows the
average data collected in the span of 24 hours in dollars on similarity between the two quantities.
the X-Axis. It is evidently visible that between the range
200 to 600 the clusters appear to be dense.
Figure .5. Last price of Bitcoin bided with respect to the average
of data collected over 24 hours
Figure 3. Total volume with respect to average data collected
over 24 hours The Figure .6. shows that frequency on the Y-Axis of all
the last value of Bitcoins bided on the X-Axis was
The graph in the Figure .4. depicts the clusters made by the computed. Along with this, the standard deviation of 388
total volume of Bitcoin traded on the Y-Axis over the data and variance of 135.57. The frequency of the last value is
been bided in dollars on the X-Axis. It can be observed that observed to be highest at 240 dollars with a frequency
between the range 200 to 650 the clusters appear to have greater than 140
the highest bids. We can see that for a bid of 250 to 300
dollars the Total Volume was the highest.
Predicting price of cryptocurrency- A deep learning
approach
Figure .6. Frequency of last value bided values of
Volume 9, Issue 3 Published by, www.ijert.org 389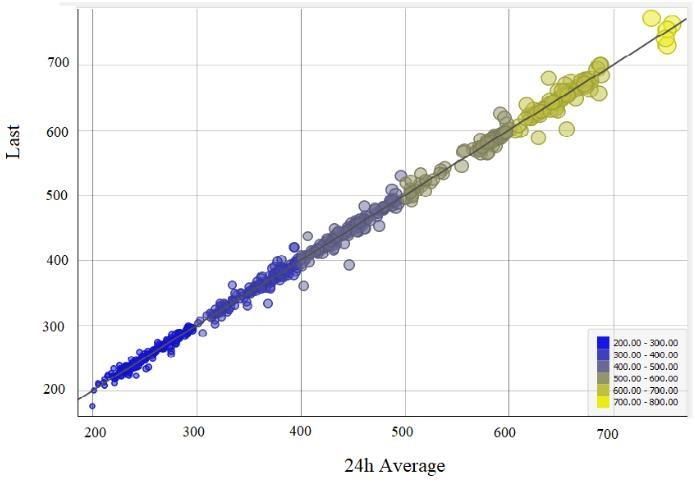
Special Issue - 2021 International Journal of Engineering Research & Technology (IJERT)
ISSN: 2278-0181
NTASU - 2020 Conference Proceedings
Bitcoins
The frequency of the total volume bided was calculated to
find the greatest and the least volume for the given data set
as shown in Figure .7 The standard deviation and variance
were calculated for the same. The X-axis represents the total
volume whereas the Y- Axis represents the frequency for
each value of the volume. The highest frequency was
greater than 500 with a mean of 57501 and standard
deviation of 55035
Figure .8. Process Flow Chart
Figure 7. Frequency of total volume bided
B. Implementation of RNN algorithm using LSTM
First, the dataset is obtained for USD out of all other
country’s currencies. Secondly, the data has to be matched
The flow of the working process is described in Figure
and parsed by timestamp date. Thirdly, the data type
8. Initially, the bitcoin data is retrieved from data sources
was changed to remove inconsistencies by converting
available online such as Kaggle. This data consists of
the data to proper format. After that, the parts of data set
various bitcoin attributes such as high, low, open, volume,
with null values is removed. Finally, the data will be split
timestamp etc. Out of these attributes the total volume
in a train and test set and the data will be ready for machine
exchanges and timestamp are used for the prediction
learning to train a model with. The data is split in a train
process in this model. Next, the deep learning
set, validation set, and test set based on various
environment is set up. . After the data has been retrieved,
parameters. The distinction considered for testing part
some modification needs to be done before deep
was the last 30 rows of the dataset whereas for training the
learning can be applied such as converting into proper
rest of the dataset was used so that better training can take
format and type.
place.
The train set is the first part of the data, the validation
set is the second part of the data and the test set is the last
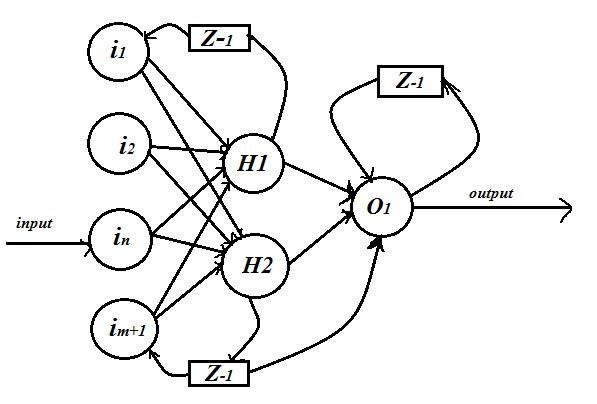
part of the data. Further, RNN model is used for the
complete computation of the price prediction.
Recurrent Neural Networks (RNNs) are a collection of
deep learning methods, which has become a widely
used method for extracting patterns from temporal
sequences [7], making it possibly effective for predicting
time series like the Bitcoin price trend. The Figure .9.
referenced from the work [3] shows the block flow of how
an RNN functions like.
Volume 9, Issue 3 Published by, www.ijert.org 390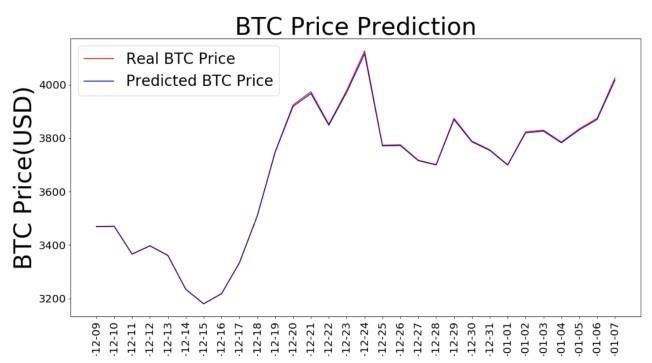
Special Issue - 2021                                           International Journal of Engineering Research & Technology (IJERT)
                                                                                                                  ISSN: 2278-0181
                                                                                             NTASU - 2020 Conference Proceedings

                                                                      even information from the earlier can be used later thus
                                                                      eliminating the use of short-term memory. The resultant
                                                                      was used to predict the training and testing score and root
                                                                      mean square error. Thus, graph for the same was plotted.
                                                                      For ease of user manifestation, a GUI file picker was
                                                                      created.

                                                                         IV. RESULTS AND OBSERVATIONS

                                                                      A JavaScript code for a GUI file picker was used for the
                                                                      ease of data selection by users as shown in Figure 11.
                                                                      This also allows users to use different data files in .csv
                                                                      format thus increasing the scope of the project by not
                                                                      limiting to a particular dataset.

          Figure 9. Recurrent Neural Network

An RNN is actually an ANN prepared with historical but
temporal memory, as it takes a sequence as input. For
deep learning models, parameters are chosen with the
help of some options available such as heuristic search
model like genetic method and grid search, data pre-
process stage is carried out to train the data and reshape
into three dimensional arrays. Lastly, after reshaping the
data it is finally fed to the LSTM regression model. This
model consists of 2 hidden layers that
are used for better computation and performance. Long
Short-Term Memory networks can learn long-term                                 Figure 11. GUI For dataset selection
dependencies. Thus, these networks can remember
information for long periods of time by default. An                     Figure .12. shows that the X-Axis represents the dates
architectural flow of an LSTM model is shown in the                   from 2015 to 2019 and Y-Axis represents the mean USD
Figure .10. which is referenced from the work proposed by             Dollars, and the exchange between these quantities shows
author of [9]                                                         that January 2018 had the highest exchange of Bitcoins

   .

                                                                             Fig.12. Bitcoin exchanges mean USD by days
                                                                         The Bitcoin exchange over the month with respect to
          Figure .10. Long Short-Term Memory                          mean USD Dollars is represented as given in the graph
                                                                      shown in Figure .13. The highest mean of USD exchange
                                                                      was observed in January
   Recurrent Neural Networks have chains of repetitive                  Predicting price of cryptocurrency- A deep learning
iterating modules of neural network. In standard RNNs,                 approach
these modules are a simple connection of network layers.
LSTM’s have the cell state, and different gates. The cell is
used to transfer information throughout the sequence also
known as memory of the network This information is
remembered by the memory in long term dependencies. So

Volume 9, Issue 3                                    Published by, www.ijert.org                                              391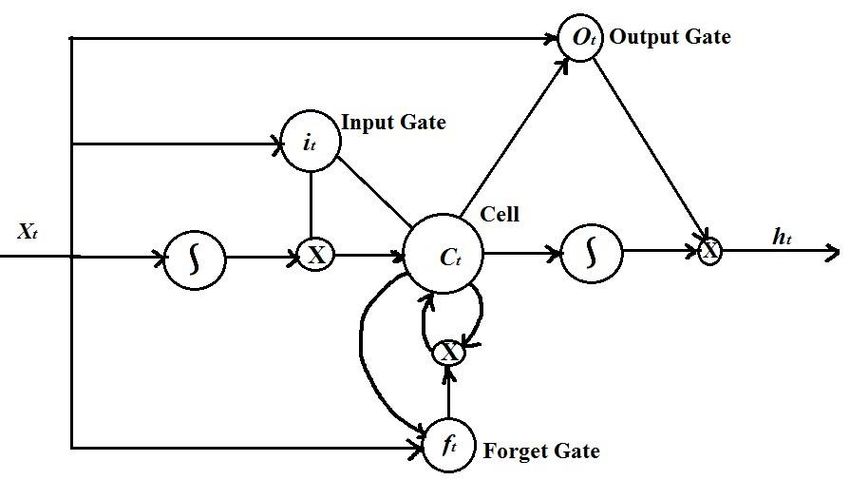
Special Issue - 2021                                         International Journal of Engineering Research & Technology (IJERT)
                                                                                                                ISSN: 2278-0181
                                                                                           NTASU - 2020 Conference Proceedings

                                                                    csv file. It gives the predicted line graph with respect to
                                                                    the actual line graph of the values

         Fig.13. Bitcoin exchanges mean USD by months
 The Bitcoin exchange over the mean USD by Quarters is
 shown in the graph in Figure .14. The quarters between                         Figure 16. Graph Output for Price Prediction
 January 2018 to January 2019 showed the largest                     The red line represents the actual value of the Bitcoin
 exchange of Bitcoins                                                price whereas the blue line of the Bitcoin data represents
                                                                     the predicted value. It is very evidently observed that the
                                                                     difference between the actual and predicted vale is very
                                                                     minute. With every epoch and different ratios of datasets
                                                                     different variations of the graph can be extrapolated. The
                                                                     Root Mean Square Error (RMSE) calculated was 3.3% of
                                                                     the Testing data set.

                                                                             V. CONCLUSION AND FUTURE WORK
                                                                     The optimized implementation of RNN using LSTM for
                                                                     real time datasets and models was studied. The use
                                                                     of deep learning and its usage to real time problem of
                                                                     crypto currency price prediction was performed. The
    Fig.14. Bitcoin exchanges Mean USD By Quarters                   implementations of the data preprocessing and filtering
                                                                     to give precise, sound and consistent data was executed
The Bitcoin exchange graph from mean USD as per                      successfully by creating a GUI File Picker for ease of
different years is shown in the Figure .15. Out of all the           users and greater scope. The usage of RNN using LSTM
years considered the span between 2018 and 2019 has the              algorithm was done effectively. The accurate
highest exchange of Bitcoins over the past four years.               representation of the system design along with the
                                                                     precise threshold outputs at the display unit was done.
                                                                     The results were noted, and outputs were recorded by
                                                                     plotting a graph. The RMSE Test Score value was
                                                                     computed as 3.38. The proposed model further would
                                                                     have advancements in terms of design and functionality.
                                                                     A sentimental analysis using twitter dataset is a
                                                                     prominent scope. Along with this, more complex and
                                                                     advanced algorithms supporting high level neural
                                                                     networks can be used. On comparison with other
                                                                     reviewed papers in the literature survey the difference
                                                                     between this calculated RMSE value of the test score
                                                                     was computed as shown in TABLE I.
                                                                             TABLE I. COMPARISON OF RMSE OF TRAINING
                                                                                             AND TESTING PHASE
      Fig. 15. Bitcoin exchange as per mean USD by                      Reference              ROOT MEAN SQUARE ERROR
                                                                        Number        Error of reference   Error of our paper
                           Years
                                                                                           papers
In the Figure .16. the X-Axis of the graph represents the                  [3]           Test: 8.07            Test:3.38
price is USD The Y-Axis on the graph represents the                                         Test:             Test:3.38
                                                                           [4]
                                                                                            0.23
timestamp dates of the data generated as per the dataset
                                                                           [5]              Test:9.1           Test:3.38

Volume 9, Issue 3                                  Published by, www.ijert.org                                                  392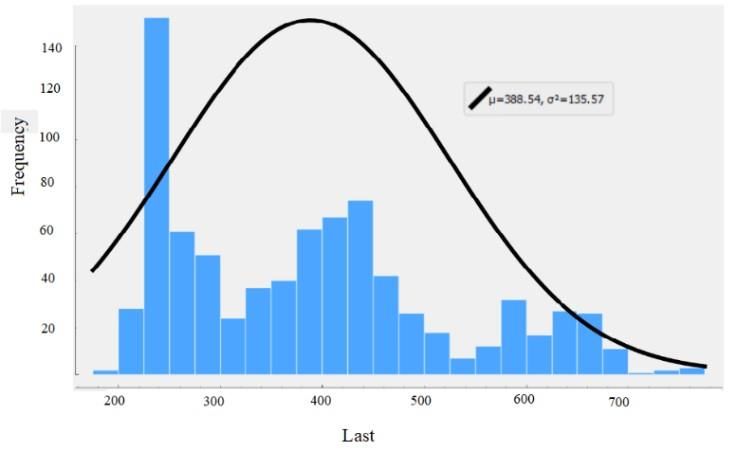
Special Issue - 2021                                                          International Journal of Engineering Research & Technology (IJERT)
                                                                                                                                 ISSN: 2278-0181
                                                                                                            NTASU - 2020 Conference Proceedings

                          VI. REFERENCES                                              [7]    Jang Huisu,Jaewook Lee,Hyungjin Ko,Woojin Le, aPredicting
                                                                                             Bitcoin price using Rolling Window LSTM modela             ,DSF,
 [1]   M. Briaere, K. Oosterlinck, and A. Szafarz,Virtual currency,                          ACM         ISBN      123-4567-24-      ˆ567/08/06,vol.4,pp.550-
       tangible return: Port- folio diversification with Bitcoins, Tangible                  580,2018.
       Return: Portfolio Diversification with Bitcoins , 2013.                        [8]    Sin, Edwin & Wang, Lipo. (2017). Bitcoin price prediction using
 [2]   S. Nakamoto, ”Bitcoin: A Peer-to-Peer Electronic Cash System”,                        ensembles         of       neural      networks.        666-671.
       Available at: https://Bitcoin.org/Bitcoin.Accessed on 2008.                           10.1109/FSKD.2017.8393351.
 [3]   McNally, Sean & Roche, Jason & Caton, Simon. (2018).                           [9]    Isaac Madan, Shaurya Saluja, Aojia Zhao, Automated Bitcoin
       Predicting the Price of Bitcoin Using Machine Learning. 339343.                       Trading via Machine Learning Algorithms, Stanford:Department
       10.1109/PDP2018.2018.00060.                                                           of Computer Science, Stanford University, 2015.
 [4]   H. Jang and J. Lee, "An Empirical Study on Modeling and                        [10]   John Mern1; Spenser Anderson1 ; John Poothokaran1 ,a Using
       Prediction of Bitcoin Prices With Bayesian Neural Networks                            Bitcoin Ledger Network Data to Predict the Price of Bitcoin
       Based on Blockchain Information," in IEEE Access, vol. 6, pp.                  [11]   Ruchi Mittal;Shefali Arora;M.P.S Bhatia; “Automated
       5427-5437, 2018                                                                       cryptocurrencies price prediction using machine learning”
 [5]   Hota HS, Handa R & Shrivas AK, “Time Series Data Prediction                           a,ICTACT JOURNAL ON SOFT COMPUTING, VOLUME: 08,
       Using Sliding Window Based RBF Neural                     Network”,                   ISSUE: ˆ04 JULY, 2018
       International Journal of Computational Intelligence Research,                  [12]   Amin Azari,a Bitcoin Price Prediction: An ARIMA Approach ˆ
       Vol.13, No.5, (2017), pp.1145-1156                                                    a,Available                                                   at:
 [6]   Siddhi Velankar,Sakshi,Valecha,Shreya Maji, aBitcoin Price                            https://www.researchgate.net/publication/328288986, 2018
       Prediction                       using                      Machine            [13]   http://wp.firrm.de/index.php/2018/04/13/building-a-lstm-
       Learninga,20thInternational       Conference       on     Advanced                    network-completely-from-scratch-no-libraries/
       Communication                 Technology(ICACT)on,vol.5,pp.855-
       890,2018

Volume 9, Issue 3                                               Published by, www.ijert.org                                                              393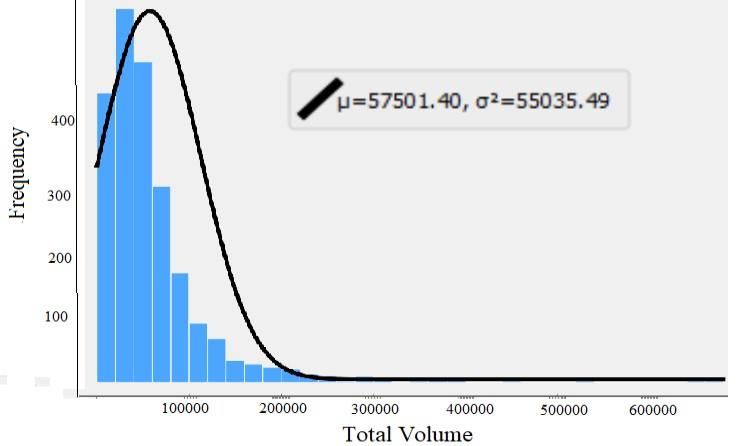
You can also read