Technical Advisory Cell Summary of advice - 8 January 2021
←
→
Page content transcription
If your browser does not render page correctly, please read the page content below

Technical Advisory Cell

Summary of advice
8 January 2021

 © Crown copyright 2020
TAC ADVICE ONLY NOT WELSH GOVERNMENT POLICY
Technical Advisory Cell: Summary Brief
8 January 2021
Top-line summary
The most recent estimate of the Reproduction number (Rt) for Wales from SAGE
(as of 6 January) is predicted to be between 0.8 and 1.1. This is the official
estimate of the Rt number for Wales based on data available up until 4 January.
SAGE estimates that the epidemic is shrinking/growing by between -4% and 1%
per day.
Based on case numbers only, Public Health Wales estimates Rt to be between
1.06 and 1.08 (as of 1 January) and halving time to be 68 days (as at 5 January).
These estimates have improved since the last report (23 December 2020),
however there is greater uncertainty due to changes and disruption over the
festive period, as well as the impact of the new variant which may not be fully
accounted for.
As at 11 January, test positivity for Wales (rolling 7 days) is 20.6%, which remains
high and above the red circuit breaker. Positivity is particularly high in the North
Wales areas of Wrexham (29.7%), Flintshire (25.9%), and Bridgend (28.1%) in
South Wales.
The ONS infection survey data for the most recent week (27 December 2020 to
2 January 2021) shows that an estimated 1 in 70 people had COVID-19. This has
shown a decrease after increasing sharply and peaking shortly before Christmas.
It is important to stress the uncertainty around these figures since the survey
picks up relatively few positive tests overall. Because of the lag between people
acquiring COVID-19 and testing positive, it is likely that any impact of the
Christmas and New Year period on rates testing positive will not be fully evident
until the second week of January.
There have been increasing detections of VOC 202012/01 (detected using the
proxy of S-Gene Target Failure viruses) throughout December and early
January, with the variant confirmed across all regions of Wales.
Analysis of contact tracing data from Public Health England shows that
secondary attack rates (the probability that an infection occurs among
susceptible people within a specific group, such as the household or close
contacts) are higher where the index case has the new variant strain. This
corresponds with other findings which indicate increased transmissibility of the
new variant.
Page 2 of 17
TAC ADVICE ONLY NOT WELSH GOVERNMENT POLICY
As at 6 January, the proportion of calls to NHS 111 and NHS Direct related to
possible COVID-19 symptoms remained stable compared to the previous week.
GP consultations for any Acute Respiratory Infection (ARI) have decreased
whilst GP consultations for suspected COVID have increased compared to the
previous week. The number of ambulance calls possibly related to COVID-19
have decreased in the most recent week.
As of 8 January, the number of people with confirmed COVID-19 in hospital has
remained above the April peak and has continued to increase. Overall ICU
occupancy (COVID-19 and non-COVID-19 patients) indicates that ICU is at, or
close to, 100% occupied, with a 1:1 staffing ratio for ICU patients not possible
across Wales.
While data should be treated with caution due to the festive holiday period,
deaths reported by Public Health Wales (as of 6 January) and the Office for
National statistics (week ending 1 January) have continued to show an upward
trend since our last report.
As at week ending 3 January, a total of 49,428 doses of COVID-19 vaccine (25
of which were second dose) were given in Wales. The actual number of doses
will be higher due to ongoing data entry.
It takes 2-3 weeks for a vaccine to induce an immune response, which means
vaccinated people could still become infected during this time and there will be a
lag of around four weeks before the benefits of vaccines in preventing hospital
admissions will be seen, and longer for deaths.
Mobility data shows large reductions in movement, but mainly after the 24 of
December. Compared to the firebreak period, the first four days of alert level 4
restrictions did not see mobility reduce as much. On the 25/26 December 2020
mobility was particularly low. Since Monday January 4 mobility looks to be in line
with that seen during the firebreak period – with levels somewhere between the
first (when schools were fully closed during half term) and second week. Further
data expected this week will give further clarity to mobility levels in the first full
week of this year. New adherence data will be available to report within the next
two weeks.
The Technical Advisory Group published advice on the variant of concern and
education in Wales, noting that with the new COVID-19 variant becoming
dominant and the current prevalence and test positivity rates, current non-
pharmaceutical intervention measures, with primary or secondary schools open
Page 3 of 17
TAC ADVICE ONLY NOT WELSH GOVERNMENT POLICY
fully, would be unlikely to be sufficient to maintain Rt below 1 and that Rt would
be lower with schools closed due to reduced social mixing.
Papers from SAGE considered by the Technical Advisory Cell are published
here, including the paper ‘Mitigations to Reduce Transmission of the new variant
SARS-CoV-2 virus’ from three SAGE sub-groups (the Scientific Pandemic
Influenza Group on Behaviours, the Environmental and Modelling Group, and
Transmission Group). This paper highlights:
o The importance of reinforcing adherence to existing mitigation measures in
light of the new variant, recommending encouraging adherence to non-
pharmaceutical interventions through a combination of recognising
population efforts to date, providing a clear rationale for actions, creating
acceptable solutions where risk is hard to avoid, provision of support and
culturally appropriate communications.
o There is high confidence that the new variant requires the previously identified
personal, procedural, engineering and societal mitigations to reduce
transmission, but a step change in rigour of application is likely needed given
that the new variant is likely to represent a significantly increased
transmission risk.
Growth rate and Reproduction number
It is important to note that the following estimates cannot yet fully reflect the most
recent changes in transmission from the past two to three weeks. This is because
there is a delay between initial infection, developing symptoms and the need for
hospital care and the time of death.
The current daily growth rate estimated by SAGE (as of 6 January) is between -
0.04 and 0.01 (90% confidence interval) in Wales, indicating that infections could
be shrinking/growing by between -4% and +1% per day.
The most recent estimate of the Reproduction number (Rt) for Wales from SAGE
(as of 6 January) is predicted to be between 0.8 and 1.1 (90% confidence
interval). The estimate of Rt is shown as a range without a central estimate.
Public Health Wales also estimate Rt for Wales using data on the number of
positive cases. These estimates should be interpreted with caution as they may
be effected by changes in testing patterns over the holidays. As of 1 January, Rt
in Wales is estimated to be between 1.06 and 1.08 (95% confidence interval).
Page 4 of 17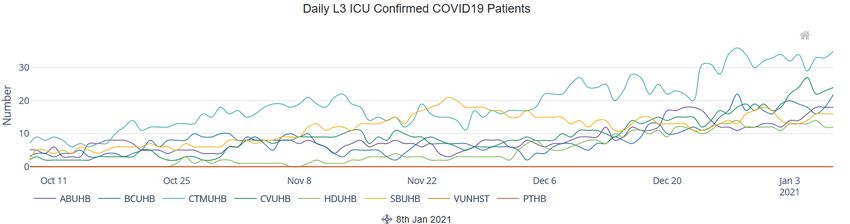
TAC ADVICE ONLY NOT WELSH GOVERNMENT POLICY
Care should still be taken when interpreting Rt and growth rate estimates for the
UK, due to their inherently lagged nature, testing availability and, as these figures
mask variation in the number of infections, how rates of transmission are
changing in some parts of the country.
A growth rate that is lower but still positive, or an Rt number above 1, indicates
that the epidemic is growing exponentially.
Estimates should be interpreted with caution and the confidence intervals taken
into account.
Halving time
As at 5 January, Public Health Wales estimated the halving time (the time it
takes for the number of cases to half) to be 68.0 days (95% confidence interval
9.3 to -12.8) using data from 19/12/2020 to 01/01/2020 (see Figure below).
Halving time (and Rt and growth rates), gives an indication of the rate of change
and therefore it should be treated with caution for the reasons outlined above.
International update
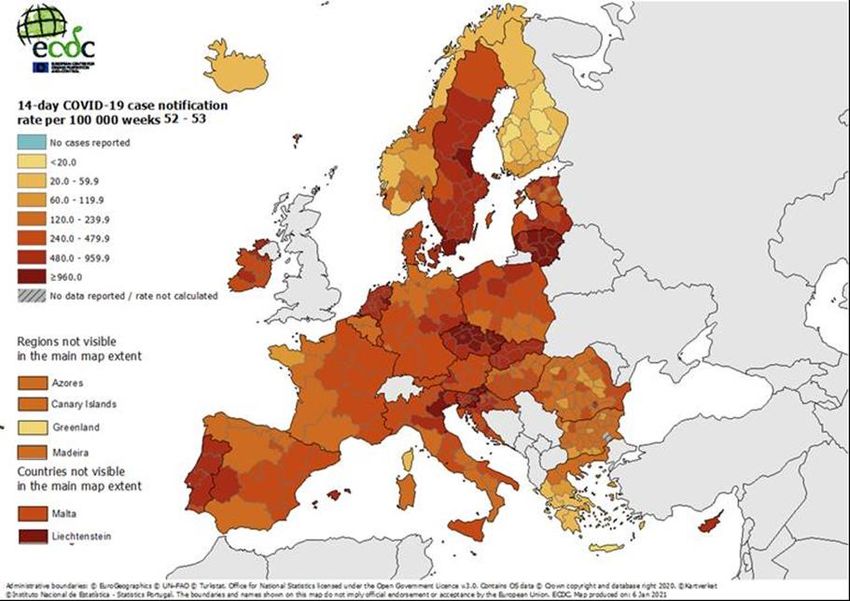
The map below shows the 14-day average notification rate per 100,000 people
in the EU for weeks 52 – 53.
The UK is not included in the ECDC map below due to Brexit.
The very recent general situation is improving across much of Europe but there
are still some countries experiencing rises in infection rates. In detail:
Page 5 of 17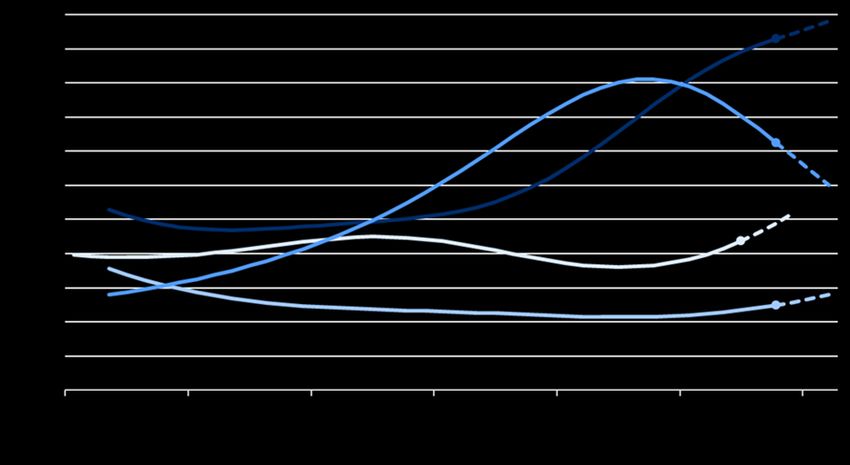
TAC ADVICE ONLY NOT WELSH GOVERNMENT POLICY
Countries where incidence is falling include: Australia, Belgium, Bulgaria,
Croatia, Denmark, Finland, France, Germany, Greece, Hungary, Italy,
Netherlands, Poland, Portugal and Romania.
Countries which have a steady state infection rate or at the high point and about
to descend include: Sweden, Spain, Lithuania, Estonia, Latvia, Slovenia.
Countries that are experience rises include: Czechia, Slovakia, Norway and
Ireland.
Elsewhere, many countries in South America are experiencing rises in cases
despite it being summer in the southern hemisphere, likely due to the festive
period. South Africa is experiencing a rapid rise, likely due to their new variant
which, like the UK variant, is more infectious.
Data on the picture across Europe, including caveats around data lags and
variable testing policies is available here.
ONS infection study results
The ONS infection survey data for the most recent week (27 December 2020 to
2 January 2021) shows that the positivity rate in Wales decreased, after
increasing sharply and peaking shortly before Christmas. See here for the
previous week’s results (12 to 18 December 2020) which estimated that around
1 in 60 people had COVID-19, compared to an estimated 1 in 70 for the most
recent week.
These data are helpful because they are the only estimates of infection covering
asymptomatic as well as symptomatic cases, and they are not affected by other
factors such as testing capacity or the number of people coming forward for
testing. The results are for private households only – the ‘community population’
– and do not apply to those in hospitals, care homes or other institutional settings.
The Figure below shows the latest estimates for positivity rates (%) since 22
November 2020* across the 4 UK Nations.
There is some uncertainty around the individual point estimates for the nations.
Estimates for the last few days of the series, shown as dashed lines in the chart
below, have more uncertainty.
Page 6 of 17TAC ADVICE ONLY NOT WELSH GOVERNMENT POLICY
Source: Coronavirus (COVID-19) Infection Survey, ONS, 06/01/21
*Data for Scotland goes up to 31 December 2020 instead of 02 January 2021
due to bank holidays.
For the week 27 December 2020 to 02 January 2021, an average of 1.45% of
the community population had COVID-19 (95% credible interval: 1.11% to
1.85%).
This equates to approximately 1 person in every 70 (95% credible interval: 1 in
90 to 1 in 55), or 44,100 people during this time (95% credible interval: 33,700 to
56,300).
The positivity rate has decreased in the most recent week, after peaking shortly
before Christmas.
Analysis of the new and other variants of the coronavirus indicates that the trend
in Wales has been driven by the other variants. Cases compatible with the new
variant are relatively low. Please note that there is a greater lag in data from the
infection survey than from other sources such as Public Health Wales.
Because of the lag between people acquiring COVID-19 and testing positive, it
is likely that any impact of the Christmas and New Year period on rates testing
positive will not be fully evident until the second week of January.
It is important to stress the uncertainty around these figures. Since the survey
picks up relatively few positive tests overall, the results can be sensitive to small
changes in the number of these positive tests.
Full results are published here.
Page 7 of 17TAC ADVICE ONLY NOT WELSH GOVERNMENT POLICY
Case numbers
The figure below shows that numbers of confirmed COVID-19 cases per day (7
day rolling sum, per 100,000 of the population). Cases showed a reduction
following a peak in mid-December. An increase in cases has been seen during
the last week of 2021. Please use caution in interpreting trends for the most
recent period as testing patterns may have altered over the Christmas
period.
Source: Data from Public Health Wales as of 6 January
Age profile
The Figure below shows the number of confirmed COVID-19 episodes per
100,000 population, by week of sample collection and age group.
According to Public Health Wales, as at 6 January, incidence increased
in most age groups following a decrease in the previous week, with incidence
being highest in those ages 18-44 years.
Source: Welsh Government dashboard, data from Public Health Wales as at 3 January.
Page 8 of 17TAC ADVICE ONLY NOT WELSH GOVERNMENT POLICY
Vaccination in Wales
As at week ending 3 January 2021, a total of 49,428 doses of COVID-19 vaccine
(25 of which were second dose) were given in Wales.
This number includes 1,024 people who received their vaccination in Wales, but
were resident outside of Wales.
The actual number of doses will be higher due to ongoing data entry.
Deaths
The Figure below shows the 7 day rolling sum of COVID-19 deaths reported by
Public Health Wales as at 6 January 2021, showing an increasing trend recently.
Source: Welsh Government dashboard, data from Public Health Wales as at 6 January.
It is important to note that this data includes reports of a death of a hospitalised
patients in Welsh hospitals or care homes where COVID-19 has been confirmed
with a positive laboratory test and the clinician suspects COVID-19 was a factor
that caused death. It does not include patients who may have died from COVID-
19 but who were not confirmed by laboratory testing, those who died in other
settings, or Welsh residents who died outside of Wales. The true number of
deaths will be higher.
The Office for National Statistics (ONS) reports on both suspected and confirmed
COVID-19 deaths using data available on completion of the death registration
process and whilst subject to a time lag, is more complete.
The Figure below shows ONS data of the number of deaths involving COVID-19
registered by week in Wales and the number of all cause deaths registered by
week from 28 December 2019 to 1 January 2021.
Page 9 of 17TAC ADVICE ONLY NOT WELSH GOVERNMENT POLICY
Source data: Office for National Statistics
In Wales, the number of deaths involving COVID-19 increased from 278 (Week
52) to 310 (Week 53) while the total number of deaths in Week 53 was 209 higher
than the five-year average.
The previous weeks contained New Year, Boxing Day and Christmas bank
holidays which would have affected the number of deaths registered. The
trends for the most recent weeks should therefore be interpreted with
caution.
Adherence and understanding of current measures
The following data is collected fortnightly and the newest is from before
Christmas. It is reported here for information; new data will be available to report
within the next two weeks.
The most recent IPSOS MORI data for the period 4-7 December for Wales shows
further reductions in some categories from the last survey. There were reductions
in people making essential trips only and avoiding non-essential travel compared
to two weeks ago. It should be noted that this is self-reported adherence and will
be affected by individuals understanding of the rules and the circumstances that
apply to them.
The figure below represents data collected online by IPSOS MORI as part of a
multi-country survey on the Global Advisor platform. Each of the waves has
Page 10 of 17TAC ADVICE ONLY NOT WELSH GOVERNMENT POLICY
included c.500 respondents in Wales. The sample is broadly representative of
the adult population aged 16-74. Data is weighted to reflect the age and gender
profile of the Welsh population aged 16-74. All samples have a margin of error
around them. For a sample of around 500, this is +/- 4.8 percentage points.
The latest results from the Public Engagement Survey on Health and Wellbeing
during Coronavirus Measures for the period 14 December – 20 December show
that 42% of people say they understand the current restrictions in Wales ‘very
well’. A further 41% reported understanding the restrictions ‘fairly well’. The
results also show that 38% of people said they were following coronavirus
restrictions ‘completely’ and a further 47% reported majority compliance. 31%
reported having people outside their household/permitted extended household
come into their house, whilst 19% reported going into others people’s houses.
Mobility
The mobility data shows large reductions in movement, but mainly after the 24
of December. Compared to the firebreak the first four days of alert level 4
restrictions did not see mobility reduce as much. On the 25/26 December mobility
was particularly low. Both the Facebook and Google residential data show very
high levels of people staying at home on the 25/26, but not as high as in March
when lockdown was first introduced.
The first few days of alert level 4 saw high levels of mobility in supermarkets
(possibly due to increased grocery shopping in the run up to Christmas), but large
Page 11 of 17TAC ADVICE ONLY NOT WELSH GOVERNMENT POLICY
reductions in workplaces (possibly due to people finishing for Christmas and also
closure of a number of businesses under alert level 4). Retail and recreation did
not fall as much as the first few days of the firebreak, this could be due to shops
being able to offer click and collect.
Since Monday January 4 mobility looks to be in line with the firebreak – with
levels somewhere between the first (when schools were closed/half term) and
second week. Further data expected this week will give further clarity to mobility
levels in the first full week of this year.
Mobility of Facebook users in Wales shows movement was 31% below the
baseline for the week to the 8 January. This is up from 43% the week before,
which includes the period over Christmas when mobility was very low. The
percentage of users staying put (near to home) was 36%, lower than the week
before (42%). The baseline is the average value, for the corresponding day of
the week, during the 4-week period 2 February – 29 February 2020.
Apple data for the week to the 8 January shows that requests for driving
directions in Wales are up from the previous week to 66% of the baseline (from
53%). The previous week includes the period over Christmas when mobility was
very low. Requests for walking directions and requests for public transport
directions are up relative to the baseline compared to last week. The baseline is
the 13th of January 2020.
The Google mobility data to the week of the 5 January shows a small reduction
in residential (i.e people spending time at home) compared to the week before at
19% above the baseline (down from 20%). As with the other mobility data, the
previous week includes Christmas when mobility was very low. Workplaces show
an increase (at 53% below the baseline, up from 62%). Retail & recreation shows
a small increase from last week (60% below the baseline, up from 64% the week
before) whilst supermarkets & pharmacy shows an increase (22% below the
baseline, up from 33%). Public transport and parks also show increases
compared to the previous week.
Page 12 of 17TAC ADVICE ONLY NOT WELSH GOVERNMENT POLICY
The figure below shows the change in mobility in Wales using Google mobility
data. The figures are based on the average of the local authorities that have data.
The baseline is the median value, for the corresponding day of the week, during
the 5-week period Jan 3–Feb 6, 2020. The data for several categories is not
available for August 17th – September 10th due to the data not meeting quality
thresholds.
Anonymised and aggregated mobile phone data from O2 for the week to the 1
January shows a decrease in trips compared to the week before. Trips starting
in Wales fell by 14 percentage point to 42% below the baseline. The baseline for
the O2 data is the same day of the week in the first week of March.
Research
There are currently 9757 Welsh patients recruited to COVID-19 urgent public
health studies, an increase of 792 since last report.
COVID-19 weekly surveillance and epidemiological summary from Public Health
Wales
As at 6 January
The proportion of calls to NHS 111 and NHS Direct related to possible COVID-
19 symptoms remained stable compared to the previous week.
Page 13 of 17TAC ADVICE ONLY NOT WELSH GOVERNMENT POLICY
Overall GP consultations for any Acute Respiratory Infection (ARI) have
decreased whilst GP consultations for suspected COVID have increased
compared to the previous week.
The number of ambulance calls possibly related to COVID-19 have decreased in
the most recent week.
The all-Wales number of lab confirmed COVID-19 episodes increased in the
most recent week following a decrease in week 52. Sample positivity was above
23% in week 53.
During week 53, incidence increased in most age groups following a decrease in
week 52, with incidence being highest in those ages 18-44 years.
High numbers of incidents continue to be reported, mainly in residential care
homes.
Most school pupils are currently being taught online, with some face-to-face
learning for vulnerable children and children of critical workers. Schools
surveillance information is available on the Public Health Wales dashboard.
There have been increasing detections of VOC 202012/01 (detected using the
proxy of S-Gene Target Failure viruses) throughout December and early
January. The first detected genomically confirmed VOC confirmed case was in
November and since then the virus has been confirmed in 16/22 local authority
areas across all regions of Wales.
All-cause deaths have increased compared to the 5 year average. Increases in
the number of deaths in confirmed cases in hospital have been seen, however
the overall number of deaths has remained stable compared to the recent weeks.
In deaths where information is available from PHW rapid mortality surveillance,
chronic heart disease, diabetes and chronic respiratory disease are the most
commonly reported risk factors (in 36%, 28% and 22% of deaths respectively).
Influenza and Respiratory Syncytial Virus (RSV) is not currently circulating in
Wales.
The Public Health Wales dashboard is available here and includes local authority
analysis.
Page 14 of 17TAC ADVICE ONLY NOT WELSH GOVERNMENT POLICY
Hospital occupancy
The figure below shows the confirmed COVID-19 hospital occupancy over the
first and second wave of the pandemic (7 day rolling average, as at 8 January
2021).
The Figure below shows the confirmed COVID-19 intensive care unit (ICU)
occupancy over the first and second wave of the pandemic (7 day rolling
average, as at 8 January 2021).
The table below details the overall occupancy of ICU beds across health boards
in Wales as at 8 January 2021, including overall ICU occupancy as a percentage
of the number of beds that it is possible to staff at 1:1 ratio (based on there being
152 available across Wales). The number of confirmed or suspected COVID-19
patients in ICU has increased since last week.
Occupancy figures are based on ICU capacity reported to us by local health
boards. However, once we get beyond around 150 ICU total beds occupied, it
means they cannot be staffed at the 1:1 nursing ratio that is required for Level 3,
and patient care will be affected.
Page 15 of 17TAC ADVICE ONLY NOT WELSH GOVERNMENT POLICY
COVID-19 hospital and ICU occupancy have increased over recent weeks. As of
8 January 2021, 1:1 care for all patients in ICU was not possible in most health
boards, with ICU 138.2% occupied for 1:1 care; see table below.
The Figure below shows the total number of people who have tested Covid-19
positive and are in ICU in hospitals across the different health boards in Wales.
Data as of 8 January 2021.
The Figure below shows the number of people admitted to hospital and are either
suspected or confirmed as having Covid-19. The purple line represents the total
number over a rolling 7 day average, whilst the fainter grey lines show the actual
figures at that time. Data as of 8 January 2021.
Page 16 of 17TAC ADVICE ONLY NOT WELSH GOVERNMENT POLICY
The Figure below shows the number of hospital discharges of people who are
either suspected or confirmed as having Covid-19. The purple line represents the
total number over a rolling 7 day average, whilst the fainter grey lines show the
actual figures at that time. Data as of 8 January 2021.
The Figure below shows patients admitted to the intensive care units and are
either suspected or confirmed as having Covid-19. The purple line represents the
total number over a rolling 7 day average, whilst the fainter grey lines show the
actual figures at that time. Data as of 8 January 2021.
Professional Head of Intelligence Assessment (PHIA) probability yardstick
Where appropriate, TAC advice will express Likelihood or confidence in the advice
provided using the PHIA probability yardstick to ensure consistency across the different
elements of advice.
Page 17 of 17You can also read