Technical Advisory Cell Summary of advice - 15 February 2021 - GOV.WALES
←
→
Page content transcription
If your browser does not render page correctly, please read the page content below
Technical Advisory Cell

Summary of advice
15 February 2021

 © Crown copyright 2020
TAC ADVICE ONLY NOT WELSH GOVERNMENT POLICY
Technical Advisory Cell: Summary Brief
15 February 2021
Top-line summary
The most recent estimate of the Reproduction number (Rt) for Wales from SAGE
between 0.7 and 0.9. In line with testing data, the Office for National Statistics
(ONS) Covid-19 infection survey indicates that the positivity rate in Wales has
decreased in the most recent week. The restrictions in place in Wales and the
good adherence to them is continuing to reduce the size of the Covid-19
epidemic in Wales (high confidence).
NERVTAG agrees that it is likely that infection with B.1.1.7 (the variant of concern
first identified in Kent) is associated with increased risk of hospitalisation and
death. The absolute risk of death per infection remains low.
Provisional ONS analysis has shown that people testing positive compatible with
the new UK variant show an increased likelihood of reporting any or the classic
symptoms, but are less likely to report loss of taste and smell. Cough, sore throat,
fatigue, myalgia and fever were more commonly reported with no difference in
the gastrointestinal symptoms, shortness of breath or headaches.
As previously noted, the best way to reduce the likelihood of new variants
emerging is to keep infection rates low. Relaxing measures too early or quickly
will lead to large numbers of hospitalisations and deaths (high confidence).
As of 10 February, hospital occupancy remains high however levels are declining
and are now around the level seen at the peak in April. The weekly number of
deaths reported through rapid surveillance has decreased in the most recent
week, but remains high. Deaths reported by ONS are around 300 per week (as
of 5 February) and lag rapid surveillance but are more complete.
In ONS antibody analysis, it is estimated that 1 in 7 people aged 16 and over
tested positive for antibodies in the 28 days up to 01 February 2021, suggesting
they have had the virus or have been vaccinated.
Analysis from the RECOVERY trial has shown that tocilizumab (a drug also used
to treat arthritis) reduces risk of death, shortens length of stay and reduces need
for mechanical ventilation for hospitalised patients.
Papers from SAGE considered by the Technical Advisory Cell are published
here.
Page 2 of 21
TAC ADVICE ONLY NOT WELSH GOVERNMENT POLICY
Growth rate and Reproduction number
The Reproduction (Rt) number is the average number of secondary infections
produced by a single infected individual. Rt is an average value over time,
geographies, and communities. This should be considered when interpreting the
R estimate for the UK given the differences in policies across the four nations.
The most recent estimate of the Reproduction number (Rt) for Wales from SAGE
(as approved on 11 February) is predicted to be between 0.7 and 0.9 (90%
confidence interval). The estimate of Rt is shown as a range without a central
estimate and is a lagging indicator, based on the latest data available up to 8
February.
The current daily growth rate estimated by SAGE (as approved on 11 February)
is between -0.06 and -0.02 (90% confidence interval) in Wales, indicating that
infections could be shrinking by between -6% and -2% per day.
Public Health Wales also estimate Rt for Wales using data on the number of
positive cases. These estimates should be interpreted with caution may be
effected by changes in testing patterns. As at 5 February, Rt in Wales is
estimated to be between 0.82 and 0.86 (95 % confidence interval).
Care should still be taken when interpreting Rt and growth rate estimates for the
UK, due to their inherently lagged nature, testing availability and, as these figures
mask variation in the number of infections, how rates of transmission are
changing in some parts of the country.
Halving time
As at 9 February, Public Health Wales estimated the halving time (the time it
takes for the number of cases to half) to be 80.7 days, using data from
23/01/2021 to 05/01/2021 (see Figure below). The 95% confidence interval for
this estimate is between a halving time of 17.7 days and a doubling time of 31.7
days. It should be noted that as the growth rate of cases tends to zero, the
estimates of doubling times tends to infinity.
Halving time (and Rt and growth rates), gives an indication of the rate of change
and therefore it should be treated with caution for the reasons outlined above.
Page 3 of 21
TAC ADVICE ONLY NOT WELSH GOVERNMENT POLICY
International update
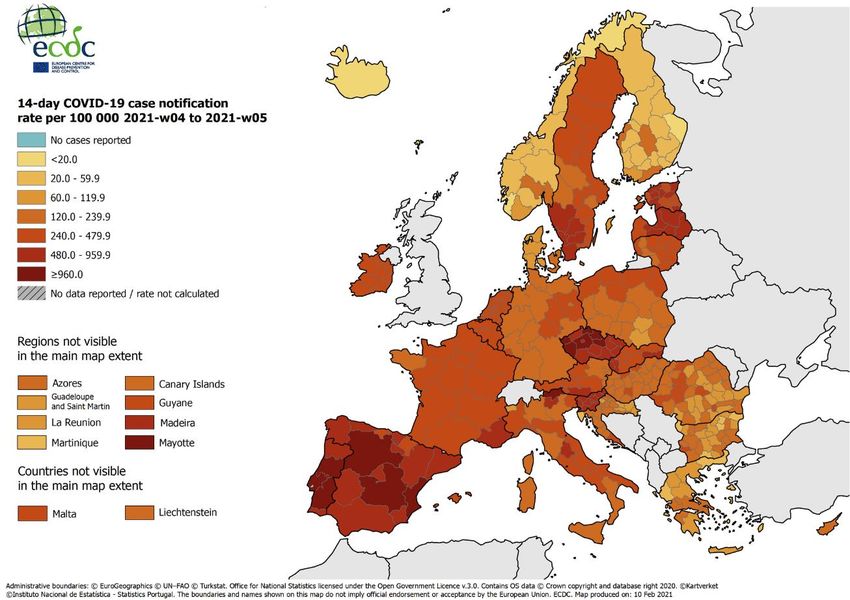
The map below shows the 14-day average notification rate per 100,000 people
in Europe. The UK is not included due to Brexit.
The general situation in Europe is one of continuing steadiness (steady state of
neither increasing nor decreasing daily case rates) in some countries and
declining daily infection rates in other countries. The two countries of major
concern through January, Spain and Portugal, are showing sharply declining
daily infection rates and are approaching levels last seen before the Christmas
festivities. This improving picture is being achieved only by the continued
imposition of strict NPI controls, although the strictness varies across different
countries. In France, which has one of the less strict NPI regimes, daily infection
rates are showing worrying signs that a general increase may be on the way but
it is too early to tell. In general across Europe, death rates are declining also but
with the usual lag behind infection rates.
The exception to the above are Bulgaria and Greece. These neighbouring
countries are showing real sustained increases (i.e. above the noise in the data)
but from a low point of infection (i.e. rising from the trough) and, should these
increases continue, they would represent significant new waves. These will be
monitored in the near future.
Page 4 of 21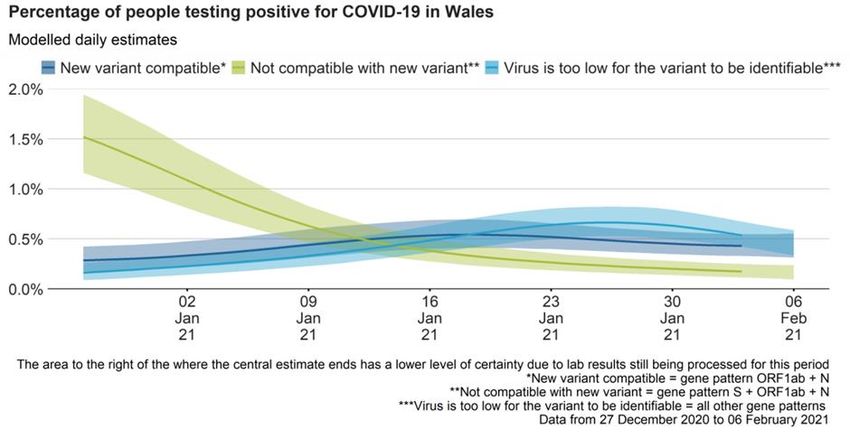
TAC ADVICE ONLY NOT WELSH GOVERNMENT POLICY
Globally, WHO reports a total of 107 million confirmed cases with 2.35 million
deaths, but the overall infection rate has declined by about 1/3 (one third) from
the peak rate of about a month ago. This improving picture is due to the
maintenance of NPI controls because it is too early for the vaccination
programmes to be having an effect.
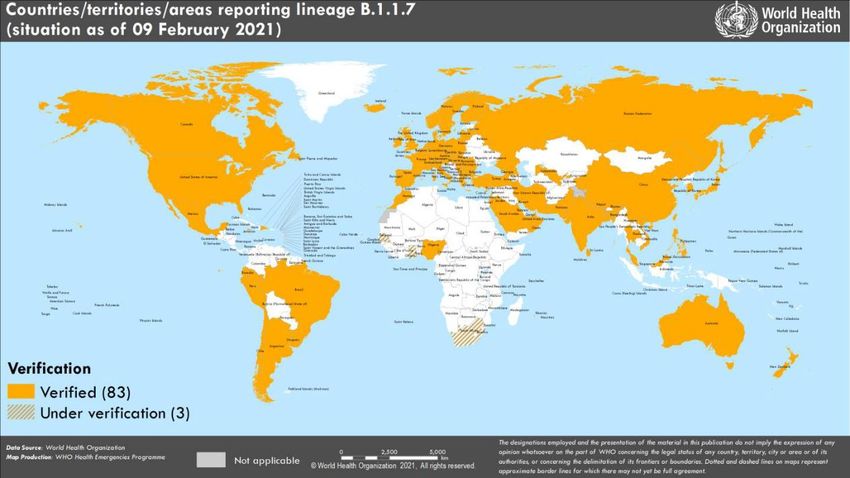
The Kent Variant of Concern is spreading rapidly across many countries of the
world and WHO expects it to be the dominant variant in about one month’s time
(see map below).
The vaccines roll out continues with Israel having administered at least one jab
to 70% of its population, UAE at 48%, UK at 20%, USA at 14% and with most
European countries in the range 3% to 5%.
Data on the picture across Europe, including caveats around data lags and
variable testing policies is available here.
Page 5 of 21
TAC ADVICE ONLY NOT WELSH GOVERNMENT POLICY
Case numbers
The figure below shows that numbers of confirmed COVID-19 cases per day (7
day rolling sum, per 100,000 of the population). Cases continue to show a
downward trend.
Source: Data from Public Health Wales as of 8 February
Age profile
The Figure below shows the number of confirmed COVID-19 episodes per
100,000 population, by week of sample collection and age group. The darker red
indicates an increased number of weekly cases.
According to Public Health Wales, during week 05, incidence decreased in all
age groups, incidence was highest in those aged 85+
Source: Welsh Government dashboard, data from Public Health Wales as at 10
February.
Page 6 of 21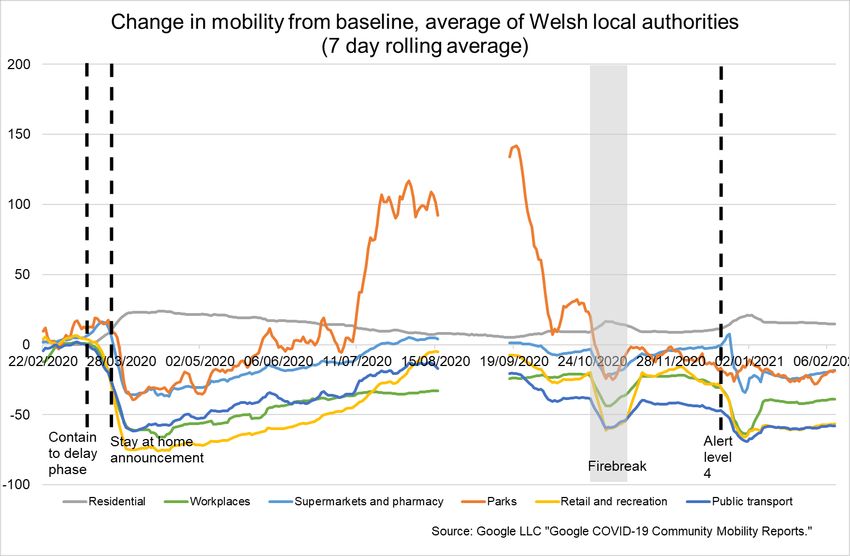
TAC ADVICE ONLY NOT WELSH GOVERNMENT POLICY
Covid-19 Infection Study results (Office for National Statistics)
For the week 31 January to 6 February 2021, an average of 1.16% of the
community population had COVID-19 (95% credible interval: 0.98% to 1.37%).
This equates to approximately 1 person in every 85 (95% credible interval: 1 in
100 to 1 in 75), or 35,300 people during this time (95% credible interval: 29,700
to 41,500).
The Figure below shows the latest estimates for positivity rates (%) since 27
December 2020 across the 4 UK Nations. There is some uncertainty around the
individual point estimates for the nations. Estimates for the last few days of the
series, shown as dashed lines in the chart below, have more uncertainty.
Source: Coronavirus (COVID-19) Infection Survey, ONS, 10/02/21
The percentage of people testing positive for strains compatible with the new
variant, not compatible with the new variant, and where the virus is too low for
the variant to be identifiable have decreased in the most recent week. See Figure
below.
Page 7 of 21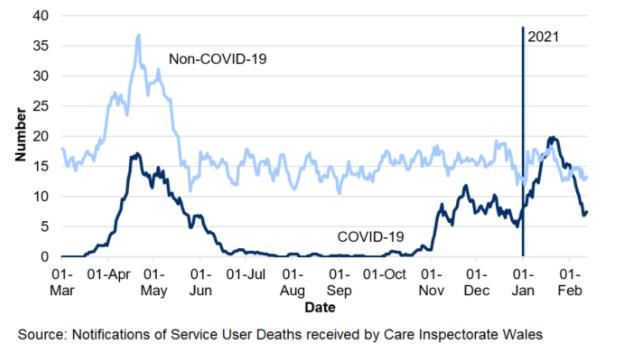
TAC ADVICE ONLY NOT WELSH GOVERNMENT POLICY
Source: Coronavirus Infection Survey, ONS, 10/02/21
Symptoms
When analysing those testing positive with a strong positive test (cycle threshold
(Ct) less than 30) between 1 October 2020 and 30 January 2021, 55% of people
in Wales who tested positive for COVID-19 (95% confidence intervals: 49% to
62%) reported having any symptoms. The most commonly reported symptoms
among people testing positive were cough, fatigue and headache. Results
should be treated with caution due to the smaller sample sizes of people who
have a strong positive test compared to England.
In UK cases that had a Ct value less than 30, between 15 November 2020 and
16 January 2021:
o People testing positive compatible with the new UK variant were more likely
to report any symptoms and the classic symptoms (cough, fever, shortness
of breath, loss of taste or loss of smell), but were less likely to report loss of
taste and smell.
o Other symptoms were more common in new variant compatible positives,
with the largest differences for cough, sore throat, fatigue, myalgia and fever.
There is no evidence of difference in the gastrointestinal symptoms,
shortness of breath or headaches.
Further information on this provisional analysis is available here.
Page 8 of 21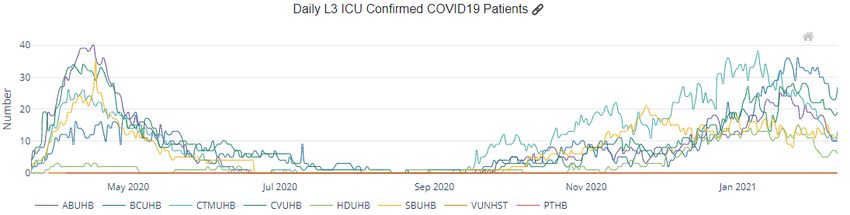
TAC ADVICE ONLY NOT WELSH GOVERNMENT POLICY
Antibodies
In Wales, an estimated 14.4% of the population would have tested positive for
antibodies to SARS-CoV-2 from a blood sample (95% confidence interval: 12.1%
to 17.0%) in the 28 days up to 1 February 2021.
It is estimated that an average of 365,000 people aged 16 years and over in
Wales would have tested positive for antibodies during this time (95% confidence
interval: 306,000 to 431,000). This equates to 1 in 7 people aged 16 years and
over (95% confidence interval: 1 in 8 to 1 in 6).
Though there is uncertainty with the estimates, it does appear that antibody rates
have increased in recent months.
Antibody levels in the blood can decline over time, meaning that some people
who have previously had COVID-19 may subsequently test negative for
antibodies. For this reason, these figures should be regarded as estimates of
monthly prevalence, not cumulative exposure.
In Wales, the percentage of people aged 80 years and over testing positive for
antibodies was 12.7% (95% confidence interval: 4.5% to 26.4%). The highest
percentage of people testing positive for antibodies was those aged 16 to 24
years at 32.6% (95% confidence interval: 21.6% to 45.2%). The lowest number
of people testing positive for antibodies was in those aged 70 to 74 years at 5.9%
(95% confidence interval: 2.5% to 11.5%). Caution should be taken as credible
intervals are wide and the sample size is relatively low. See Figure over page;
the blue bars give point estimates and the horizontal lines indicate the 95%
confidence intervals.
Page 9 of 21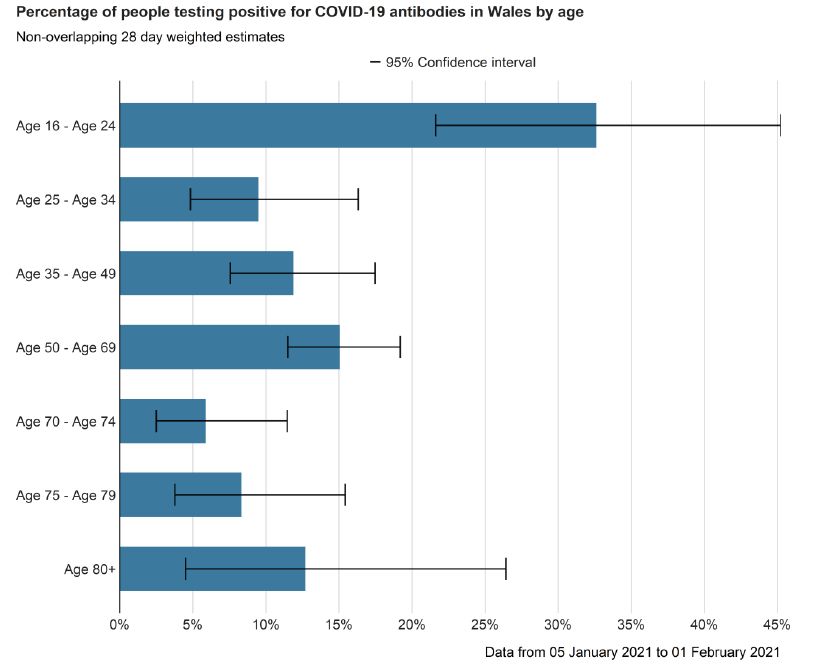
TAC ADVICE ONLY NOT WELSH GOVERNMENT POLICY
Source: Coronavirus (COVID-19) Infection Survey, ONS, 10/02/21
These data are helpful because they are the only estimates of infection covering
asymptomatic as well as symptomatic cases, and they are not affected by other
factors such as testing capacity or the number of people coming forward for
testing. The results are for private households only – the ‘community population’
– and do not apply to those in hospitals, care homes or other institutional settings.
However there is a greater lag in data from the infection survey than from other
sources such as Public Health Wales. It is also important to stress the uncertainty
around these estimates. Since the survey picks up relatively few positive tests
overall, the results can be sensitive to small changes in the number of these
positive tests. The sequencing data from Public Health Wales for positive cases
may be more robust and less subject to a time lag, even though it generally only
includes people who have chosen to be tested.
Full results are published here for Wales and here from the ONS.
Vaccination in Wales
As at 10 February, a total of 684, 097 first doses of COVID-19 vaccine have
been given in Wales. 3,795 people have received two doses.
The actual number of doses will be higher due to ongoing data entry.
Page 10 of 21TAC ADVICE ONLY NOT WELSH GOVERNMENT POLICY
Vaccinations data is available from the PHW tableau.
Deaths
The Figure below shows the 7 day rolling sum of COVID-19 deaths reported by
Public Health Wales rapid mortality surveillance as at 8 February. The weekly
number of deaths reported has decreased in the most recent week, but remains
high at around 150 per week. Care should be taken in interpreting the most
recent trends.
Source: Welsh Government dashboard, data from Public Health Wales as at 8
February
It is important to note that this data includes reports of a death of a hospitalised
patients in Welsh hospitals or care homes where COVID-19 has been confirmed
with a positive laboratory test and the clinician suspects COVID-19 was a factor
that caused death. It does not include patients who may have died from COVID-
19 but who were not confirmed by laboratory testing, those who died in other
settings, or Welsh residents who died outside of Wales. The true number of
deaths will be higher.
The Office for National Statistics (ONS) reports on both suspected and confirmed
COVID-19 deaths using data available on completion of the death registration
process and whilst subject to a time lag, is more complete.
In Wales, of the deaths registered in the week ending 5 February 2021, there
were provisionally 314 deaths involving COVID-19 registered in Welsh residents.
This was 35% of all deaths and 47 fewer than the previous week. The number of
registered deaths involving Covid has declined for three successive weeks.
Page 11 of 21TAC ADVICE ONLY NOT WELSH GOVERNMENT POLICY
The Figure below shows ONS data of the number of deaths involving COVID-19
registered by week in Wales and the number of all cause deaths registered by
week from 28 December 2019 to 5 February 2021.
Source data: Office for National Statistics
Deaths in care homes
At the start of November 2020 there was an increase in the number of COVID-
19 related deaths notified to CIW. There was a further increase in January 2021
that briefly exceeded the number seen at the end of April 2020. In the latest week
the average number of COVID-19 deaths is between 5 and 10 each day, which
is similar to the number observed in November 2020.
As notified to Care Inspectorate Wales (CIW), between 1 March 2020 and 12
February 2021, care home resident deaths with suspected or confirmed COVID-
19 has made up 24% of all reported deaths.
The Chart below shows notifications of deaths of adult care home residents with
confirmed or suspected COVID-19 by location of death and day of notification (7
day rolling sum, between 1 March 2020 and 12 February 2021).
Page 12 of 21TAC ADVICE ONLY NOT WELSH GOVERNMENT POLICY
Further information on care home deaths from Care Inspectorate Wales is
available here. Please note these are provisional figures to help monitor the
impact of COVID-19. They are not comparable with data from Public Health
Wales.
Deaths data from the Office for National Statistics is subject to a time lag, but will
be more complete and report higher numbers of deaths. Deaths involving
COVID-19 in care homes accounted for 45.5% of deaths, a decrease from Week
4 (49.0%), See here for further information.
Adherence and understanding of current measures
There is new data from Public Health Wales this week. The results IPSOS MORI
are the same as last week.
The most recent IPSOS MORI data for the period 29 January – 1 February for
Wales shows a similar picture to the last survey wave which was 2 weeks prior
(15-19 January). It should be noted that this is self-reported adherence and will
be affected by individuals understanding of the rules and the circumstances that
apply to them.
The figure below represents data collected online by IPSOS MORI as part of a
multi-country survey on the Global Advisor platform. Each of the waves has
included c.500 respondents in Wales. The sample is broadly representative of
the adult population aged 16-74. Data is weighted to reflect the age and gender
profile of the Welsh population aged 16-74. All samples have a margin of error
around them. For a sample of around 500, this is +/- 4.8 percentage points.
Page 13 of 21TAC ADVICE ONLY NOT WELSH GOVERNMENT POLICY
The latest results from the Public Engagement Survey on Health and Wellbeing
during Coronavirus Measures for the period 1 February – 7 February show that
53% of people say they understand the current restrictions in Wales ‘very well’.
A further 37% reported understanding the restrictions ‘fairly well’. The survey also
shows that 49% of people said they were following coronavirus restrictions
‘completely’ and a further 42% reported majority compliance, again similar to the
last two surveys and higher than in mid-December (before alert level 4 started).
20% reported having people outside their household/permitted extended
household come into their house, whilst 10% reported going into others people’s
houses, both of these are lower than in mid-December and similar to the last two
surveys.
Mobility
Mobility data for the second week in February (to the 15th) from Facebook and
Apple show a similar picture compared to the previous week. Data from Google
and O2 for the previous week in February show increases relative to the previous
7 days. Levels of mobility continue to be mostly around the second week of the
firebreak.
Page 14 of 21TAC ADVICE ONLY NOT WELSH GOVERNMENT POLICY
Mobility of Facebook users in Wales shows movement was 28% below the
baseline for the week to the 13 February. This is the same as the week before.
The percentage of users staying put (near to home) was 34%, also the same as
the week before. The baseline is the average value, for the corresponding day of
the week, during the 4-week period 2 February – 29 February 2020.
Apple data for the week to the 13 February shows that requests for driving
directions in Wales were up slightly from the previous week at 75% of the
baseline (up from 74%). Requests for walking directions and requests for public
transport directions were similar to the previous week relative to the baseline.
The baseline is the 13th of January 2020.
The Google mobility data to the week of the 9 February for residential (i.e people
spending time at home) are similar to the week before at 15% above the baseline.
Workplaces were up slightly (at 39% below the baseline, up from 40%). Retail &
recreation mobility was up from last week (57% below the baseline, up from 58%)
whilst supermarkets & pharmacy show an increase (19% below the baseline, up
from 26%). Public transport and parks increased over the week relative to the
baseline.
The figure below shows the change in mobility in Wales using Google mobility
data. The figures are based on the average of the local authorities that have data.
The baseline is the median value, for the corresponding day of the week, during
the 5-week period Jan 3–Feb 6, 2020. The data for several categories is not
available for August 17th – September 10th due to the data not meeting quality
thresholds.
Page 15 of 21TAC ADVICE ONLY NOT WELSH GOVERNMENT POLICY
Anonymised and aggregated mobile phone data from O2 for the week to the 5
February shows an increase in trips compared to the week before. Trips starting
in Wales rose by 3 percentage points to 55% of the baseline. The baseline for
the O2 data is the same day of the week in the first week of March.
Research
There are currently 11,971 Welsh patients recruited to COVID-19 urgent public
health studies, an increase of 926 since last report.
COVID-19 weekly surveillance and epidemiological summary from Public Health
Wales
As at 11 February
The proportion of calls to NHS 111 and NHS Direct related to possible COVID-
19 symptoms increased compared to the previous week.
Overall GP consultations for any Acute Respiratory Infection (ARI) and
suspected COVID have decreased this week compared to the previous week.
The number of ambulance calls possibly related to COVID-19 decreased in the
most recent week compared to the previous week.
Page 16 of 21TAC ADVICE ONLY NOT WELSH GOVERNMENT POLICY
The all-Wales number of lab confirmed COVID-19 episodes has continued to
decrease in the most recent week. Sample positivity for testing episodes was at
8% in week 05.
During week 05, incidence decreased in all age groups, incidence was highest
in those aged 85+
Confirmed case incidence and testing episode positivity has decreased in most
regions of Wales in recent weeks, with the exception of Powys which has
remained stable.
At a national level, confirmed case admissions to hospitals and confirmed cases
who are inpatients in hospital decreased compared to the previous week. In the
most recent week, admissions to critical care wards decreased compared to the
previous weeks.
Recent surveillance data suggest that COVID-19 infections in Wales is
decreasing in most regions of Wales. Cases remain geographically widespread,
however the majority of local authority (LA) areas are seeing decreasing overall
trends in confirmed case incidence in the most recent week.
There is an overall decreasing trend in incidents reported in recent weeks, with
care homes still accounting for the highest proportion.
Most school pupils are currently being taught online, with some face-to-face
learning for vulnerable children and children of critical workers. Schools
surveillance information is available on the Public Health Wales dashboard.
VOC 202012/01 (VOC1, identified in Kent) continues to increase in all parts of
Wales with between 60% and 99% of recent cases being VOC1 (identified by the
proxy indicator SGTF) across Health Boards, and 2,293 genomically probable or
confirmed cases identified as of 10/02/2021. There have been 13 genomically
confirmed and probable cases of VOC 202012/01 (the variant linked to South
Africa) in Wales (as of 10/02/2021). No cases of the variants linked to Brazil have
yet been identified in Wales.
All-cause deaths are higher compared to the 5 year average, but decreased in
the most recent week.
Deaths in confirmed cases in hospital, reported through PHW mortality
surveillance decreased in the most recent week, but remain high.
Page 17 of 21TAC ADVICE ONLY NOT WELSH GOVERNMENT POLICY
In deaths where information is available from PHW rapid mortality surveillance,
chronic heart disease, diabetes and chronic respiratory disease are the most
commonly reported risk factors (in 34%, 28% and 22% of deaths respectively).
Influenza is not currently circulating in Wales.
Local authority analysis from Public Health Wales
(Period covering 31 to 06 February 2021)
All local authorities are in the highest threshold for 7-day incidence (> 50 per
100,000) and test positivity (>5%), apart from Ceredigion which is in the lower
bracket of 25 toTAC ADVICE ONLY NOT WELSH GOVERNMENT POLICY
As of 10 February the number of people with confirmed COVID-19 in hospital
has decreased over recent weeks, but remains high and is only slightly below
the April peak. Both overall ICU occupancy (COVID-19 and non-COVID-19
patients) and occupancy for COVID-19 patients only have started to show a
steady decline over the last 3-4 weeks but remains high. The number of people
recovering from COVID-19 is high, still at around 1,000, in the most recent week.
When considering data on capacity (231 beds) and occupancy (159 beds)
reported to us by local health boards, Level 3 ICU across Wales is approximately
69% occupied with both COVID and non-COVID patients (as of 10 February).
However, there are normally approximately 152 critical care beds (Level 3 ICU
equivalent) and so hospitals are creating additional critical care bed capacity due
to increased demand. Therefore, critical care units in Wales are at or over 100%
occupied for their normal critical care capacity and 1:1 nursing staffing ratio for
all critical patients may not possible for many patients, even with non-critical care
staff helping to care for patients.
The Figure below shows the total number of people who have tested Covid-19
positive and are in ICU in hospitals across the different health boards in Wales.
Data as of 10 February.
Page 19 of 21TAC ADVICE ONLY NOT WELSH GOVERNMENT POLICY
The Figure below shows the number of people admitted to hospital and are either
suspected (SUS) or confirmed as having Covid-19 (COV+). The purple line
represents the total number over a rolling 7 day average, whilst the fainter grey
lines show the actual figures at that time. Data as of 10 February.
The Figure below shows the number of hospital discharges of people who are
either suspected (SUS) or confirmed as having Covid-19 (COV+). The purple line
represents the total number over a rolling 7 day average, whilst the fainter grey
lines show the actual figures at that time. Data as of 10 February.
The Figure below shows patients admitted to the intensive care units and are
either suspected (SUS) or confirmed as having Covid-19 (COV+). The purple line
represents the total number over a rolling 7 day average, whilst the fainter grey
lines show the actual figures at that time. Data as of 10 February.
Page 20 of 21TAC ADVICE ONLY NOT WELSH GOVERNMENT POLICY
Professional Head of Intelligence Assessment (PHIA) probability yardstick
Where appropriate, TAC advice will express Likelihood or confidence in the
advice provided using the PHIA probability yardstick to ensure consistency
across the different elements of advice.
Page 21 of 21You can also read